Financial Ratio Analysis Report: Rangemaster PLC (2018-2019)
VerifiedAdded on 2023/01/11
|16
|3415
|70
Report
AI Summary
This report provides a comprehensive ratio analysis of Rangemaster PLC, evaluating its financial performance from 2018 to 2019. It examines various financial ratios, including liquidity ratios (current and quick ratios), activity ratios (inventory turnover, total assets turnover, fixed assets turnover, and accounts receivables turnover), leverage ratios (debt to assets and debt to equity), and profitability ratios (gross profit margin, net profit margin, and operating profit margin). The analysis includes the formulas for each ratio, along with interpretations of the results, comparing the company's performance across the two years. The report highlights improvements and areas of concern, offering insights into Rangemaster PLC's financial health and efficiency in managing its assets, debts, and profits. The conclusion summarizes the key findings, emphasizing the company's financial strengths and weaknesses based on the ratio analysis.
ELECTRONIC
FORMAT
1 | P a g e
FORMAT
1 | P a g e
Paraphrase This Document
Need a fresh take? Get an instant paraphrase of this document with our AI Paraphraser

2 | P a g e
Table of Contents
INTRODUCTION...........................................................................................................................3
ANALYSIS......................................................................................................................................4
1. Liquidity ratio:.........................................................................................................................4
1.1 Current Ratio.....................................................................................................................4
1.2 Quick Ratio........................................................................................................................5
2. Activity Ratio:.........................................................................................................................5
2.1 Inventory turnover ratio.....................................................................................................6
2.2 Total Assets Turnover Ratio..............................................................................................6
2.3 Fixed Assets Turnover Ratio.............................................................................................7
2.4 Accounts Receivables Turnover Ratio..............................................................................8
3. Leverage Ratios.......................................................................................................................8
3.1 Debt to Assets Ratio..........................................................................................................9
3.2 Debt to Equity Ratio..........................................................................................................9
4. Profitability ratio:...................................................................................................................10
4.1 Gross profit Margin.........................................................................................................10
4.2 Net Profit Margin.............................................................................................................11
4.3 Operating Profit Margin..................................................................................................11
5. Market Ratio.........................................................................................................................12
CONCLUSION..............................................................................................................................13
REFERENCES..............................................................................................................................14
3 | P a g e
⊘ This is a preview!⊘
Do you want full access?
Subscribe today to unlock all pages.
Trusted by 1+ million students worldwide
INTRODUCTION
The process of reviewing and evaluating a company's financial statements (such as balance
sheets or profit and loss statements), thereby enabling an understanding of the company's
financial health and making more effective decisions. Financial statements recorded financial
data; however, this information should be evaluated through financial statement analysis to
become more useful to investors, shareholders, managers, and other interested parties. Financial
statement analysis is an evaluation method to determine the present past and estimate the
performance of a company (Murthy, Manyam and Manjunatha, 2018). Several techniques are
commonly used as part of financial statement analysis, including horizontal analysis, which
compares two or more years of financial data in both dollar and percentage forms; Steep analysis
where shown as a percentage of the total account of each category of accounts on the balance
sheet; Ratio analysis, which calculates statistical relationships between data (Minhas, Mishra
and Swami, 2017). This project consists of various ratio analysis of Rangemaster plc from 2018
to 2019; these ratio analysis done for performance analysis of the company.
4 | P a g e
Paraphrase This Document
Need a fresh take? Get an instant paraphrase of this document with our AI Paraphraser
ANALYSIS
Ratio Analysis: Financial ratio analysis is a tool for examining and comparing relationships
between different pieces of financial information. You can use the information from your
company's income statement and balance sheet to calculate the financial ratio. Financial ratio
analysis can prove to be an important tool for your small business. First of all, you have to learn
to calculate the ratios and understand what they mean (Easton and Sommers, 2018). They are a
comparative tool of analysis for liquidity, profits, debt and asset management - all major
categories of financial ratio analysis.
Types of ratio analysis:
1. Liquidity ratio:
This ratios shows relationship between availability of cash on demand and ready for
consumption, and short-term (also known as quick ratio or acid test). It expresses the degree of
liquidity of a company and is one of the most significant financial ratios or ratios, for the
purposes of balance sheet analysis according to the coefficient method. As for banking the
problem of liquidity and, therefore, the search for the quick ratio (Karaömer and Özbirecikli,
2019).
Types of Liquidity ratio:
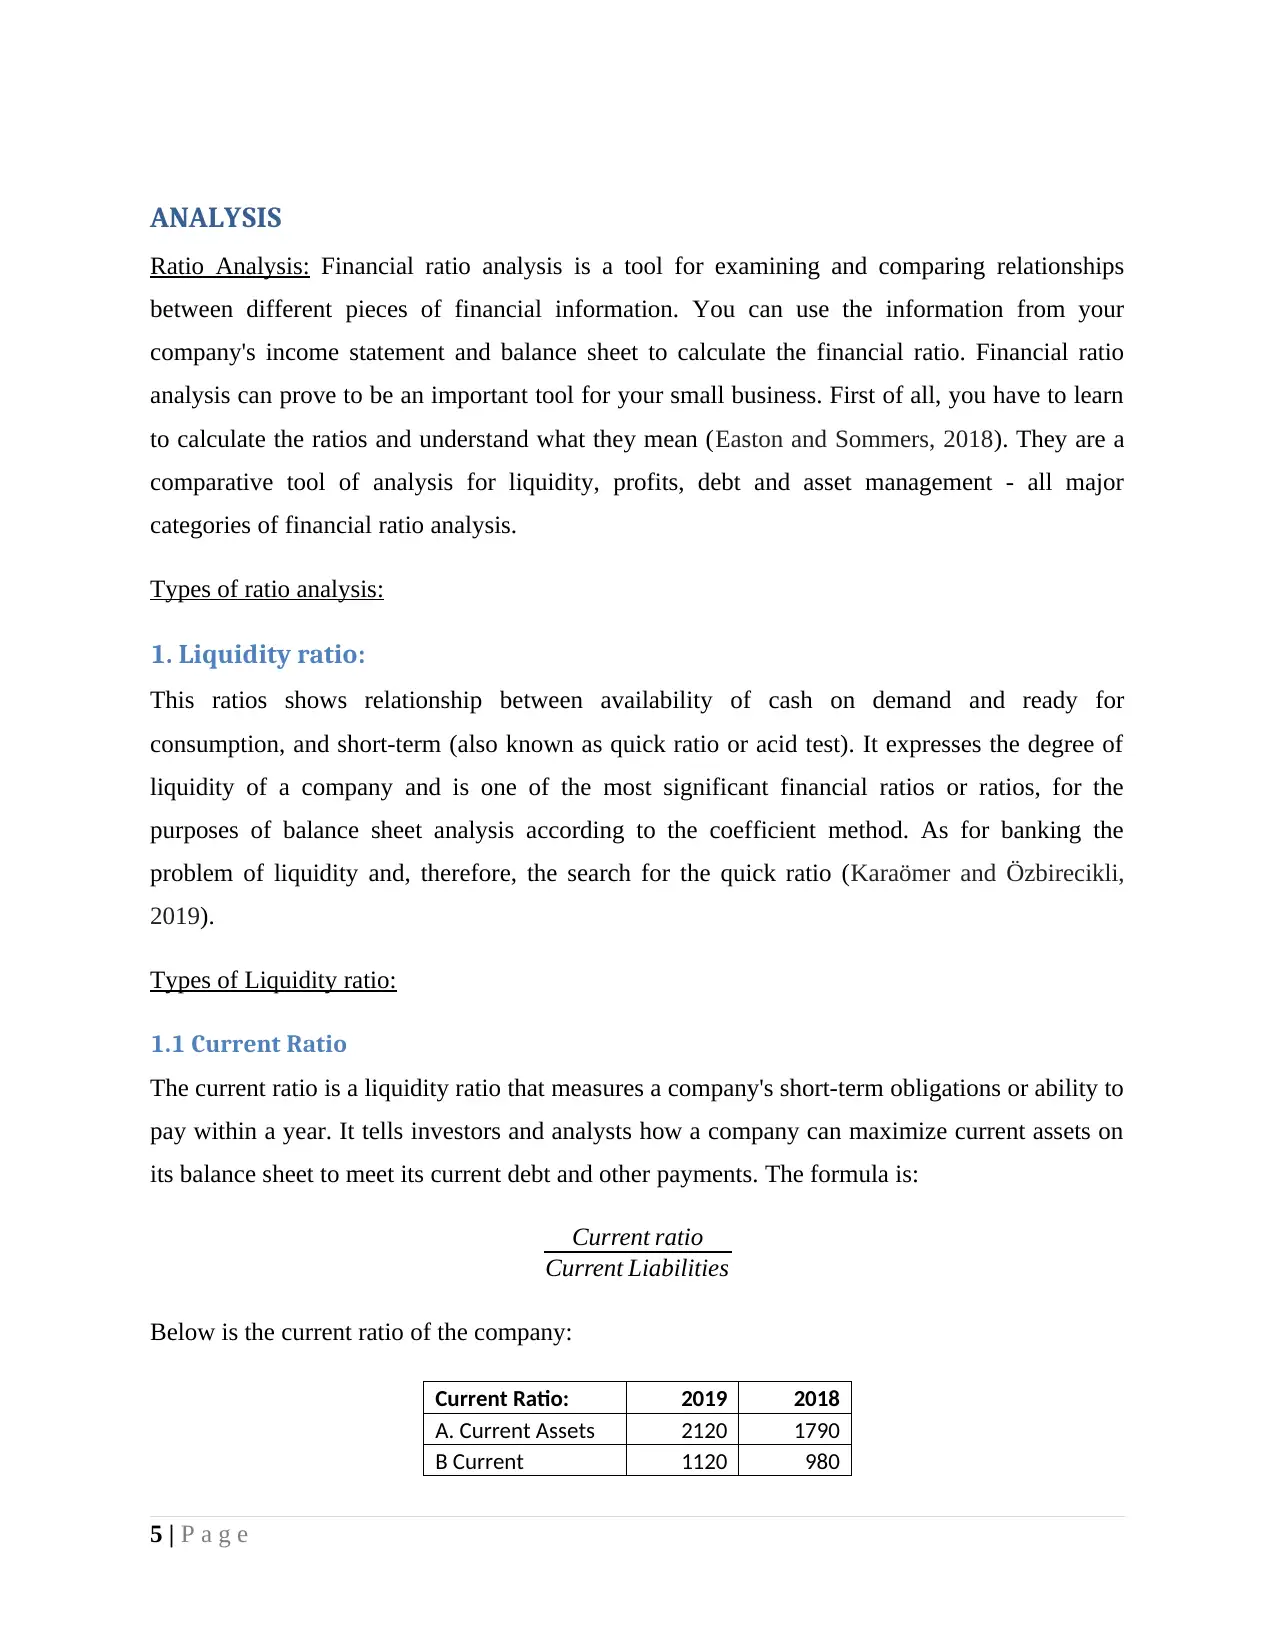
1.1 Current Ratio
The current ratio is a liquidity ratio that measures a company's short-term obligations or ability to
pay within a year. It tells investors and analysts how a company can maximize current assets on
its balance sheet to meet its current debt and other payments. The formula is:
Current ratio
Current Liabilities
Below is the current ratio of the company:
Current Ratio: 2019 2018
A. Current Assets 2120 1790
B Current 1120 980
5 | P a g e
Ratio Analysis: Financial ratio analysis is a tool for examining and comparing relationships
between different pieces of financial information. You can use the information from your
company's income statement and balance sheet to calculate the financial ratio. Financial ratio
analysis can prove to be an important tool for your small business. First of all, you have to learn
to calculate the ratios and understand what they mean (Easton and Sommers, 2018). They are a
comparative tool of analysis for liquidity, profits, debt and asset management - all major
categories of financial ratio analysis.
Types of ratio analysis:
1. Liquidity ratio:
This ratios shows relationship between availability of cash on demand and ready for
consumption, and short-term (also known as quick ratio or acid test). It expresses the degree of
liquidity of a company and is one of the most significant financial ratios or ratios, for the
purposes of balance sheet analysis according to the coefficient method. As for banking the
problem of liquidity and, therefore, the search for the quick ratio (Karaömer and Özbirecikli,
2019).
Types of Liquidity ratio:
1.1 Current Ratio
The current ratio is a liquidity ratio that measures a company's short-term obligations or ability to
pay within a year. It tells investors and analysts how a company can maximize current assets on
its balance sheet to meet its current debt and other payments. The formula is:
Current ratio
Current Liabilities
Below is the current ratio of the company:
Current Ratio: 2019 2018
A. Current Assets 2120 1790
B Current 1120 980
5 | P a g e
Liabilities
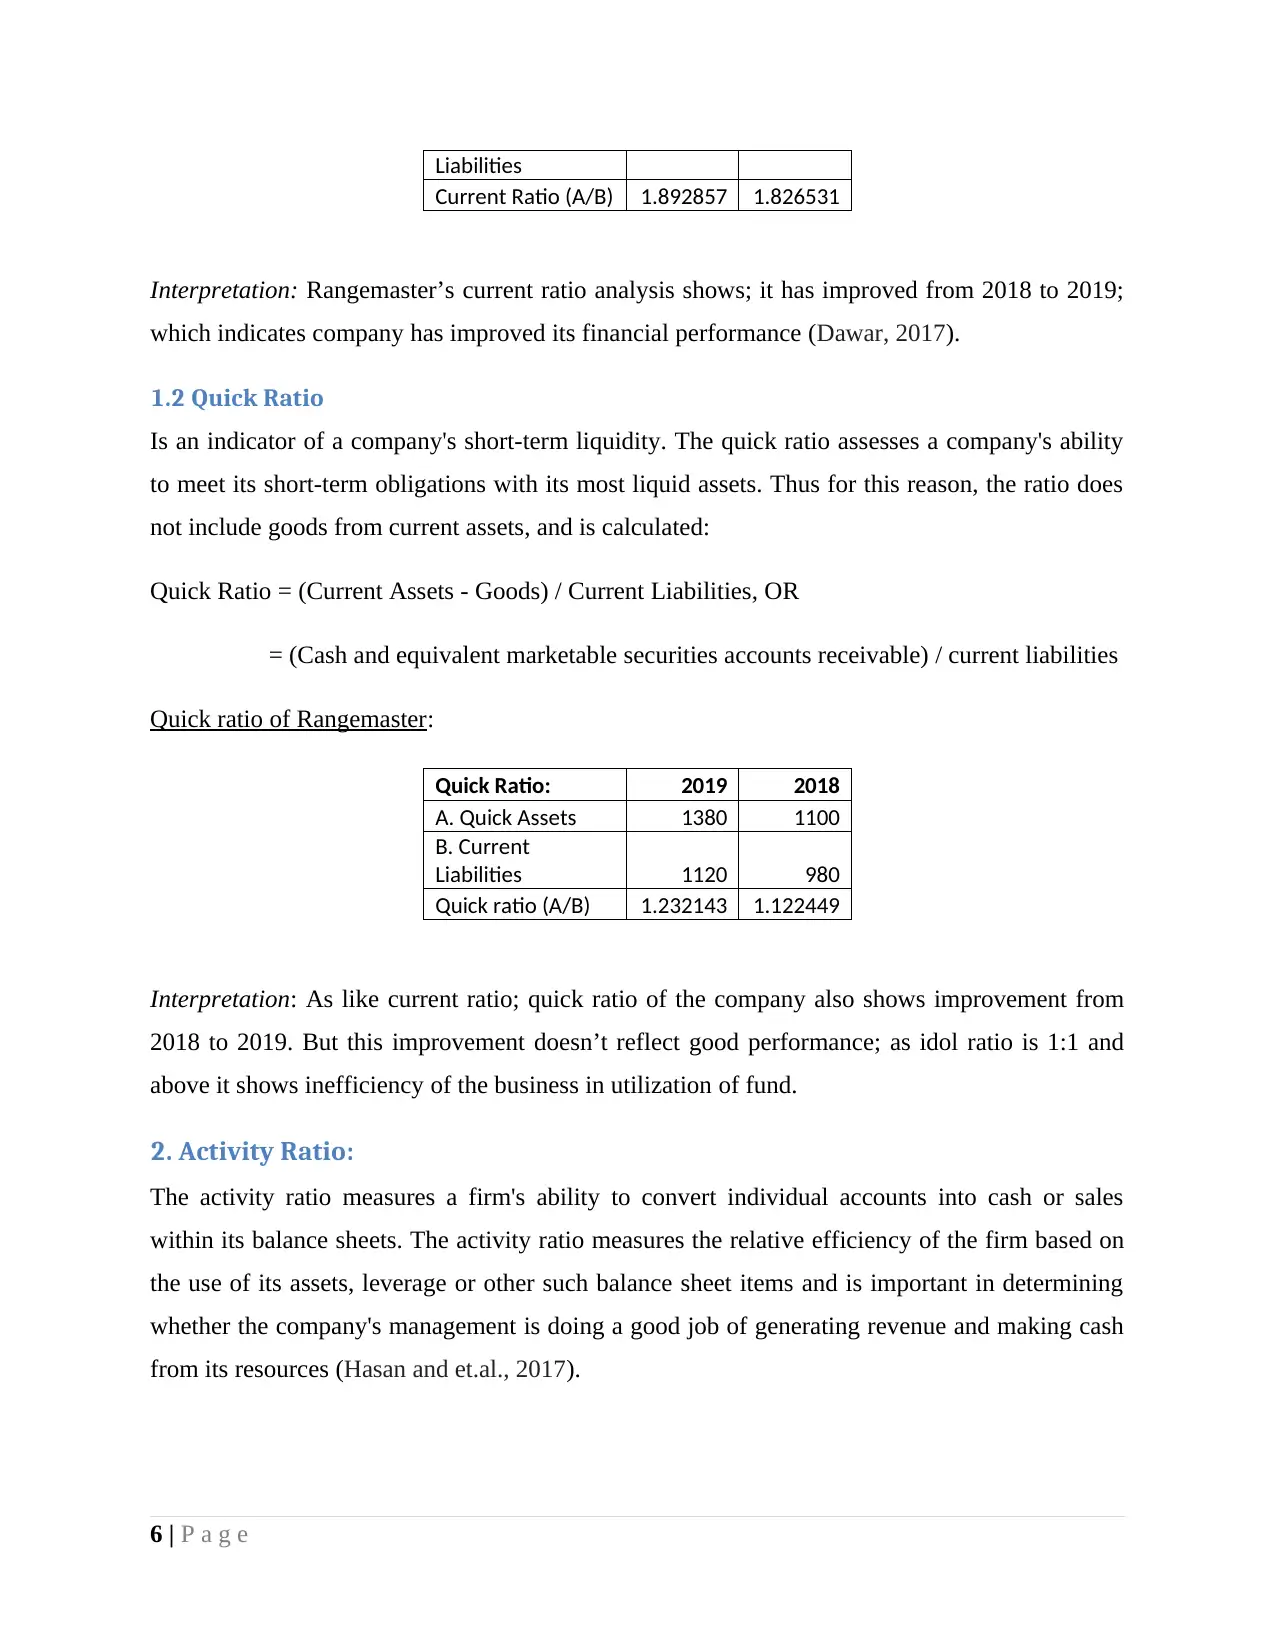
Current Ratio (A/B) 1.892857 1.826531
Interpretation: Rangemaster’s current ratio analysis shows; it has improved from 2018 to 2019;
which indicates company has improved its financial performance (Dawar, 2017).
1.2 Quick Ratio
Is an indicator of a company's short-term liquidity. The quick ratio assesses a company's ability
to meet its short-term obligations with its most liquid assets. Thus for this reason, the ratio does
not include goods from current assets, and is calculated:
Quick Ratio = (Current Assets - Goods) / Current Liabilities, OR
= (Cash and equivalent marketable securities accounts receivable) / current liabilities
Quick ratio of Rangemaster:
Quick Ratio: 2019 2018
A. Quick Assets 1380 1100
B. Current
Liabilities 1120 980
Quick ratio (A/B) 1.232143 1.122449
Interpretation: As like current ratio; quick ratio of the company also shows improvement from
2018 to 2019. But this improvement doesn’t reflect good performance; as idol ratio is 1:1 and
above it shows inefficiency of the business in utilization of fund.
2. Activity Ratio:
The activity ratio measures a firm's ability to convert individual accounts into cash or sales
within its balance sheets. The activity ratio measures the relative efficiency of the firm based on
the use of its assets, leverage or other such balance sheet items and is important in determining
whether the company's management is doing a good job of generating revenue and making cash
from its resources (Hasan and et.al., 2017).
6 | P a g e
⊘ This is a preview!⊘
Do you want full access?
Subscribe today to unlock all pages.
Trusted by 1+ million students worldwide
Types of Activity ratios;
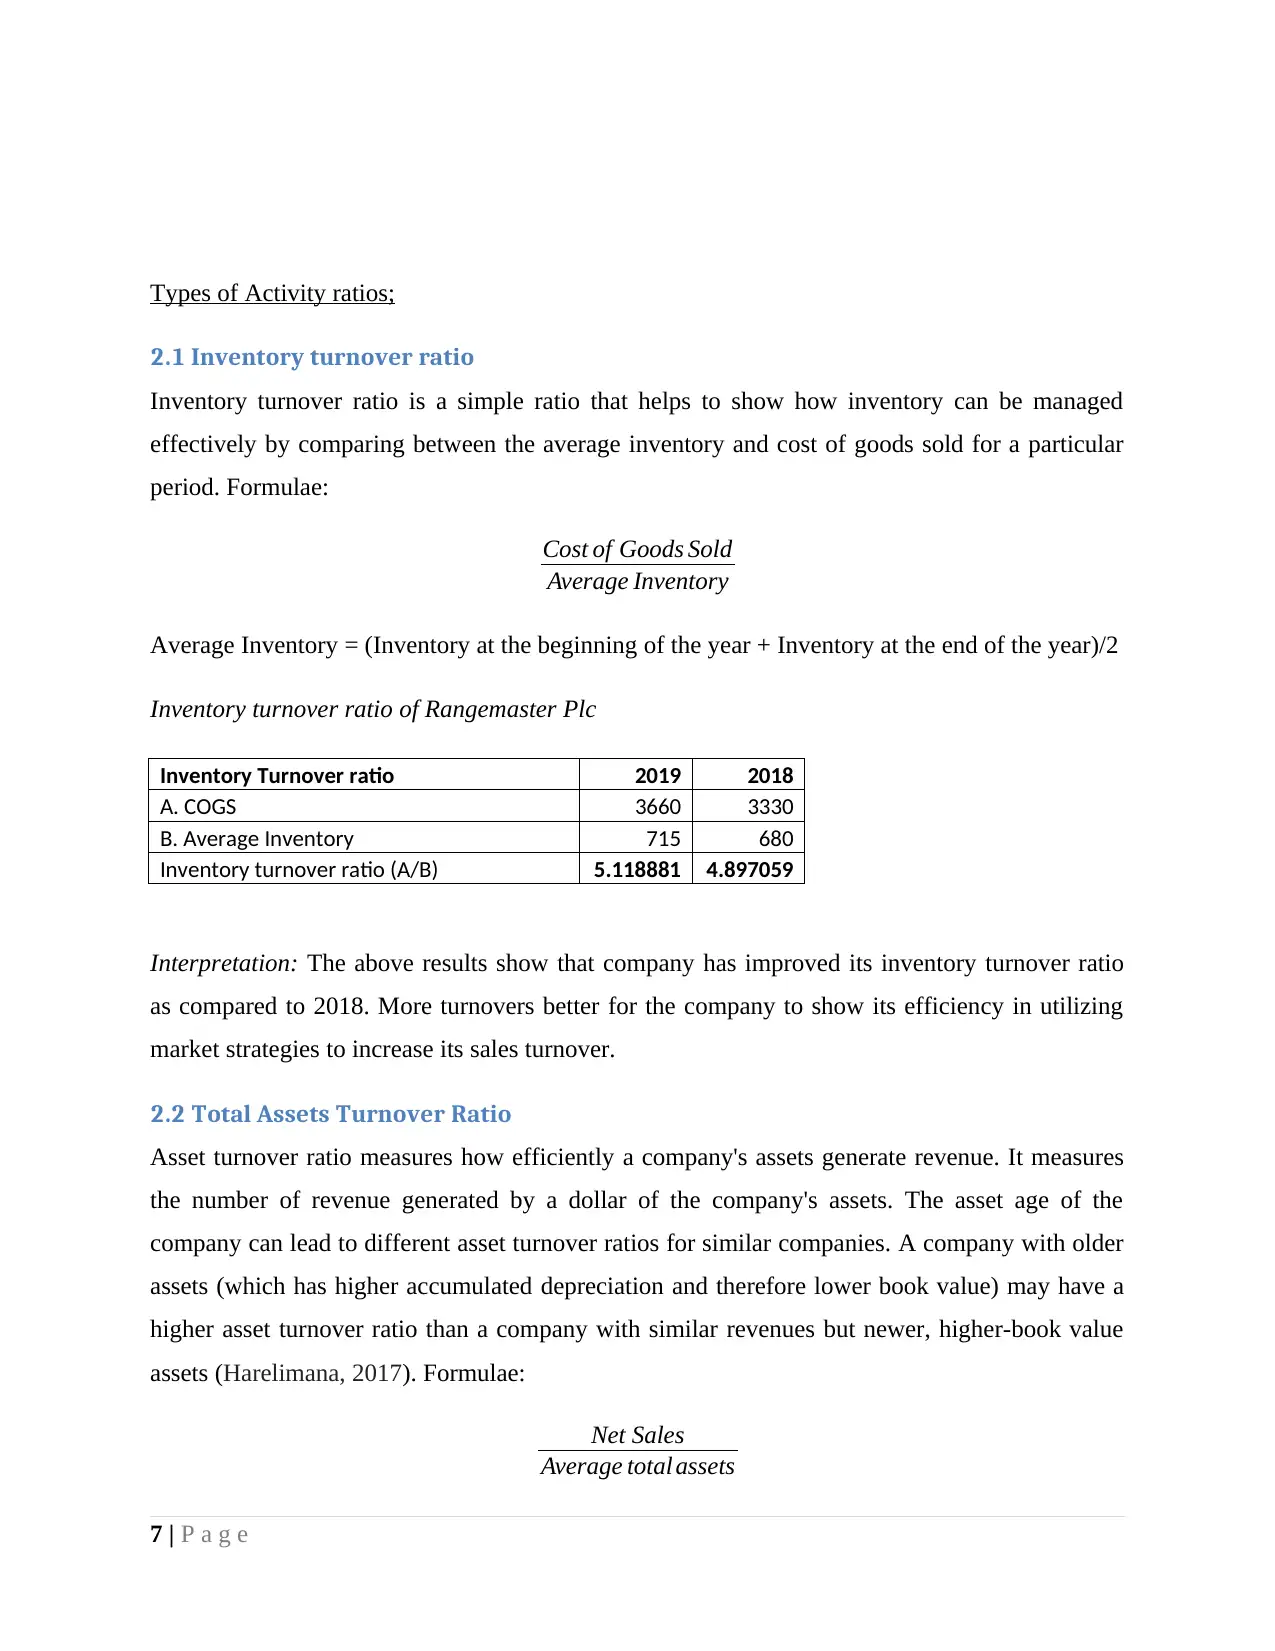
2.1 Inventory turnover ratio
Inventory turnover ratio is a simple ratio that helps to show how inventory can be managed
effectively by comparing between the average inventory and cost of goods sold for a particular
period. Formulae:
Cost of Goods Sold
Average Inventory
Average Inventory = (Inventory at the beginning of the year + Inventory at the end of the year)/2
Inventory turnover ratio of Rangemaster Plc
Inventory Turnover ratio 2019 2018
A. COGS 3660 3330
B. Average Inventory 715 680
Inventory turnover ratio (A/B) 5.118881 4.897059
Interpretation: The above results show that company has improved its inventory turnover ratio
as compared to 2018. More turnovers better for the company to show its efficiency in utilizing
market strategies to increase its sales turnover.
2.2 Total Assets Turnover Ratio
Asset turnover ratio measures how efficiently a company's assets generate revenue. It measures
the number of revenue generated by a dollar of the company's assets. The asset age of the
company can lead to different asset turnover ratios for similar companies. A company with older
assets (which has higher accumulated depreciation and therefore lower book value) may have a
higher asset turnover ratio than a company with similar revenues but newer, higher-book value
assets (Harelimana, 2017). Formulae:
Net Sales
Average total assets
7 | P a g e
Paraphrase This Document
Need a fresh take? Get an instant paraphrase of this document with our AI Paraphraser
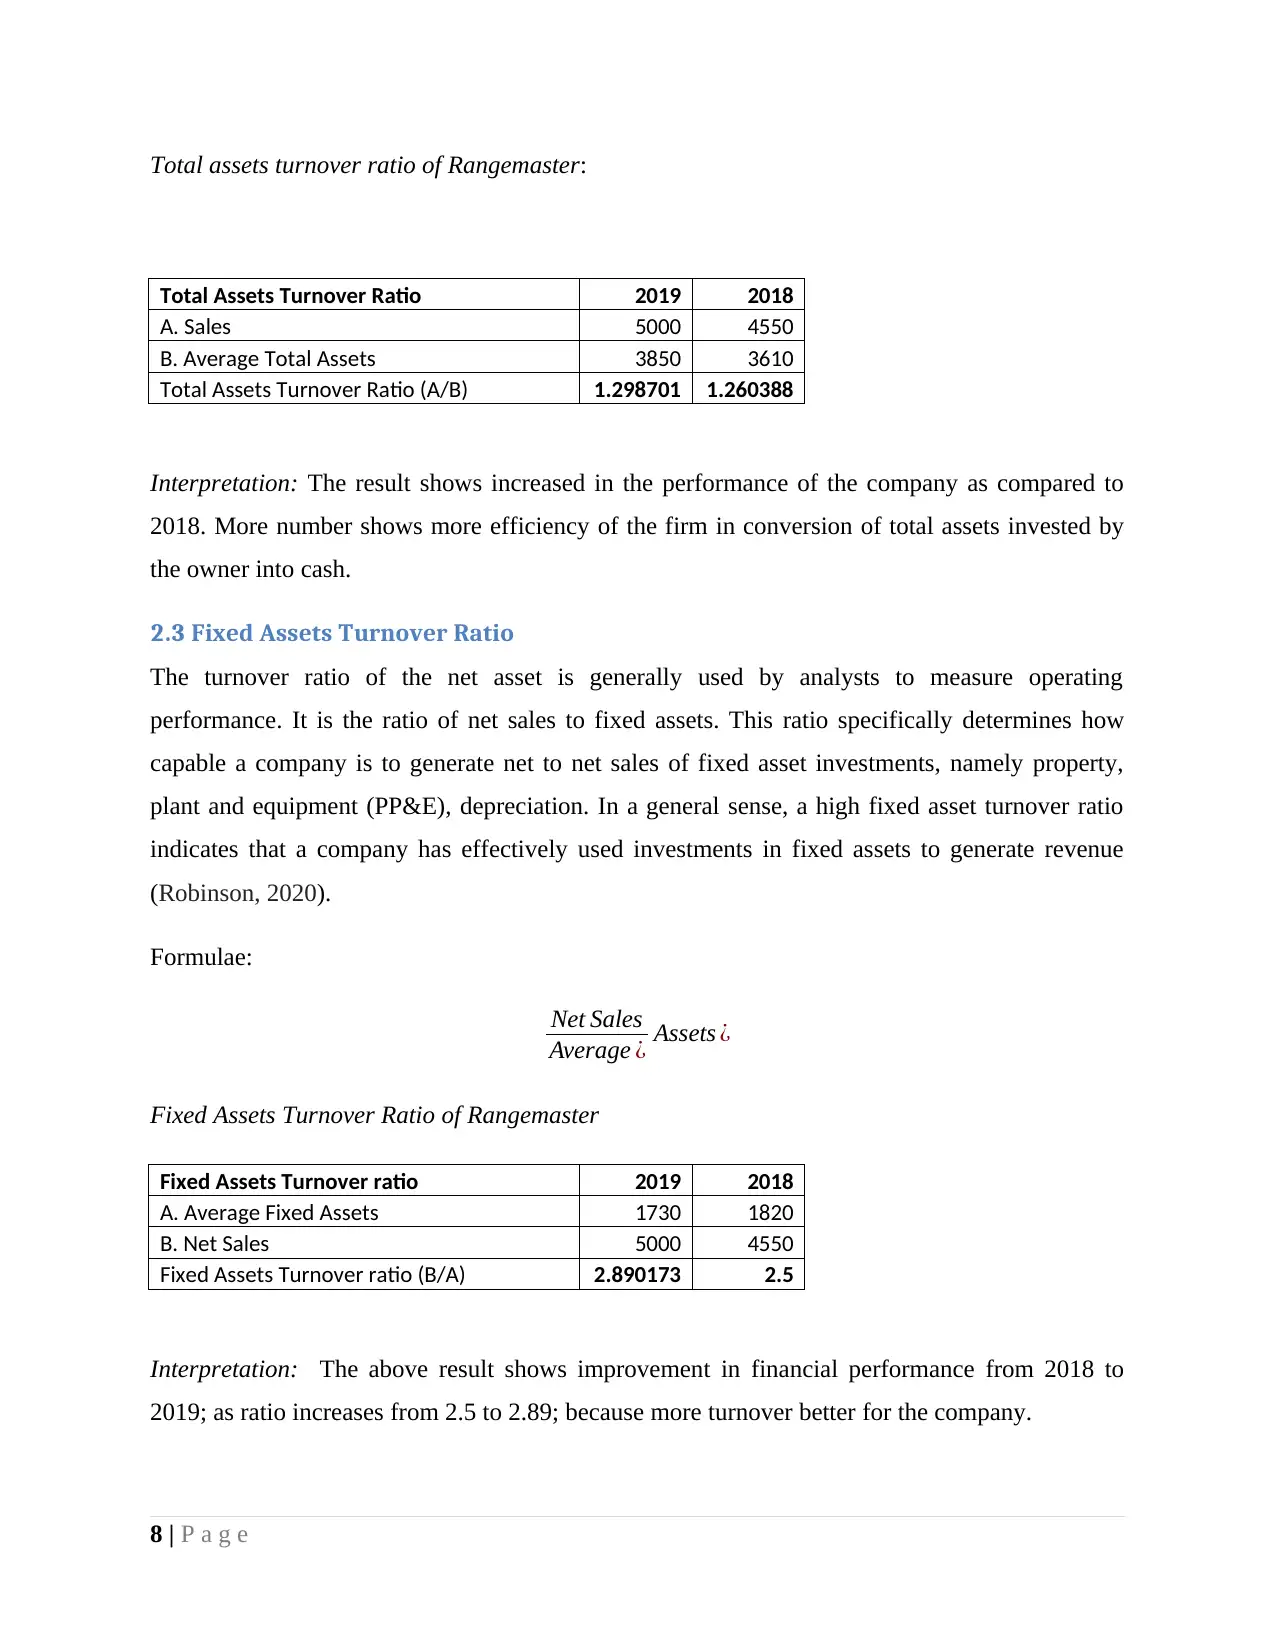
Total assets turnover ratio of Rangemaster:
Total Assets Turnover Ratio 2019 2018
A. Sales 5000 4550
B. Average Total Assets 3850 3610
Total Assets Turnover Ratio (A/B) 1.298701 1.260388
Interpretation: The result shows increased in the performance of the company as compared to
2018. More number shows more efficiency of the firm in conversion of total assets invested by
the owner into cash.
2.3 Fixed Assets Turnover Ratio
The turnover ratio of the net asset is generally used by analysts to measure operating
performance. It is the ratio of net sales to fixed assets. This ratio specifically determines how
capable a company is to generate net to net sales of fixed asset investments, namely property,
plant and equipment (PP&E), depreciation. In a general sense, a high fixed asset turnover ratio
indicates that a company has effectively used investments in fixed assets to generate revenue
(Robinson, 2020).
Formulae:
Net Sales
Average ¿ Assets ¿
Fixed Assets Turnover Ratio of Rangemaster
Fixed Assets Turnover ratio 2019 2018
A. Average Fixed Assets 1730 1820
B. Net Sales 5000 4550
Fixed Assets Turnover ratio (B/A) 2.890173 2.5
Interpretation: The above result shows improvement in financial performance from 2018 to
2019; as ratio increases from 2.5 to 2.89; because more turnover better for the company.
8 | P a g e
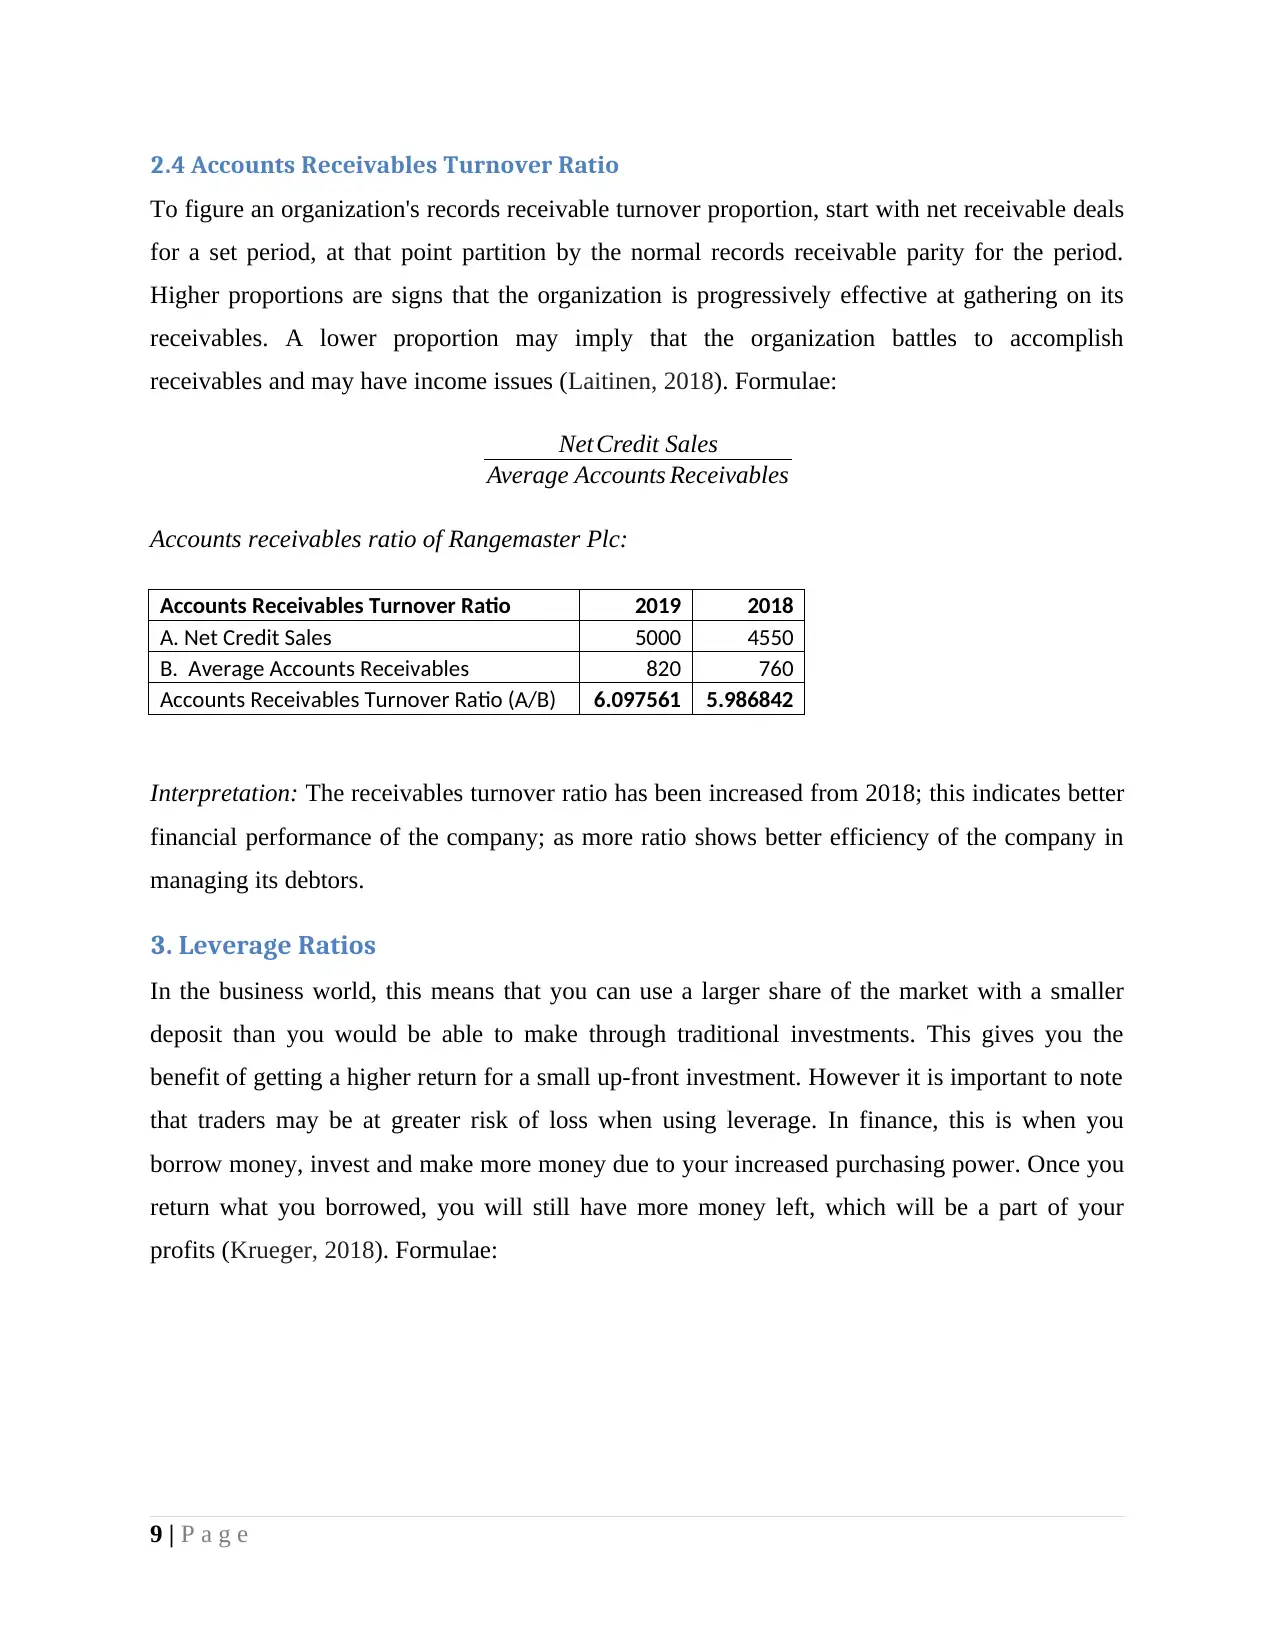
2.4 Accounts Receivables Turnover Ratio
To figure an organization's records receivable turnover proportion, start with net receivable deals
for a set period, at that point partition by the normal records receivable parity for the period.
Higher proportions are signs that the organization is progressively effective at gathering on its
receivables. A lower proportion may imply that the organization battles to accomplish
receivables and may have income issues (Laitinen, 2018). Formulae:
Net Credit Sales
Average Accounts Receivables
Accounts receivables ratio of Rangemaster Plc:
Accounts Receivables Turnover Ratio 2019 2018
A. Net Credit Sales 5000 4550
B. Average Accounts Receivables 820 760
Accounts Receivables Turnover Ratio (A/B) 6.097561 5.986842
Interpretation: The receivables turnover ratio has been increased from 2018; this indicates better
financial performance of the company; as more ratio shows better efficiency of the company in
managing its debtors.
3. Leverage Ratios
In the business world, this means that you can use a larger share of the market with a smaller
deposit than you would be able to make through traditional investments. This gives you the
benefit of getting a higher return for a small up-front investment. However it is important to note
that traders may be at greater risk of loss when using leverage. In finance, this is when you
borrow money, invest and make more money due to your increased purchasing power. Once you
return what you borrowed, you will still have more money left, which will be a part of your
profits (Krueger, 2018). Formulae:
9 | P a g e
⊘ This is a preview!⊘
Do you want full access?
Subscribe today to unlock all pages.
Trusted by 1+ million students worldwide
Types of Leverage Ratios:
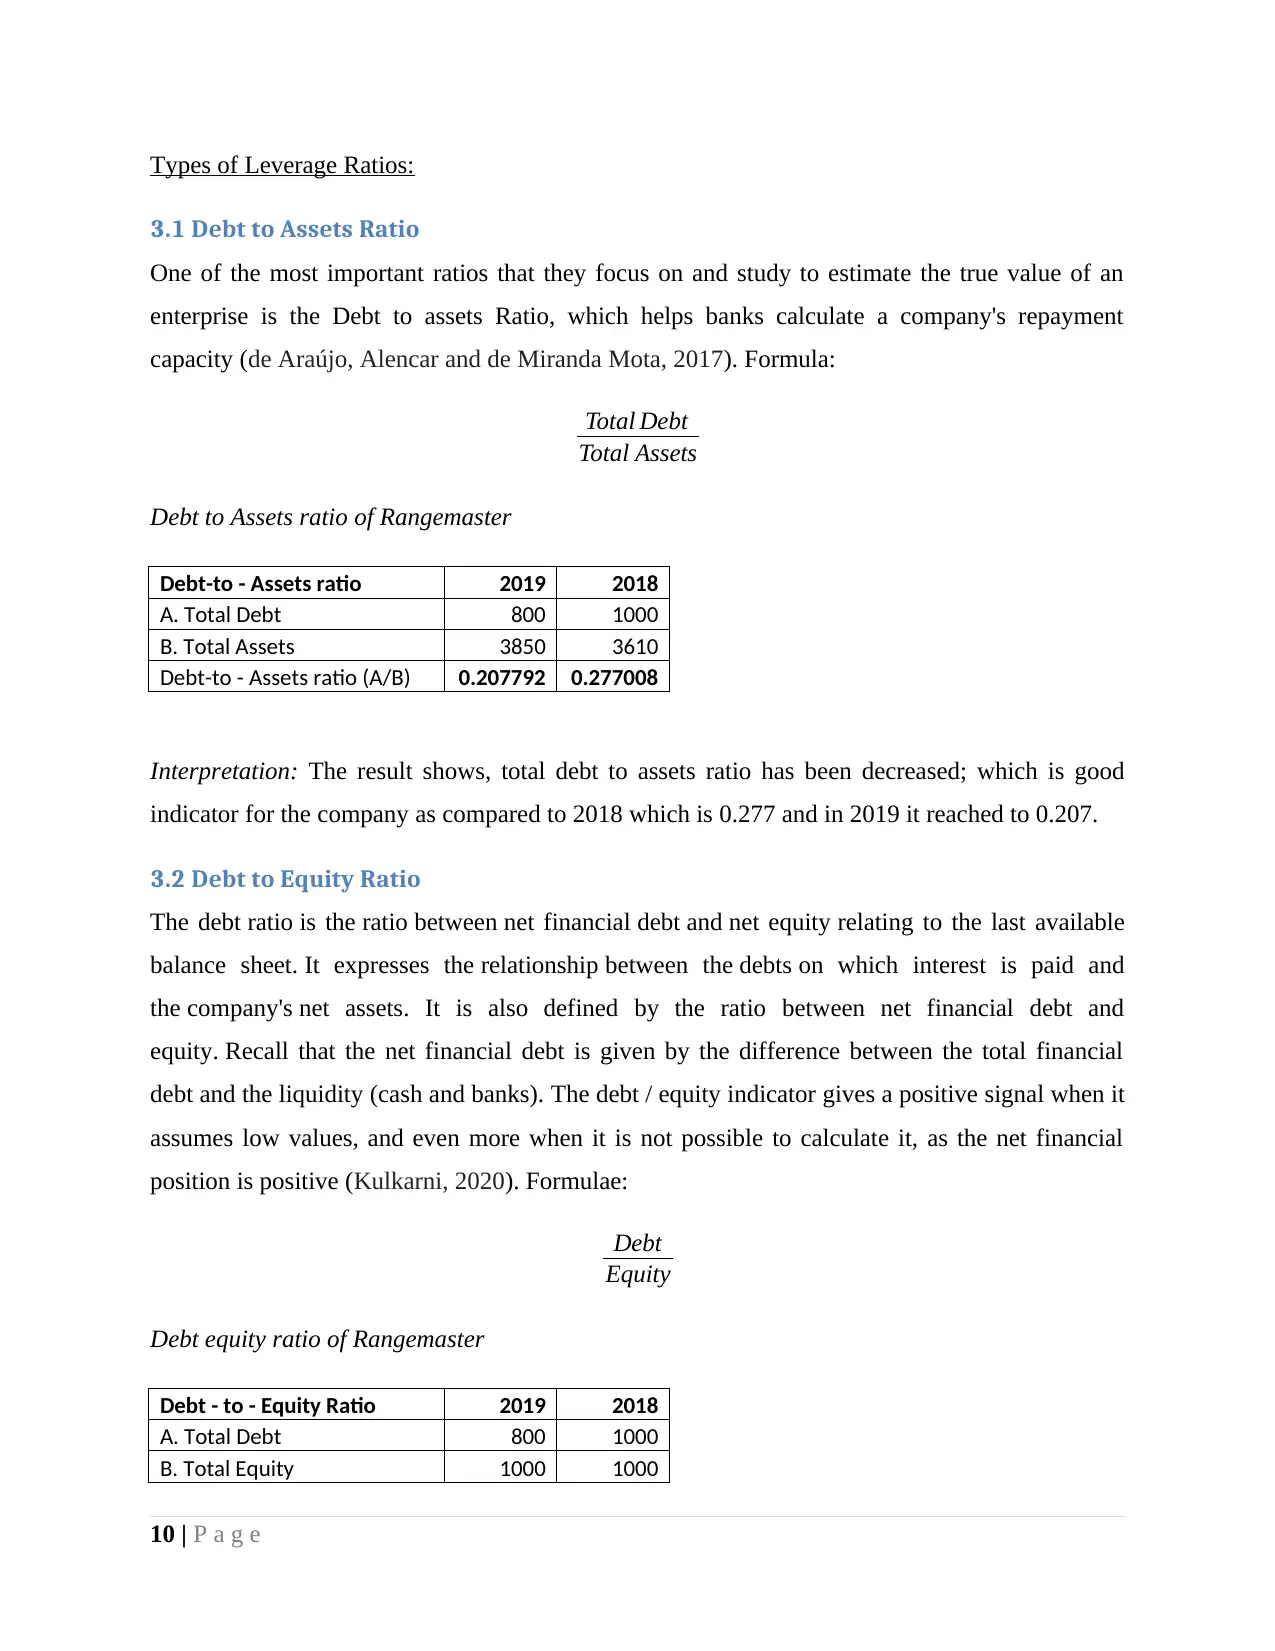
3.1 Debt to Assets Ratio
One of the most important ratios that they focus on and study to estimate the true value of an
enterprise is the Debt to assets Ratio, which helps banks calculate a company's repayment
capacity (de Araújo, Alencar and de Miranda Mota, 2017). Formula:
Total Debt
Total Assets
Debt to Assets ratio of Rangemaster
Debt-to - Assets ratio 2019 2018
A. Total Debt 800 1000
B. Total Assets 3850 3610
Debt-to - Assets ratio (A/B) 0.207792 0.277008
Interpretation: The result shows, total debt to assets ratio has been decreased; which is good
indicator for the company as compared to 2018 which is 0.277 and in 2019 it reached to 0.207.
3.2 Debt to Equity Ratio
The debt ratio is the ratio between net financial debt and net equity relating to the last available
balance sheet. It expresses the relationship between the debts on which interest is paid and
the company's net assets. It is also defined by the ratio between net financial debt and
equity. Recall that the net financial debt is given by the difference between the total financial
debt and the liquidity (cash and banks). The debt / equity indicator gives a positive signal when it
assumes low values, and even more when it is not possible to calculate it, as the net financial
position is positive (Kulkarni, 2020). Formulae:
Debt
Equity
Debt equity ratio of Rangemaster
Debt - to - Equity Ratio 2019 2018
A. Total Debt 800 1000
B. Total Equity 1000 1000
10 | P a g e
Paraphrase This Document
Need a fresh take? Get an instant paraphrase of this document with our AI Paraphraser
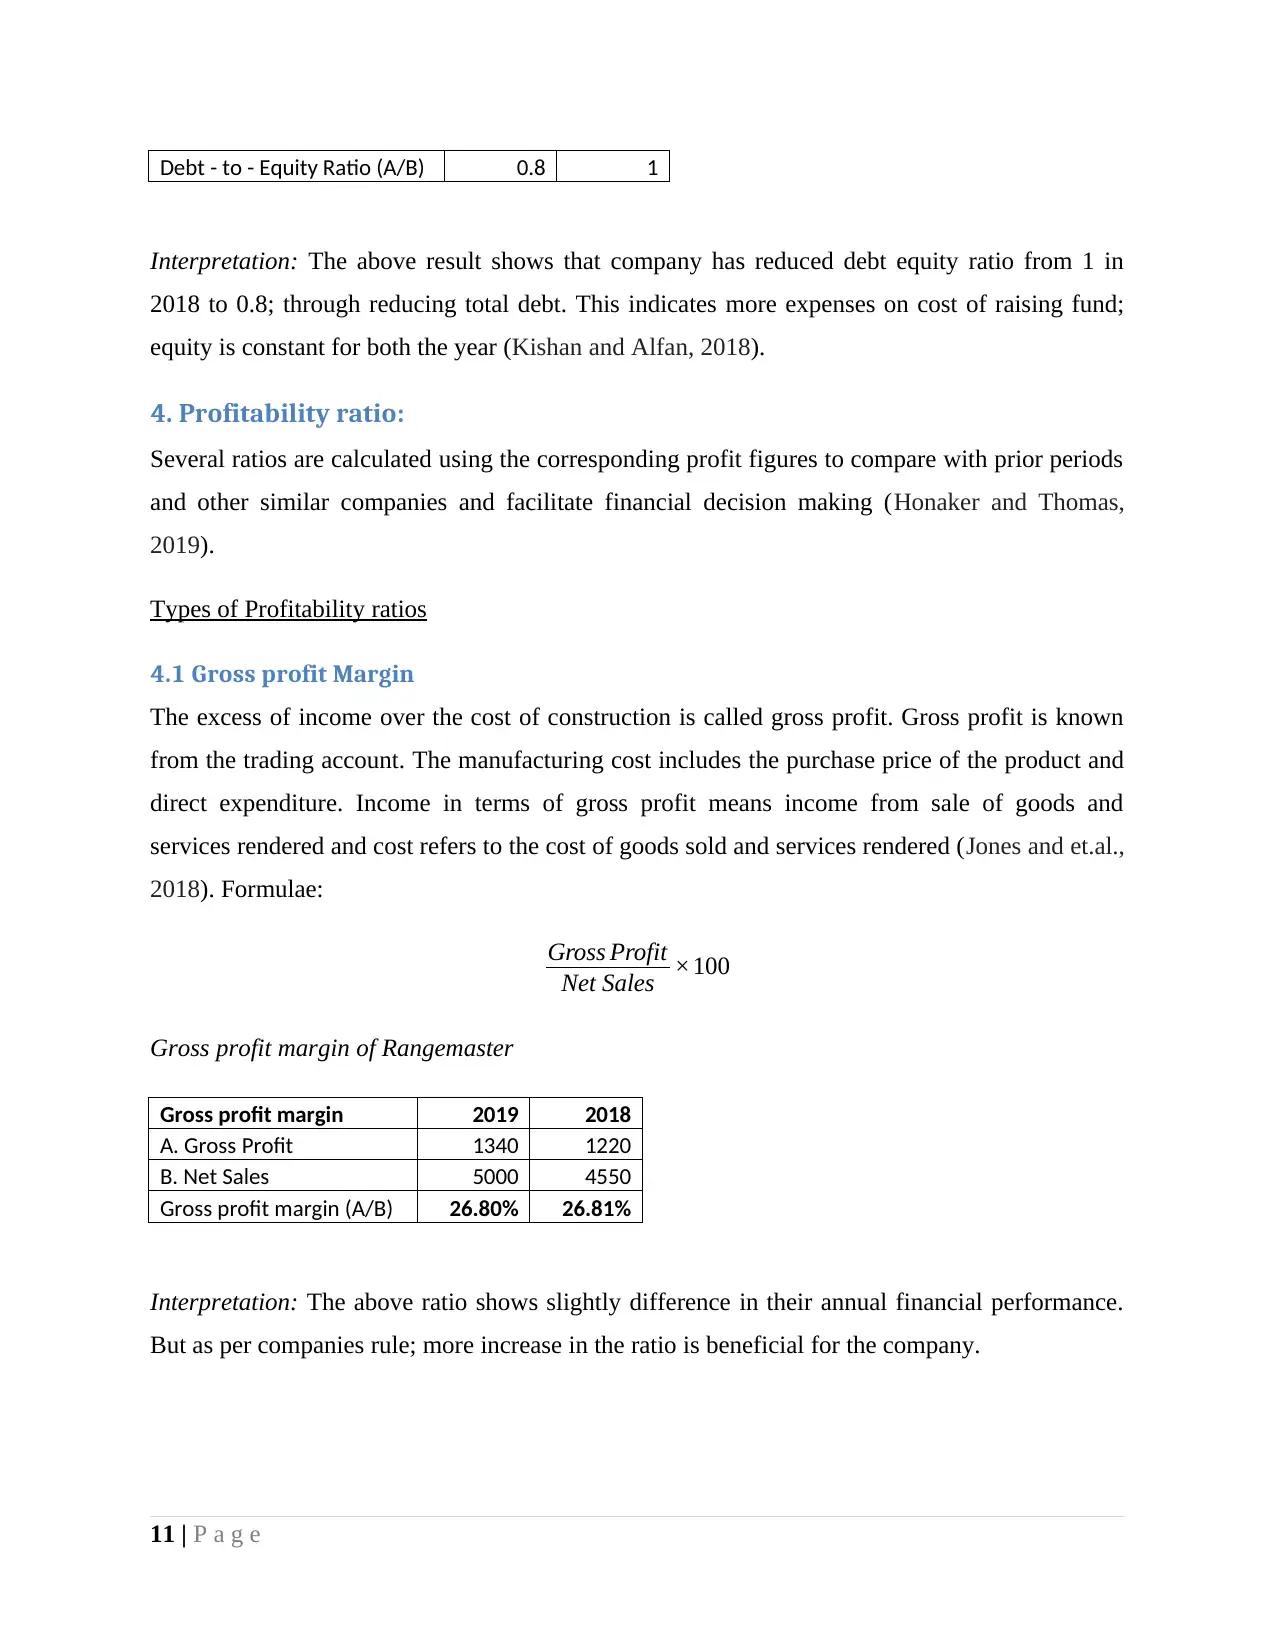
Debt - to - Equity Ratio (A/B) 0.8 1
Interpretation: The above result shows that company has reduced debt equity ratio from 1 in
2018 to 0.8; through reducing total debt. This indicates more expenses on cost of raising fund;
equity is constant for both the year (Kishan and Alfan, 2018).
4. Profitability ratio:
Several ratios are calculated using the corresponding profit figures to compare with prior periods
and other similar companies and facilitate financial decision making (Honaker and Thomas,
2019).
Types of Profitability ratios
4.1 Gross profit Margin
The excess of income over the cost of construction is called gross profit. Gross profit is known
from the trading account. The manufacturing cost includes the purchase price of the product and
direct expenditure. Income in terms of gross profit means income from sale of goods and
services rendered and cost refers to the cost of goods sold and services rendered (Jones and et.al.,
2018). Formulae:
Gross Profit
Net Sales ×100
Gross profit margin of Rangemaster
Gross profit margin 2019 2018
A. Gross Profit 1340 1220
B. Net Sales 5000 4550
Gross profit margin (A/B) 26.80% 26.81%
Interpretation: The above ratio shows slightly difference in their annual financial performance.
But as per companies rule; more increase in the ratio is beneficial for the company.
11 | P a g e
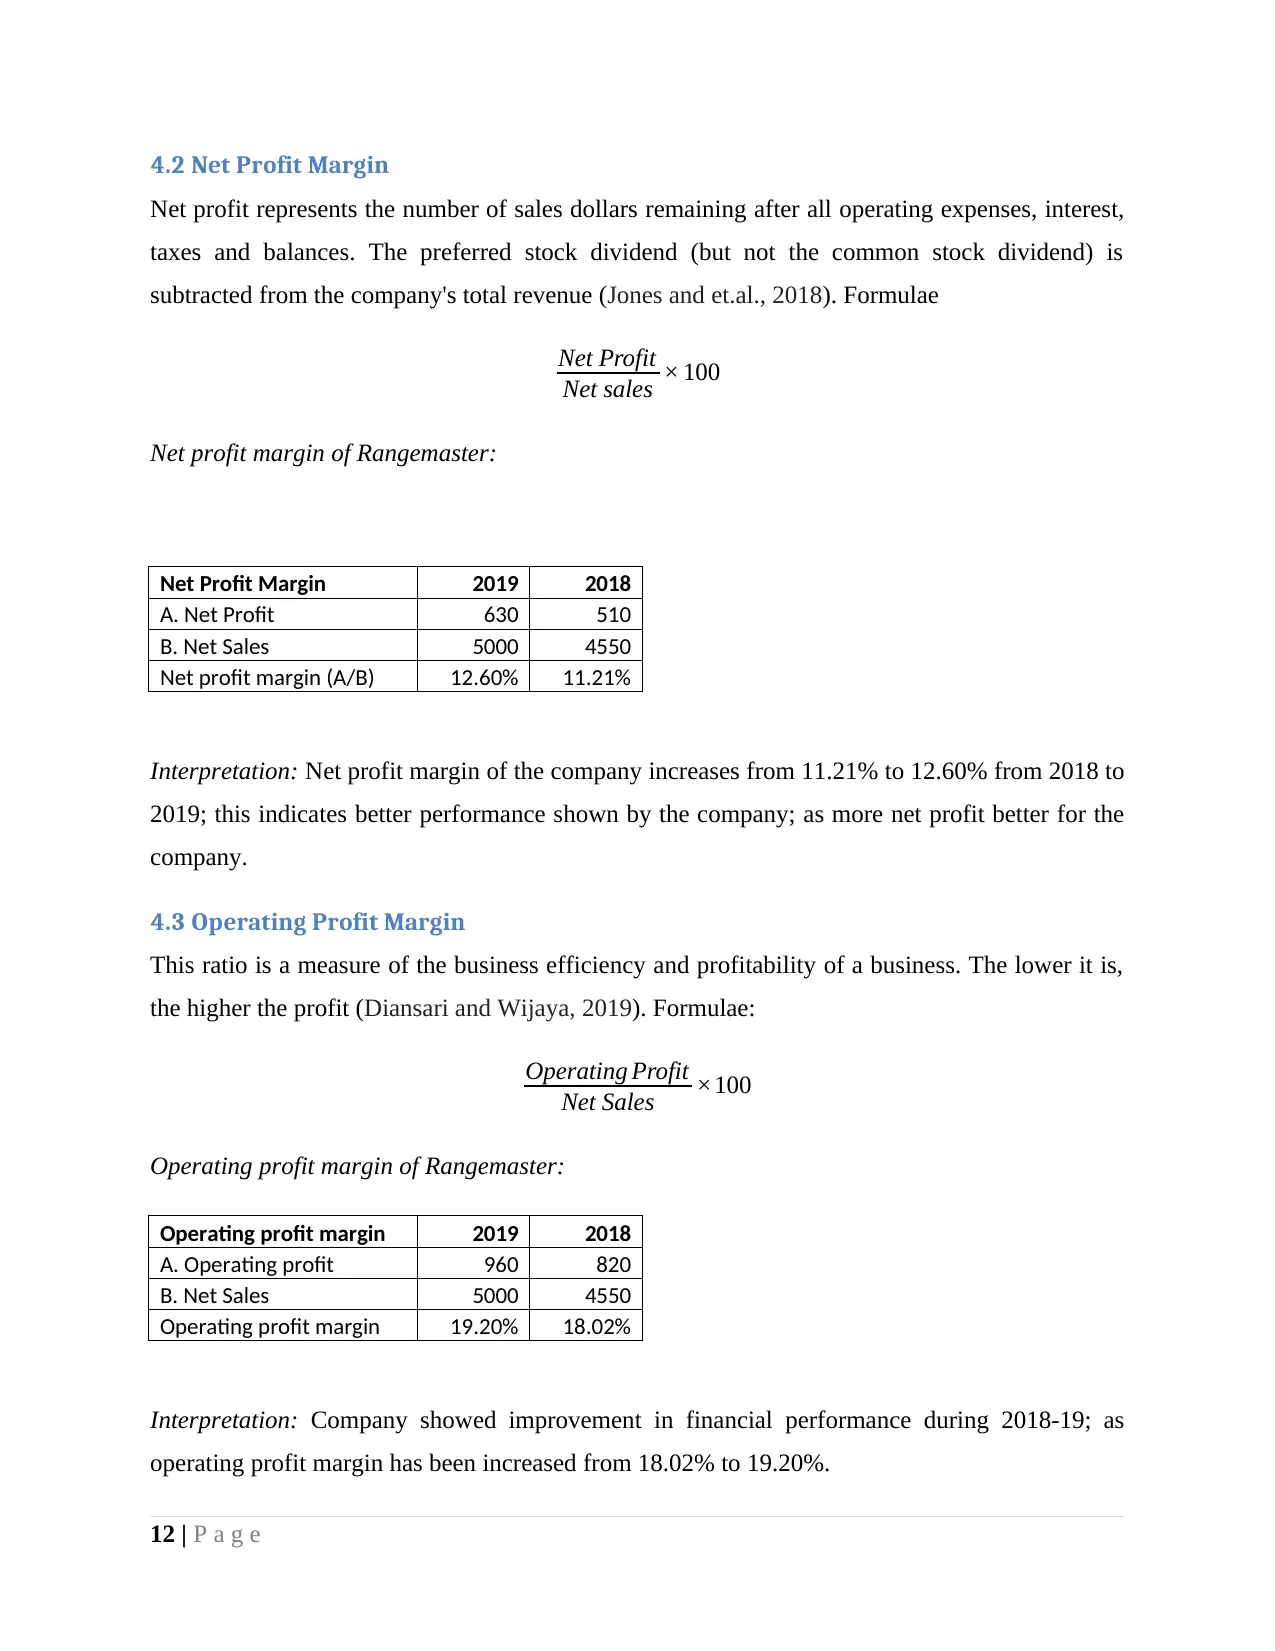
4.2 Net Profit Margin
Net profit represents the number of sales dollars remaining after all operating expenses, interest,
taxes and balances. The preferred stock dividend (but not the common stock dividend) is
subtracted from the company's total revenue (Jones and et.al., 2018). Formulae
Net Profit
Net sales × 100
Net profit margin of Rangemaster:
Net Profit Margin 2019 2018
A. Net Profit 630 510
B. Net Sales 5000 4550
Net profit margin (A/B) 12.60% 11.21%
Interpretation: Net profit margin of the company increases from 11.21% to 12.60% from 2018 to
2019; this indicates better performance shown by the company; as more net profit better for the
company.
4.3 Operating Profit Margin
This ratio is a measure of the business efficiency and profitability of a business. The lower it is,
the higher the profit (Diansari and Wijaya, 2019). Formulae:
Operating Profit
Net Sales ×100
Operating profit margin of Rangemaster:
Operating profit margin 2019 2018
A. Operating profit 960 820
B. Net Sales 5000 4550
Operating profit margin 19.20% 18.02%
Interpretation: Company showed improvement in financial performance during 2018-19; as
operating profit margin has been increased from 18.02% to 19.20%.
12 | P a g e
⊘ This is a preview!⊘
Do you want full access?
Subscribe today to unlock all pages.
Trusted by 1+ million students worldwide
1 out of 16
Related Documents


Your All-in-One AI-Powered Toolkit for Academic Success.
+13062052269
info@desklib.com
Available 24*7 on WhatsApp / Email
![[object Object]](/_next/static/media/star-bottom.7253800d.svg)
Unlock your academic potential
Copyright © 2020–2026 A2Z Services. All Rights Reserved. Developed and managed by ZUCOL.