MIS772 Predictive Analytics: Rapid Miner Analysis of Airline Reviews
VerifiedAdded on 2023/06/12
|8
|1013
|324
Report
AI Summary
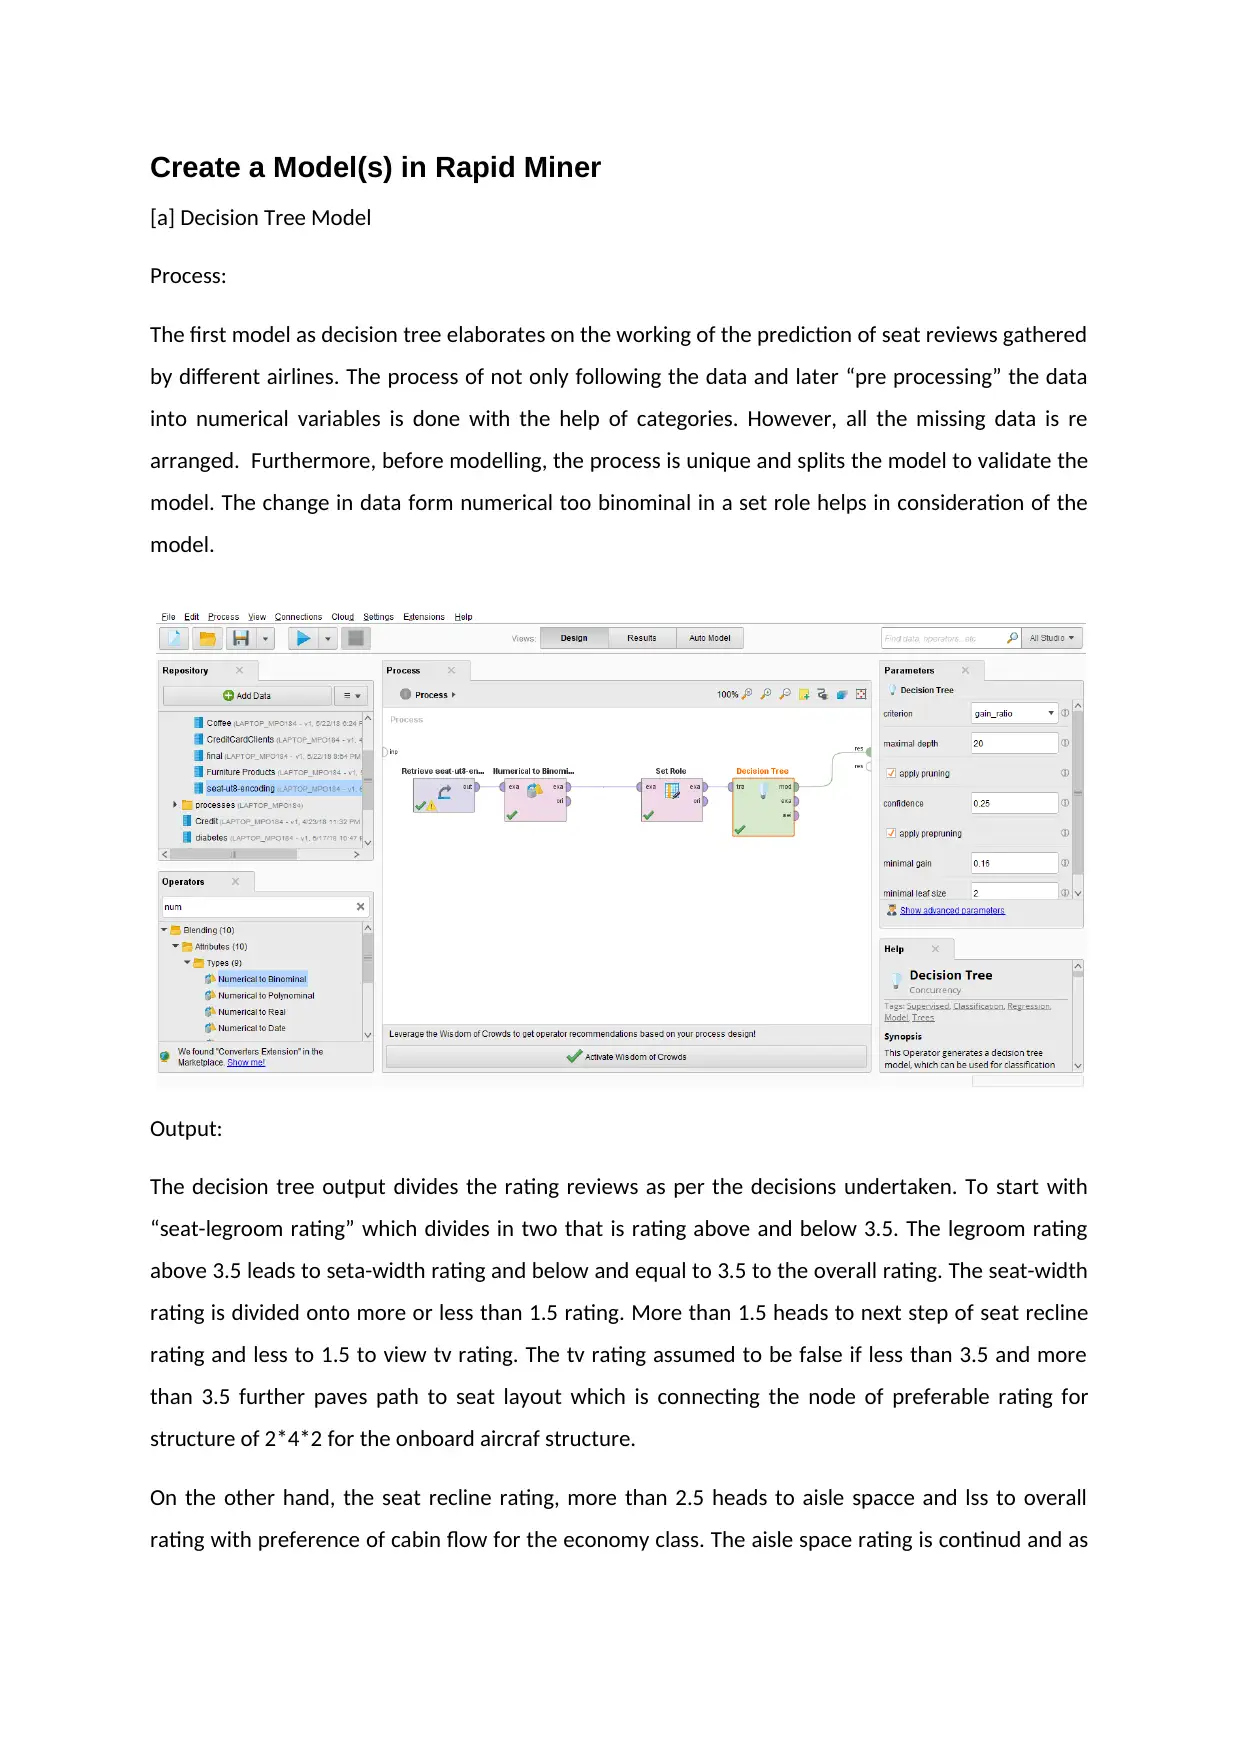
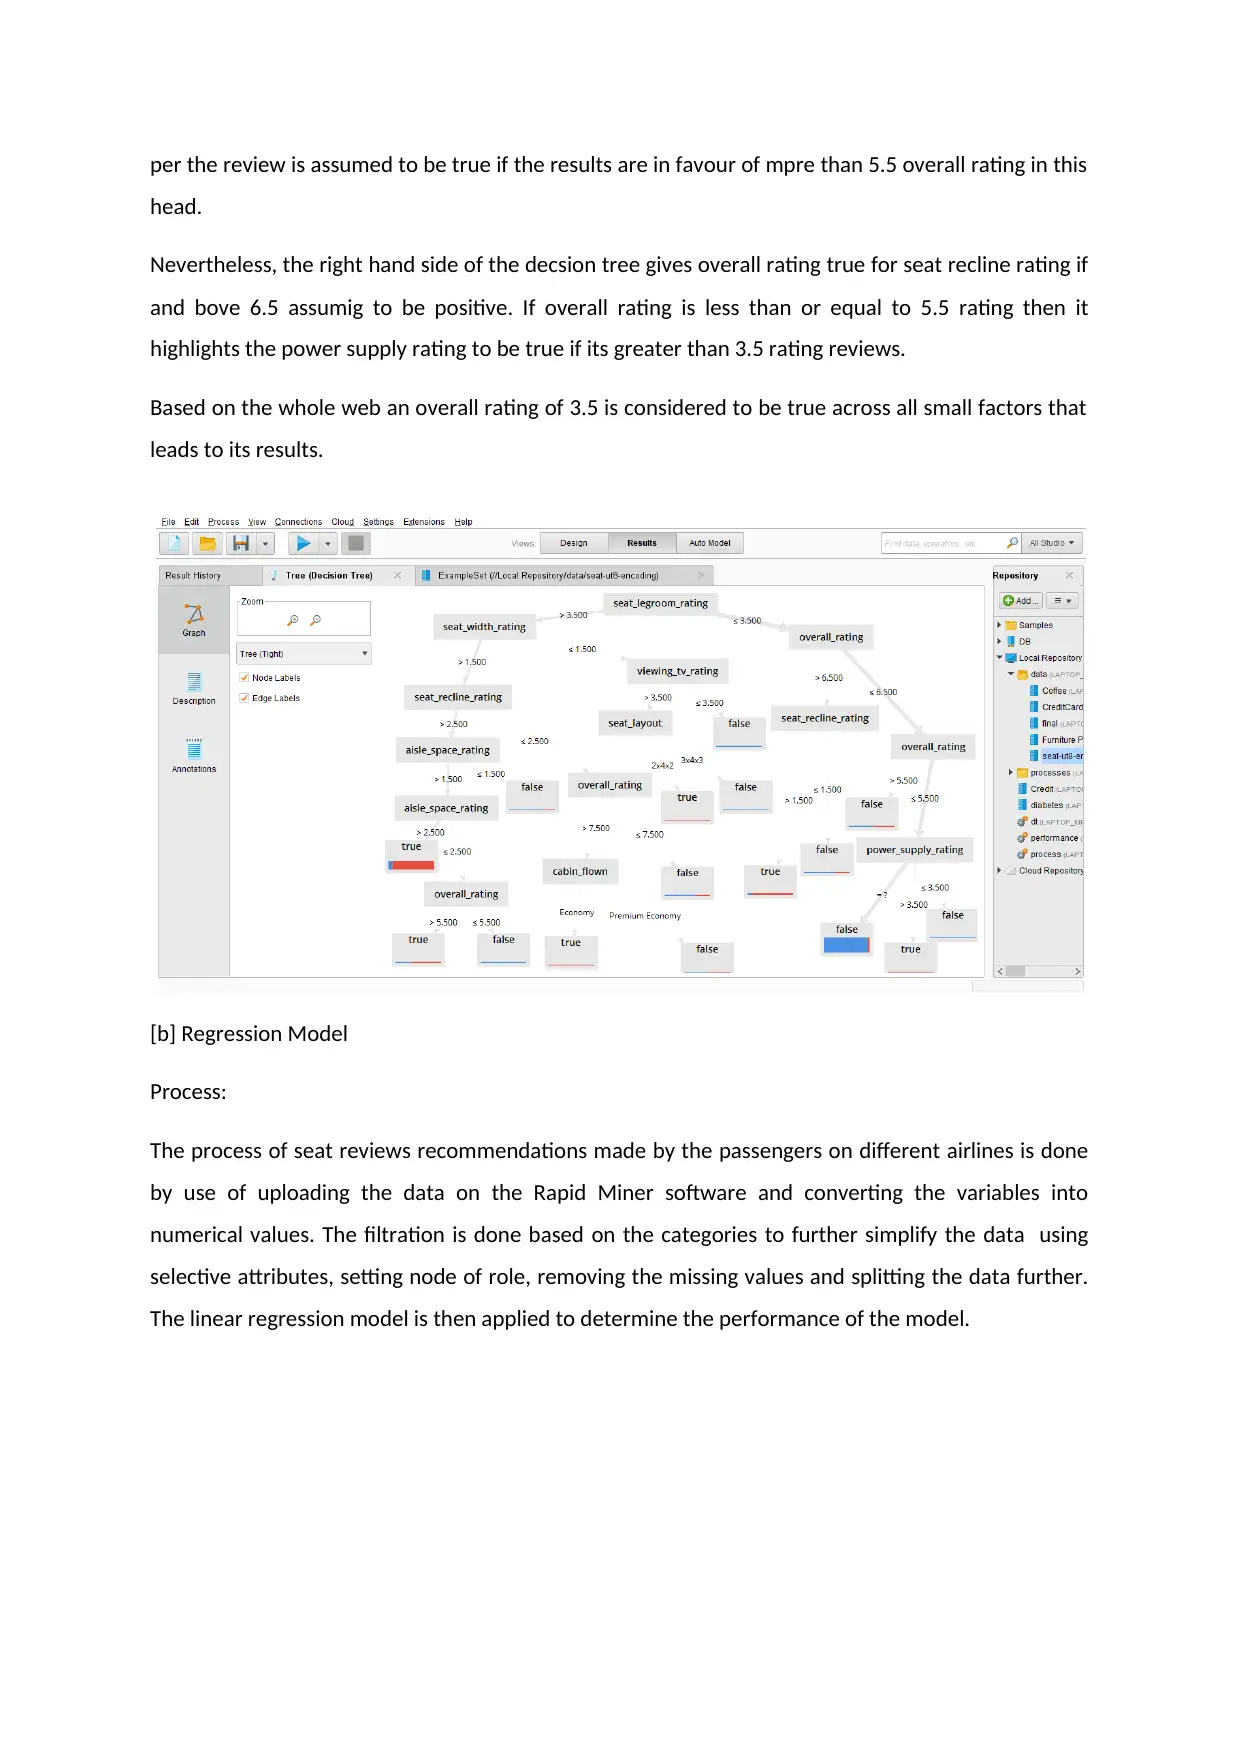
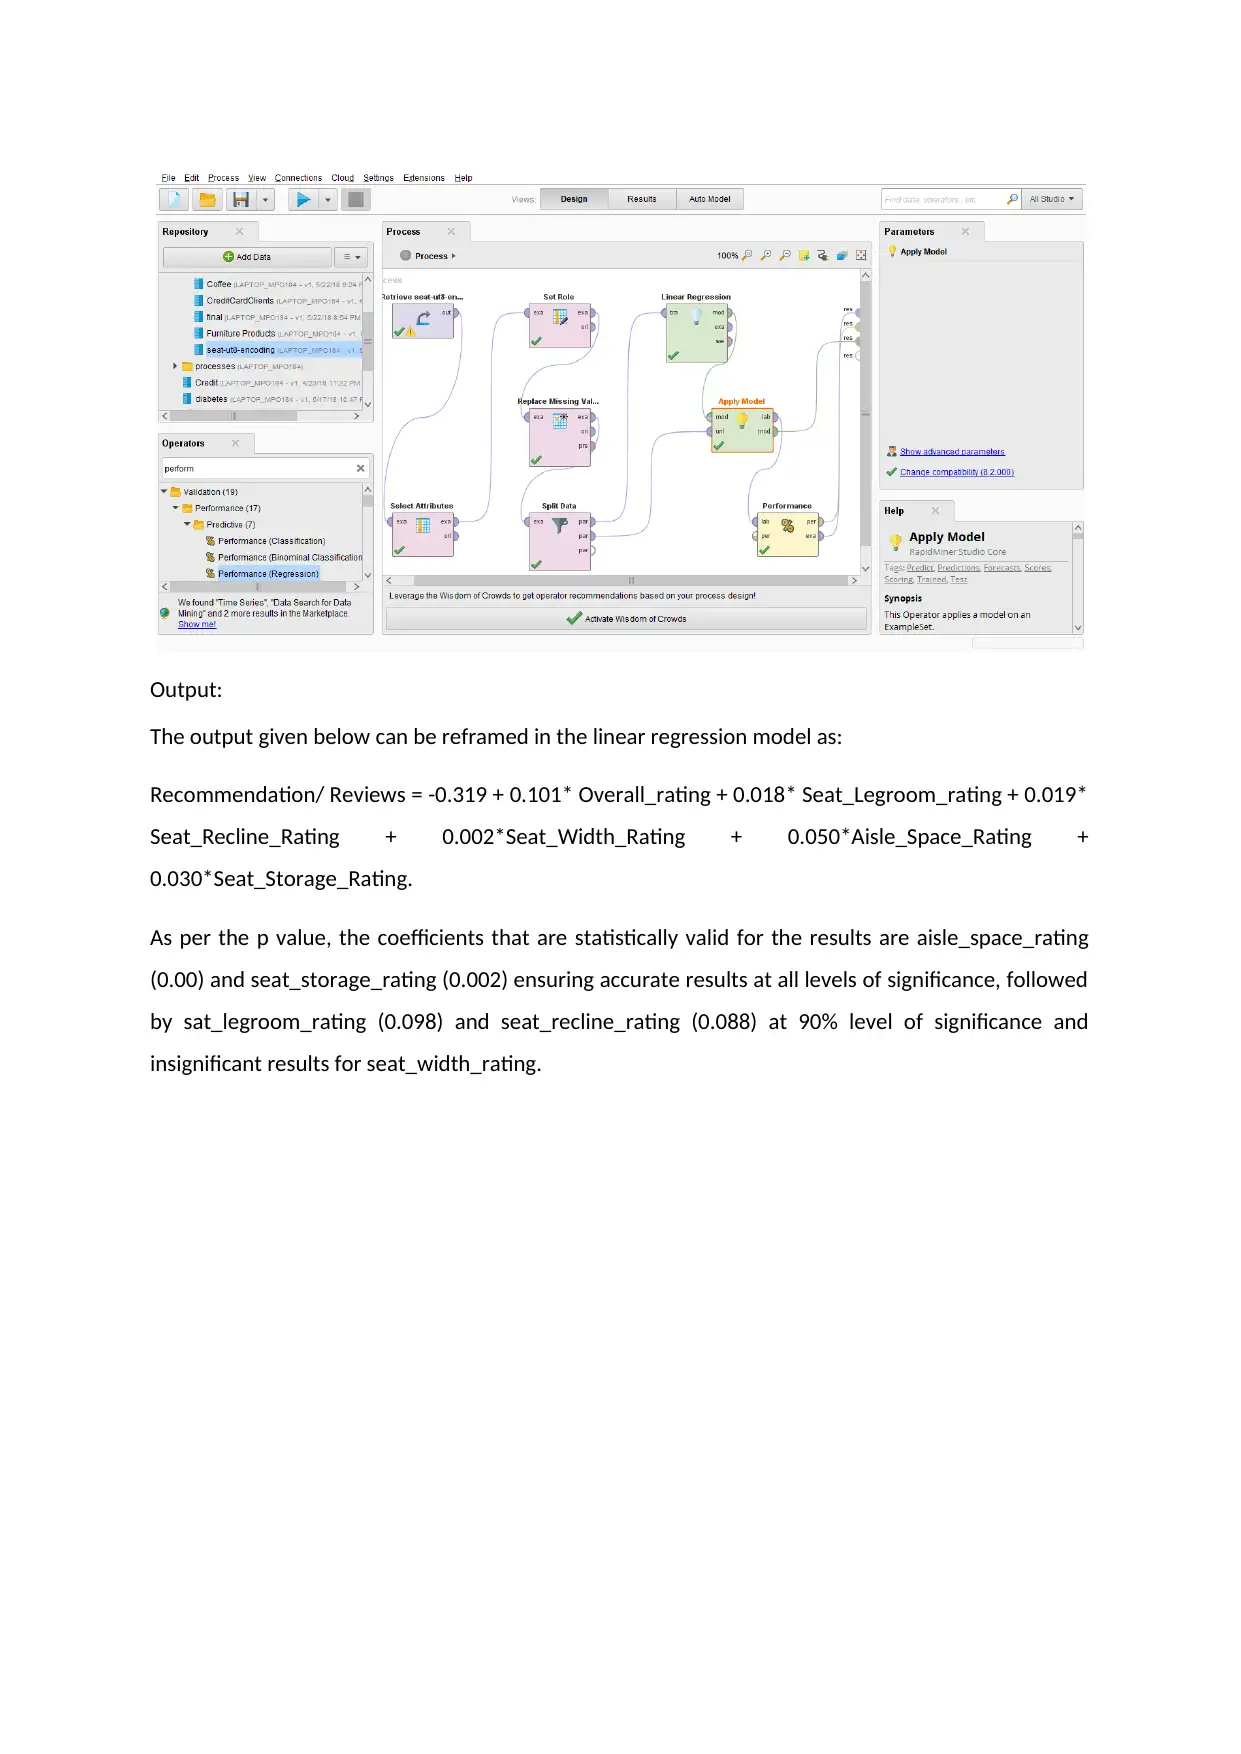
This report presents a predictive analytics study using RapidMiner to analyze airline seat reviews. The analysis involves creating three models: a decision tree, a regression model, and a k-means clustering model. The decision tree model divides rating reviews based on factors like seat-legroom rating, seat-width rating, and overall rating. The regression model identifies aisle space and seat storage ratings as statistically significant predictors of recommendations. The k-means clustering model groups reviews into two clusters based on overall rating and recommendation, highlighting the importance of these variables. The models aim to provide insights into passenger preferences and recommendations for airlines, demonstrating the application of predictive analytics techniques.

MIS772 Predictive Analytics
Name of the student
Name of the University
Name of the student
Name of the University
Paraphrase This Document
Need a fresh take? Get an instant paraphrase of this document with our AI Paraphraser

Create a Model(s) in Rapid Miner
[a] Decision Tree Model
Process:
The first model as decision tree elaborates on the working of the prediction of seat reviews gathered
by different airlines. The process of not only following the data and later “pre processing” the data
into numerical variables is done with the help of categories. However, all the missing data is re
arranged. Furthermore, before modelling, the process is unique and splits the model to validate the
model. The change in data form numerical too binominal in a set role helps in consideration of the
model.
Output:
The decision tree output divides the rating reviews as per the decisions undertaken. To start with
“seat-legroom rating” which divides in two that is rating above and below 3.5. The legroom rating
above 3.5 leads to seta-width rating and below and equal to 3.5 to the overall rating. The seat-width
rating is divided onto more or less than 1.5 rating. More than 1.5 heads to next step of seat recline
rating and less to 1.5 to view tv rating. The tv rating assumed to be false if less than 3.5 and more
than 3.5 further paves path to seat layout which is connecting the node of preferable rating for
structure of 2*4*2 for the onboard aircraf structure.
On the other hand, the seat recline rating, more than 2.5 heads to aisle spacce and lss to overall
rating with preference of cabin flow for the economy class. The aisle space rating is continud and as

per the review is assumed to be true if the results are in favour of mpre than 5.5 overall rating in this
head.
Nevertheless, the right hand side of the decsion tree gives overall rating true for seat recline rating if
and bove 6.5 assumig to be positive. If overall rating is less than or equal to 5.5 rating then it
highlights the power supply rating to be true if its greater than 3.5 rating reviews.
Based on the whole web an overall rating of 3.5 is considered to be true across all small factors that
leads to its results.
[b] Regression Model
Process:
The process of seat reviews recommendations made by the passengers on different airlines is done
by use of uploading the data on the Rapid Miner software and converting the variables into
numerical values. The filtration is done based on the categories to further simplify the data using
selective attributes, setting node of role, removing the missing values and splitting the data further.
The linear regression model is then applied to determine the performance of the model.
⊘ This is a preview!⊘
Do you want full access?
Subscribe today to unlock all pages.

Trusted by 1+ million students worldwide

Output:
The output given below can be reframed in the linear regression model as:
Recommendation/ Reviews = -0.319 + 0.101* Overall_rating + 0.018* Seat_Legroom_rating + 0.019*
Seat_Recline_Rating + 0.002*Seat_Width_Rating + 0.050*Aisle_Space_Rating +
0.030*Seat_Storage_Rating.
As per the p value, the coefficients that are statistically valid for the results are aisle_space_rating
(0.00) and seat_storage_rating (0.002) ensuring accurate results at all levels of significance, followed
by sat_legroom_rating (0.098) and seat_recline_rating (0.088) at 90% level of significance and
insignificant results for seat_width_rating.
Paraphrase This Document
Need a fresh take? Get an instant paraphrase of this document with our AI Paraphraser

Overall as per the performance vector results, the correlation is 0.854 ensuring strong and positive
correlation between the variables with R square as 72.9%, making the model a good fit. This states
that 72.9% variations in the independent variables can be explained.
[c] k-Means clustering
Process:
The process of k-means on seat reviews recommendations on different airlines is done by retrieving
the data from the dataset, replacing the missing vales, selecting those attributes that can be applied
in the model with normalizing the data on clusters. The clustered model yields the visualisation
results and later, its role is set to recognize the design for the model.

Output:
The output below is measured on “Squared Euclidean Distance” and analyses the two major clusters
and each cluster is marked with a star. The overall rating and recommendation is grouped in two
clusters based on the rating with smaller and larger cluster.
The smaller cluster is recommended on an average of 93.98% and the larger with more focus of
150.91% as an overview. The legroom rating is drastically higher is Cluster 1 with efficiency of
78.49% and overall rating being 99.92%. The Cluster 1 is considered but in later graph it optimises to
a point to converge on a common result.
⊘ This is a preview!⊘
Do you want full access?
Subscribe today to unlock all pages.

Trusted by 1+ million students worldwide

As depicted on heat-map, the recommended variable of clustering leads more weight age in the
results. The same has been depicted in the graph below with more emphasis on a darker shade of
colour. Moreover, the overall_rating and seat_legroom_rating follows the suite of recommended
rating.
The line chart further emphasizes on the equal cluster made on the distancing of the variables. The
centroid chart draws the knowledge of average of the points in the data assigned. This is made to
illustrate the points change in the different variables so that the distance is minimized and reached
to an optimum point.
Paraphrase This Document
Need a fresh take? Get an instant paraphrase of this document with our AI Paraphraser

The scatter plot of k-means clustering analyses the two clusters separated on difference. In this case,
the differences are based on smaller and larger cluster based on reviews and ratings of passengers
on seats of different airlines. As per the scatter plot, the overall rating and recommended variables
merge to a threshold. The thresholds of overall rating in comparison to recommendations made are
less with respect to different airlines and views on the up gradation required.
1 out of 8

Your All-in-One AI-Powered Toolkit for Academic Success.
+13062052269
info@desklib.com
Available 24*7 on WhatsApp / Email
Unlock your academic potential
Copyright © 2020–2025 A2Z Services. All Rights Reserved. Developed and managed by ZUCOL.