Deakin MIS772 Assignment A2: Wine Rating Prediction Analysis
VerifiedAdded on 2022/11/26
|9
|2155
|272
Homework Assignment
AI Summary
This assignment, for the MIS772 Predictive Analytics course, focuses on predicting wine ratings for Australian Wine Importers (AWI) using RapidMiner. The student prepares a dataset, selects relevant attributes, discretizes the rating variable, and filters missing values. A sample of the data is used to build and evaluate k-NN, Decision Tree (DT), and Gradient Boosted Trees (GBT) models. The models' performances are compared using accuracy, classification, kappa, and R2 parameters. k-NN is identified as the best performing model. The assignment then optimizes the k value for the k-NN model. The final section presents an integrated solution for predicting wine ratings and further extends the research by implementing the k-NN model in R. The assignment includes an executive summary, detailed model creation, evaluation, and improvement steps, and a bibliography.
MIS772 Predictive Analytics (2019 T1)Individual Assignment A2-LP4 / All Workshops
Assignment A2: Text Mining + DT + Neural Nets + Optimisation
Student Name
(as per record)
Student No Student number
My other group members A2
Group No
As per CloudDeakin group
number
Student Name
(as per record)
Student Nos Student number
Student number
Student number
Exceptional Meets expectations Issues noted Improve Unacceptable
Exec
Report
Create
Models
Evaluate &
Improve
Provide
Solution
Research &
Extend
Brief
Comments Read these notes as we are really trying to help you out!
Remember: If it is not in this report, it does not exist and does not get marked!
You can use the above form to estimate the expected mark against the rubric (see the assignment
“info” document). Be realistic and note that we will find many problems you may not be aware of.
Assume that markers may be tired when assessing your work and they may miss some important
aspects of your submission when not presented clearly, or when you deviate from the structure of
this template, or if you do not include them in your report. So be clear, number all tables, charts and
screen shots used as evidence, describe all visuals, cross-reference your analysis with evidence.
Submit this report in PDF format to avoid accidental reformatting of the content.
Submit all RapidMiner processes (.RMP files) in a separate ZIP archive, so that if there is any doubt
we could load your work and replicate your results (we will not do this to find missing report parts).
Ensure that the report is readable and the font is no smaller than Arial 10 points. In the report include
only the most significant results for your analysis and recommendations.
You will be able to submit your work once only so make sure you get it right – check these before
posting on CloudDeakin: Is this your document? Is this the correct unit, assignment, year and
trimester? Is your name entered above? Is the group number included and is it correct? Are names of
your group members entered as well? Are all pages included? Does it all fit into the required page
limit? Have you zipped all RapidMiner files (.RMP files)? Is the report contents yours alone?
Then after the submission – check these: Has the PDF report been submitted? Has the Zip archive of
RMP files been submitted? Can you retrieve and reopen both back from your submission folder?
Note that the late penalty will be calculated on the date and time of the last submitted file.
Finally, as all reports will be inspected for plagiarism, ensure that your analysis, your evidence, your
way of thinking, your report and its presentation are unique and demonstrate your ability to create it
all independently. So if you work in a team compare your submission to those of your team members
and make it quite distinct in both contents and form. Any part of this report that bears any
resemblance to another students’ report or any information source written by others or by you for
another unit (e.g. on the web) will be treated as plagiarism.
Total
Include: Report and RMP files, with clear comments supplied to (easily) reproduce reported results.
1 of 9
Paraphrase This Document
Need a fresh take? Get an instant paraphrase of this document with our AI Paraphraser
MIS772 Predictive Analytics (2019 T1)Individual Assignment A2-LP4 / All Workshops
Executive summary
Sustenance and wine are common accomplices and, when they're perfect, they can each lift the other to a
larger amount of flavor. The issue is finding an ideal blending. Wine rating given by the tester won't just
assistance the consumer locate the best wines at a sensible cost yet can likewise pick the best nourishment
and-wine blend.
Wines of a varietal share essential attributes. Merlots, for instance, regularly have changing degrees of
ready organic product fragrances - cassis, raspberry, dark cherry, and plum- - alongside herbaceous or fiery
"notes." But even inside a varietal, wines can contrast a lot in view of their style: qualities got from the
wine-production process. For instance, a few merlots have a woody or smoky/singe enhance coming about
because of the toasted oak barrels in which they're matured. Pinot grigio regularly has a dry and tart Old
World style. Pinot gris, produced using a similar grape as pinot grigio, ordinarily has a more full bodied,
and here and there "off dry" (better), New World style. So don't discount a varietal as a result of a couple of
jugs you didn't care for. You probably won't have encountered its scope of styles or quality. By taking into
consideration, Australian Wine Importers (AWI) has decided to evaluate the 130k wine test results given
by Wine Enthusiast magazine with aim of predicting newly introduced wine into the Australian market
place. The analyst with that in mind evaluated the data set with the help of k-NN, DT and GBT method and
found that k-NN is the best option for prediction purpose.
2 of 9
MIS772 Predictive Analytics (2019 T1)Individual Assignment A2-LP4 / All Workshops
Create a Model(s) in Rapid Miner
The model starts with preparation of the given dataset with the help of a list of rapid miner
operators as mentioned below:
[a] Select attribute: this operator has helped the analyst to select specific group of parameters
that are essential for this study;
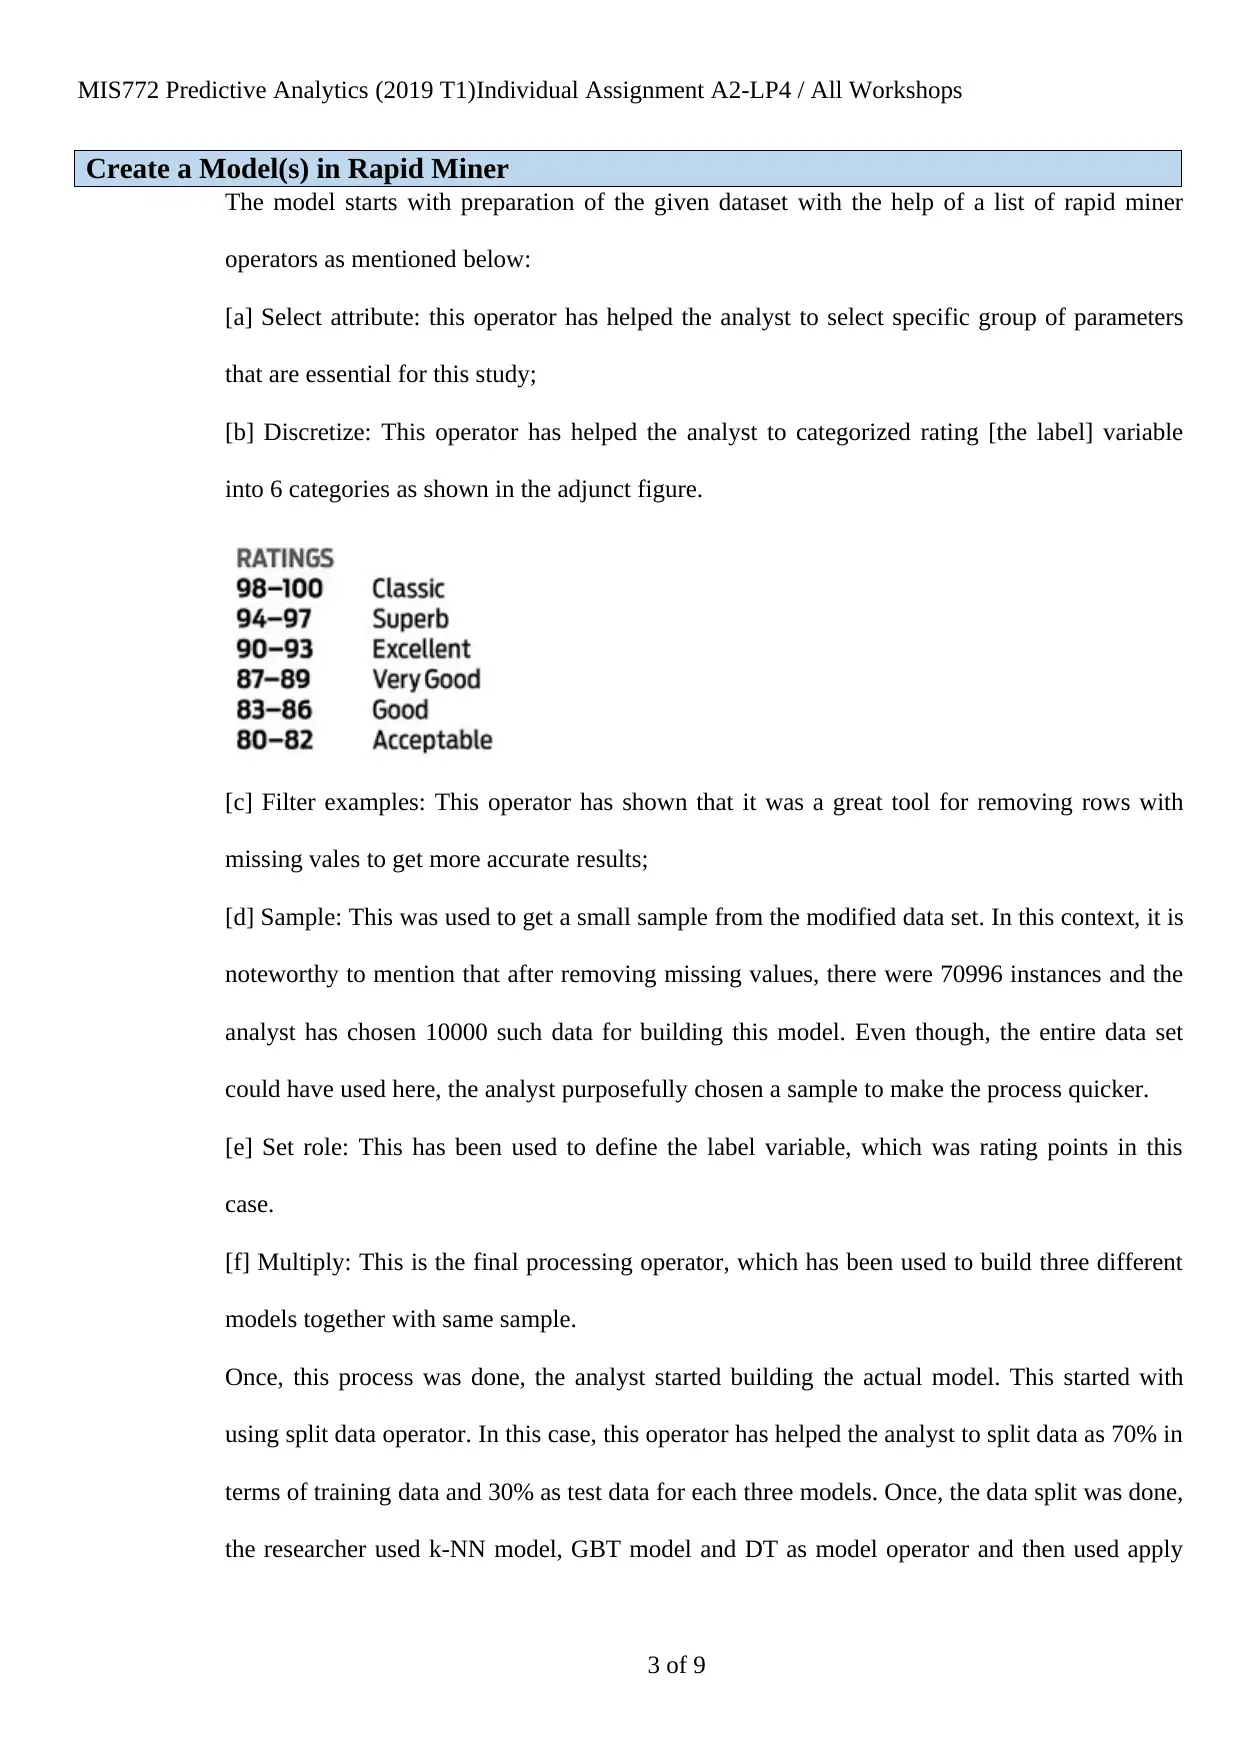
[b] Discretize: This operator has helped the analyst to categorized rating [the label] variable
into 6 categories as shown in the adjunct figure.
[c] Filter examples: This operator has shown that it was a great tool for removing rows with
missing vales to get more accurate results;
[d] Sample: This was used to get a small sample from the modified data set. In this context, it is
noteworthy to mention that after removing missing values, there were 70996 instances and the
analyst has chosen 10000 such data for building this model. Even though, the entire data set
could have used here, the analyst purposefully chosen a sample to make the process quicker.
[e] Set role: This has been used to define the label variable, which was rating points in this
case.
[f] Multiply: This is the final processing operator, which has been used to build three different
models together with same sample.
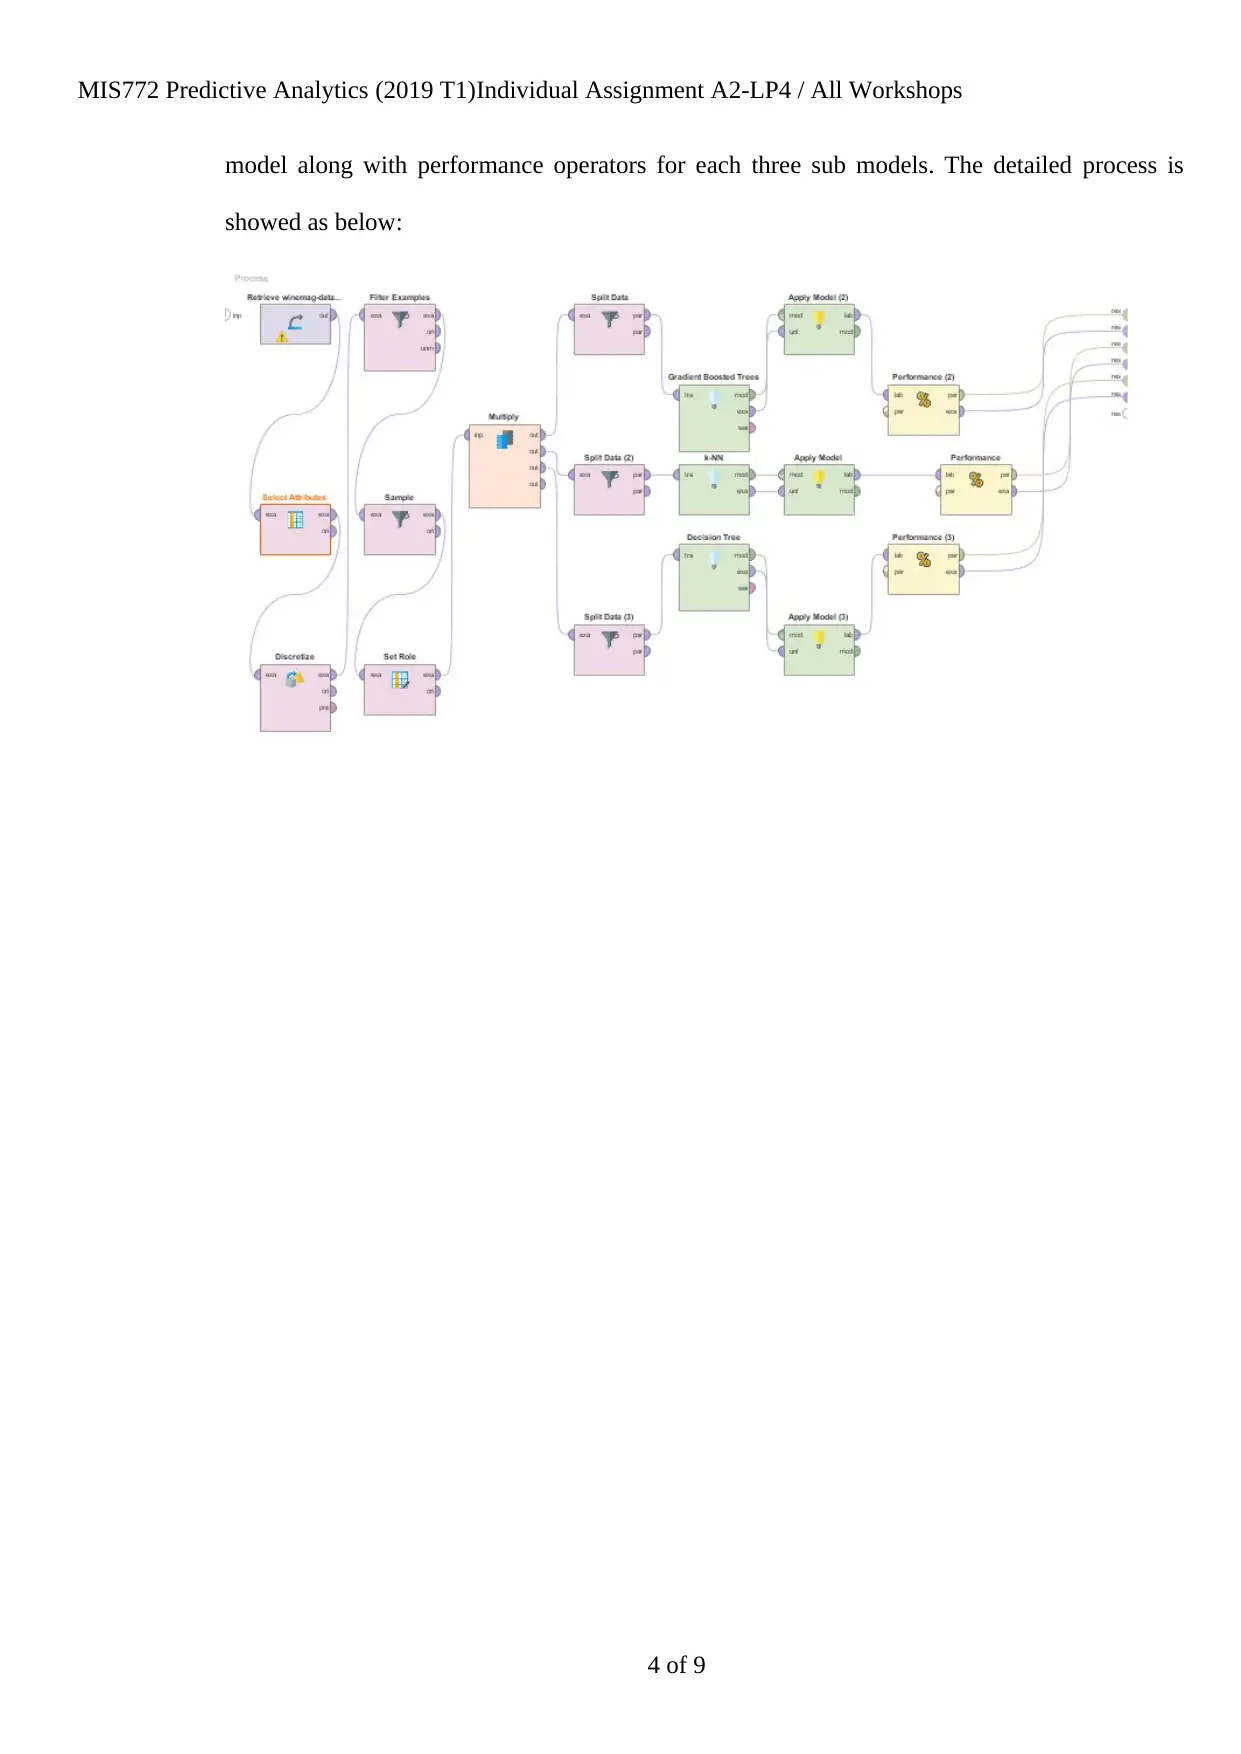
Once, this process was done, the analyst started building the actual model. This started with
using split data operator. In this case, this operator has helped the analyst to split data as 70% in
terms of training data and 30% as test data for each three models. Once, the data split was done,
the researcher used k-NN model, GBT model and DT as model operator and then used apply
3 of 9
Create a Model(s) in Rapid Miner
The model starts with preparation of the given dataset with the help of a list of rapid miner
operators as mentioned below:
[a] Select attribute: this operator has helped the analyst to select specific group of parameters
that are essential for this study;
[b] Discretize: This operator has helped the analyst to categorized rating [the label] variable
into 6 categories as shown in the adjunct figure.
[c] Filter examples: This operator has shown that it was a great tool for removing rows with
missing vales to get more accurate results;
[d] Sample: This was used to get a small sample from the modified data set. In this context, it is
noteworthy to mention that after removing missing values, there were 70996 instances and the
analyst has chosen 10000 such data for building this model. Even though, the entire data set
could have used here, the analyst purposefully chosen a sample to make the process quicker.
[e] Set role: This has been used to define the label variable, which was rating points in this
case.
[f] Multiply: This is the final processing operator, which has been used to build three different
models together with same sample.
Once, this process was done, the analyst started building the actual model. This started with
using split data operator. In this case, this operator has helped the analyst to split data as 70% in
terms of training data and 30% as test data for each three models. Once, the data split was done,
the researcher used k-NN model, GBT model and DT as model operator and then used apply
3 of 9
⊘ This is a preview!⊘
Do you want full access?
Subscribe today to unlock all pages.
Trusted by 1+ million students worldwide
MIS772 Predictive Analytics (2019 T1)Individual Assignment A2-LP4 / All Workshops
model along with performance operators for each three sub models. The detailed process is
showed as below:
4 of 9
model along with performance operators for each three sub models. The detailed process is
showed as below:
4 of 9
Paraphrase This Document
Need a fresh take? Get an instant paraphrase of this document with our AI Paraphraser
MIS772 Predictive Analytics (2019 T1)Individual Assignment A2-LP4 / All Workshops
Evaluate and Improve the Model(s) in RapidMiner
in order to compare the performance of eacj of the three models, the analyst has chosen accuracy,
classification, kappa and R2 parameters. Now, if the accuracy measure is taken into account, then it can be
seen that the accuracy was 56.05% for
DT, 64.65% for k-NN and 57.53% for
GBT. Hence, in terms of accuracy of
the model, k-NN is showing better prediction than the rest two. The same decision can be confirmed if we
take into account the values of other parameters.
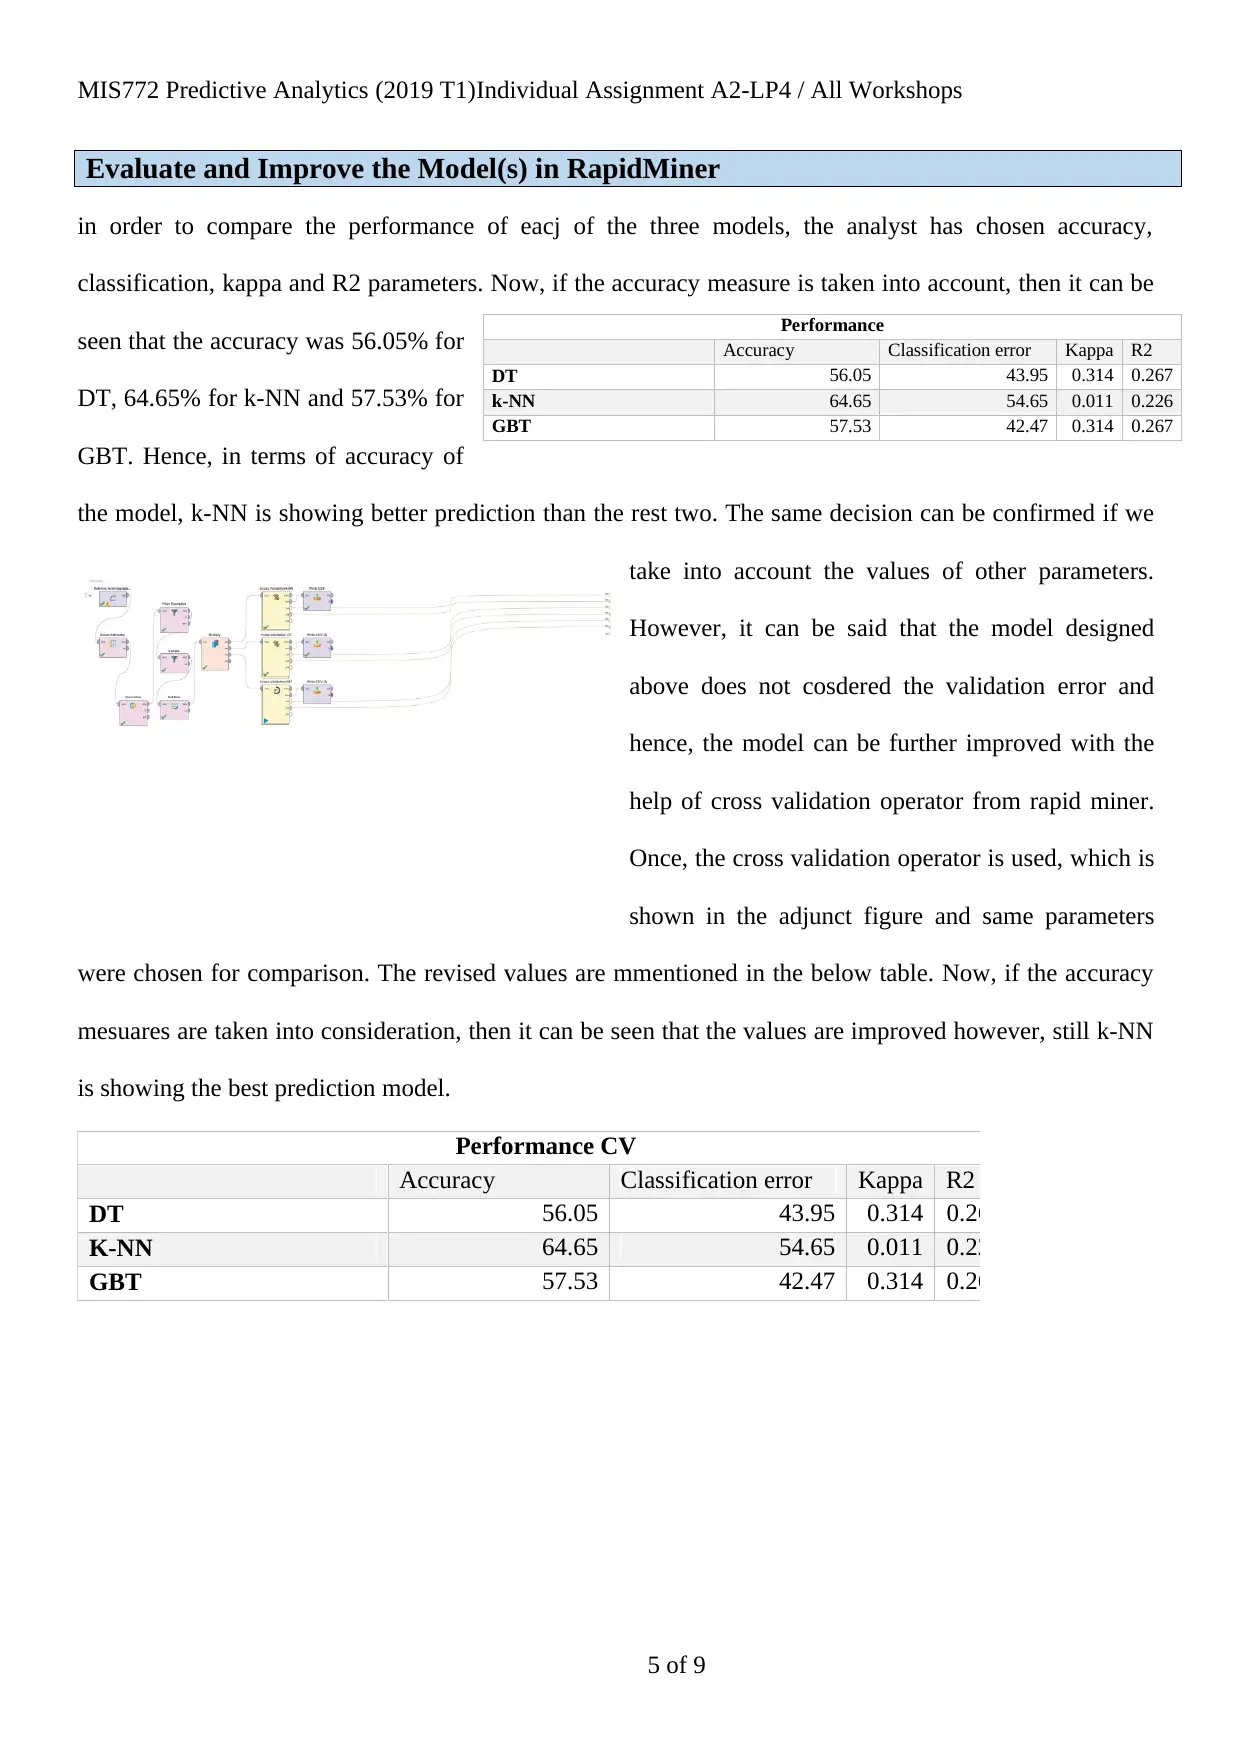
However, it can be said that the model designed
above does not cosdered the validation error and
hence, the model can be further improved with the
help of cross validation operator from rapid miner.
Once, the cross validation operator is used, which is
shown in the adjunct figure and same parameters
were chosen for comparison. The revised values are mmentioned in the below table. Now, if the accuracy
mesuares are taken into consideration, then it can be seen that the values are improved however, still k-NN
is showing the best prediction model.
Performance CV
Accuracy Classification error Kappa R2
DT 56.05 43.95 0.314 0.267
K-NN 64.65 54.65 0.011 0.226
GBT 57.53 42.47 0.314 0.267
5 of 9
Performance
Accuracy Classification error Kappa R2
DT 56.05 43.95 0.314 0.267
k-NN 64.65 54.65 0.011 0.226
GBT 57.53 42.47 0.314 0.267
Evaluate and Improve the Model(s) in RapidMiner
in order to compare the performance of eacj of the three models, the analyst has chosen accuracy,
classification, kappa and R2 parameters. Now, if the accuracy measure is taken into account, then it can be
seen that the accuracy was 56.05% for
DT, 64.65% for k-NN and 57.53% for
GBT. Hence, in terms of accuracy of
the model, k-NN is showing better prediction than the rest two. The same decision can be confirmed if we
take into account the values of other parameters.
However, it can be said that the model designed
above does not cosdered the validation error and
hence, the model can be further improved with the
help of cross validation operator from rapid miner.
Once, the cross validation operator is used, which is
shown in the adjunct figure and same parameters
were chosen for comparison. The revised values are mmentioned in the below table. Now, if the accuracy
mesuares are taken into consideration, then it can be seen that the values are improved however, still k-NN
is showing the best prediction model.
Performance CV
Accuracy Classification error Kappa R2
DT 56.05 43.95 0.314 0.267
K-NN 64.65 54.65 0.011 0.226
GBT 57.53 42.47 0.314 0.267
5 of 9
Performance
Accuracy Classification error Kappa R2
DT 56.05 43.95 0.314 0.267
k-NN 64.65 54.65 0.011 0.226
GBT 57.53 42.47 0.314 0.267
MIS772 Predictive Analytics (2019 T1)Individual Assignment A2-LP4 / All Workshops
Deployment
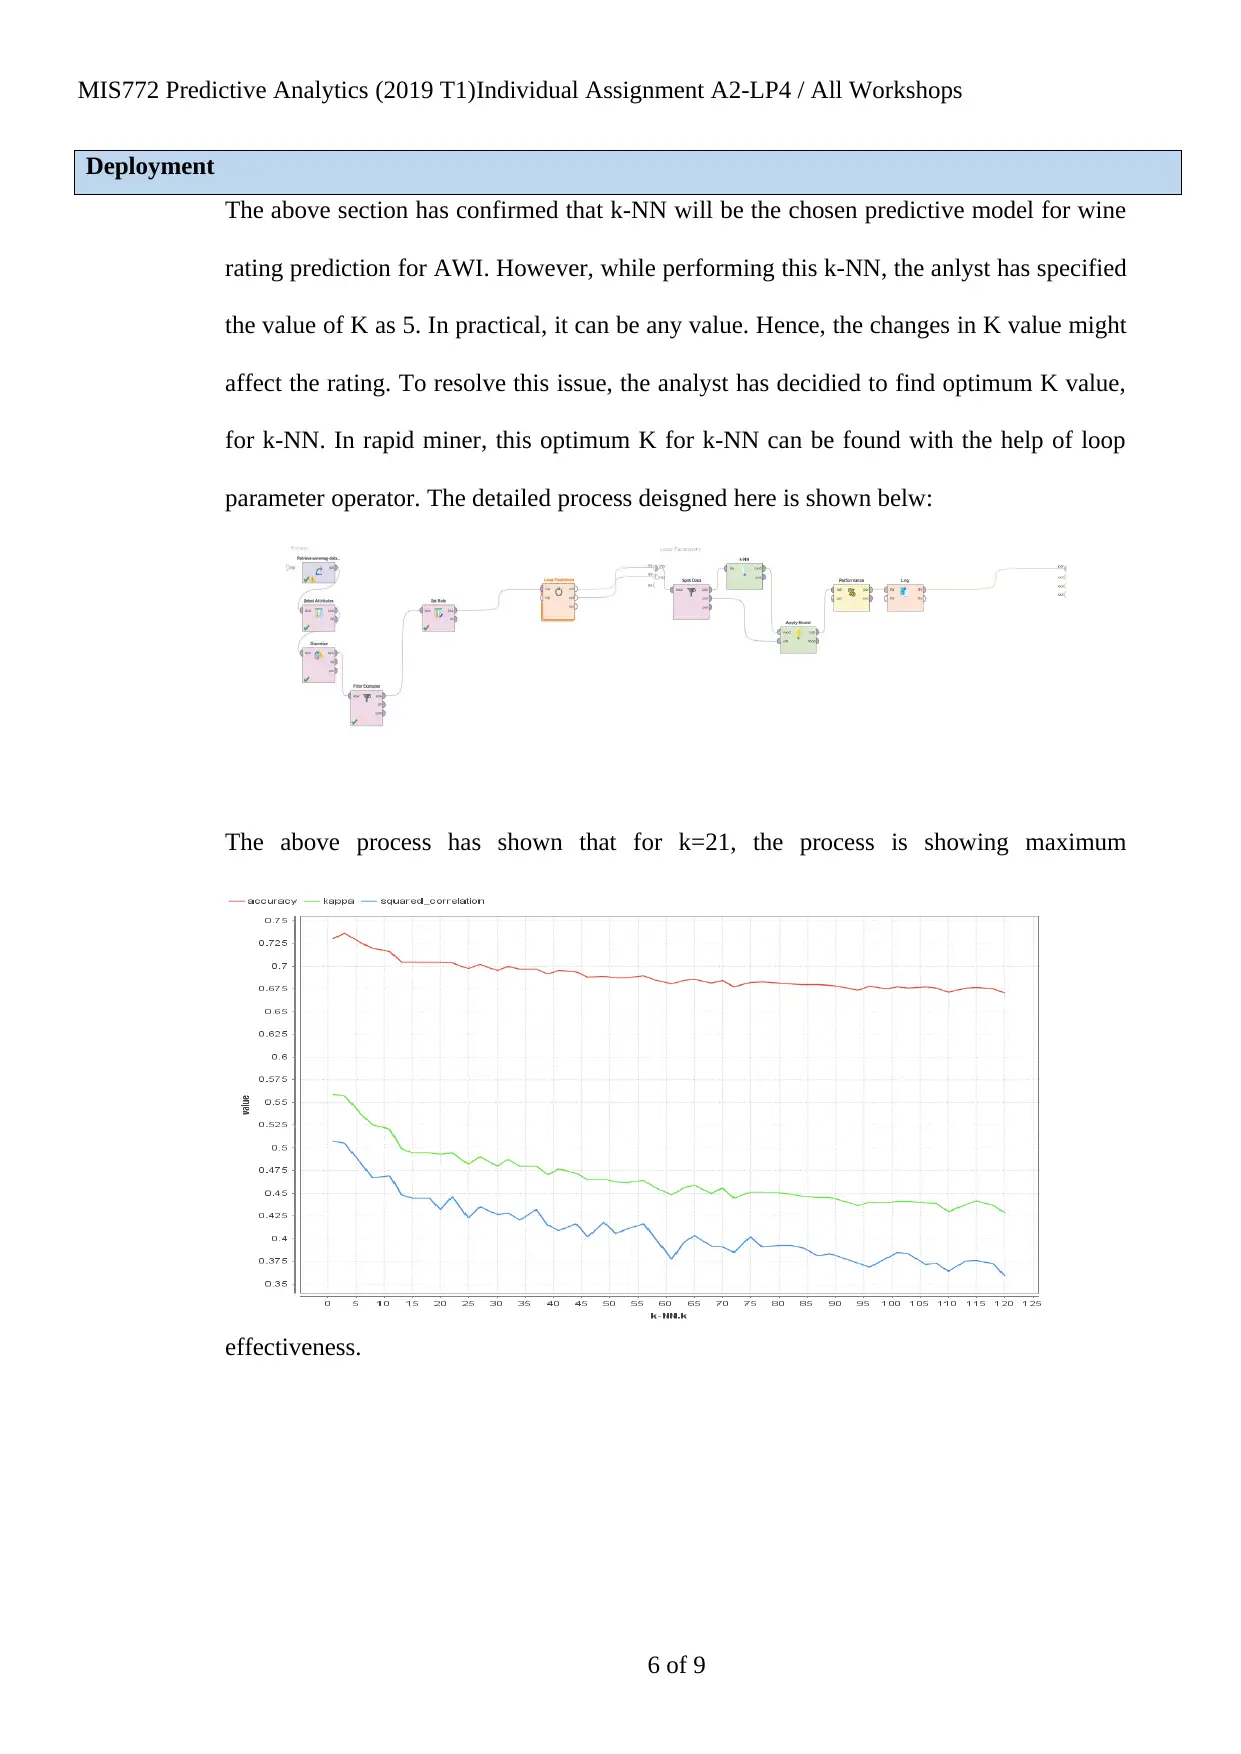
The above section has confirmed that k-NN will be the chosen predictive model for wine
rating prediction for AWI. However, while performing this k-NN, the anlyst has specified
the value of K as 5. In practical, it can be any value. Hence, the changes in K value might
affect the rating. To resolve this issue, the analyst has decidied to find optimum K value,
for k-NN. In rapid miner, this optimum K for k-NN can be found with the help of loop
parameter operator. The detailed process deisgned here is shown belw:
The above process has shown that for k=21, the process is showing maximum
effectiveness.
6 of 9
Deployment
The above section has confirmed that k-NN will be the chosen predictive model for wine
rating prediction for AWI. However, while performing this k-NN, the anlyst has specified
the value of K as 5. In practical, it can be any value. Hence, the changes in K value might
affect the rating. To resolve this issue, the analyst has decidied to find optimum K value,
for k-NN. In rapid miner, this optimum K for k-NN can be found with the help of loop
parameter operator. The detailed process deisgned here is shown belw:
The above process has shown that for k=21, the process is showing maximum
effectiveness.
6 of 9
⊘ This is a preview!⊘
Do you want full access?
Subscribe today to unlock all pages.
Trusted by 1+ million students worldwide
MIS772 Predictive Analytics (2019 T1)Individual Assignment A2-LP4 / All Workshops
Provide an Integrated Solution in RapidMiner
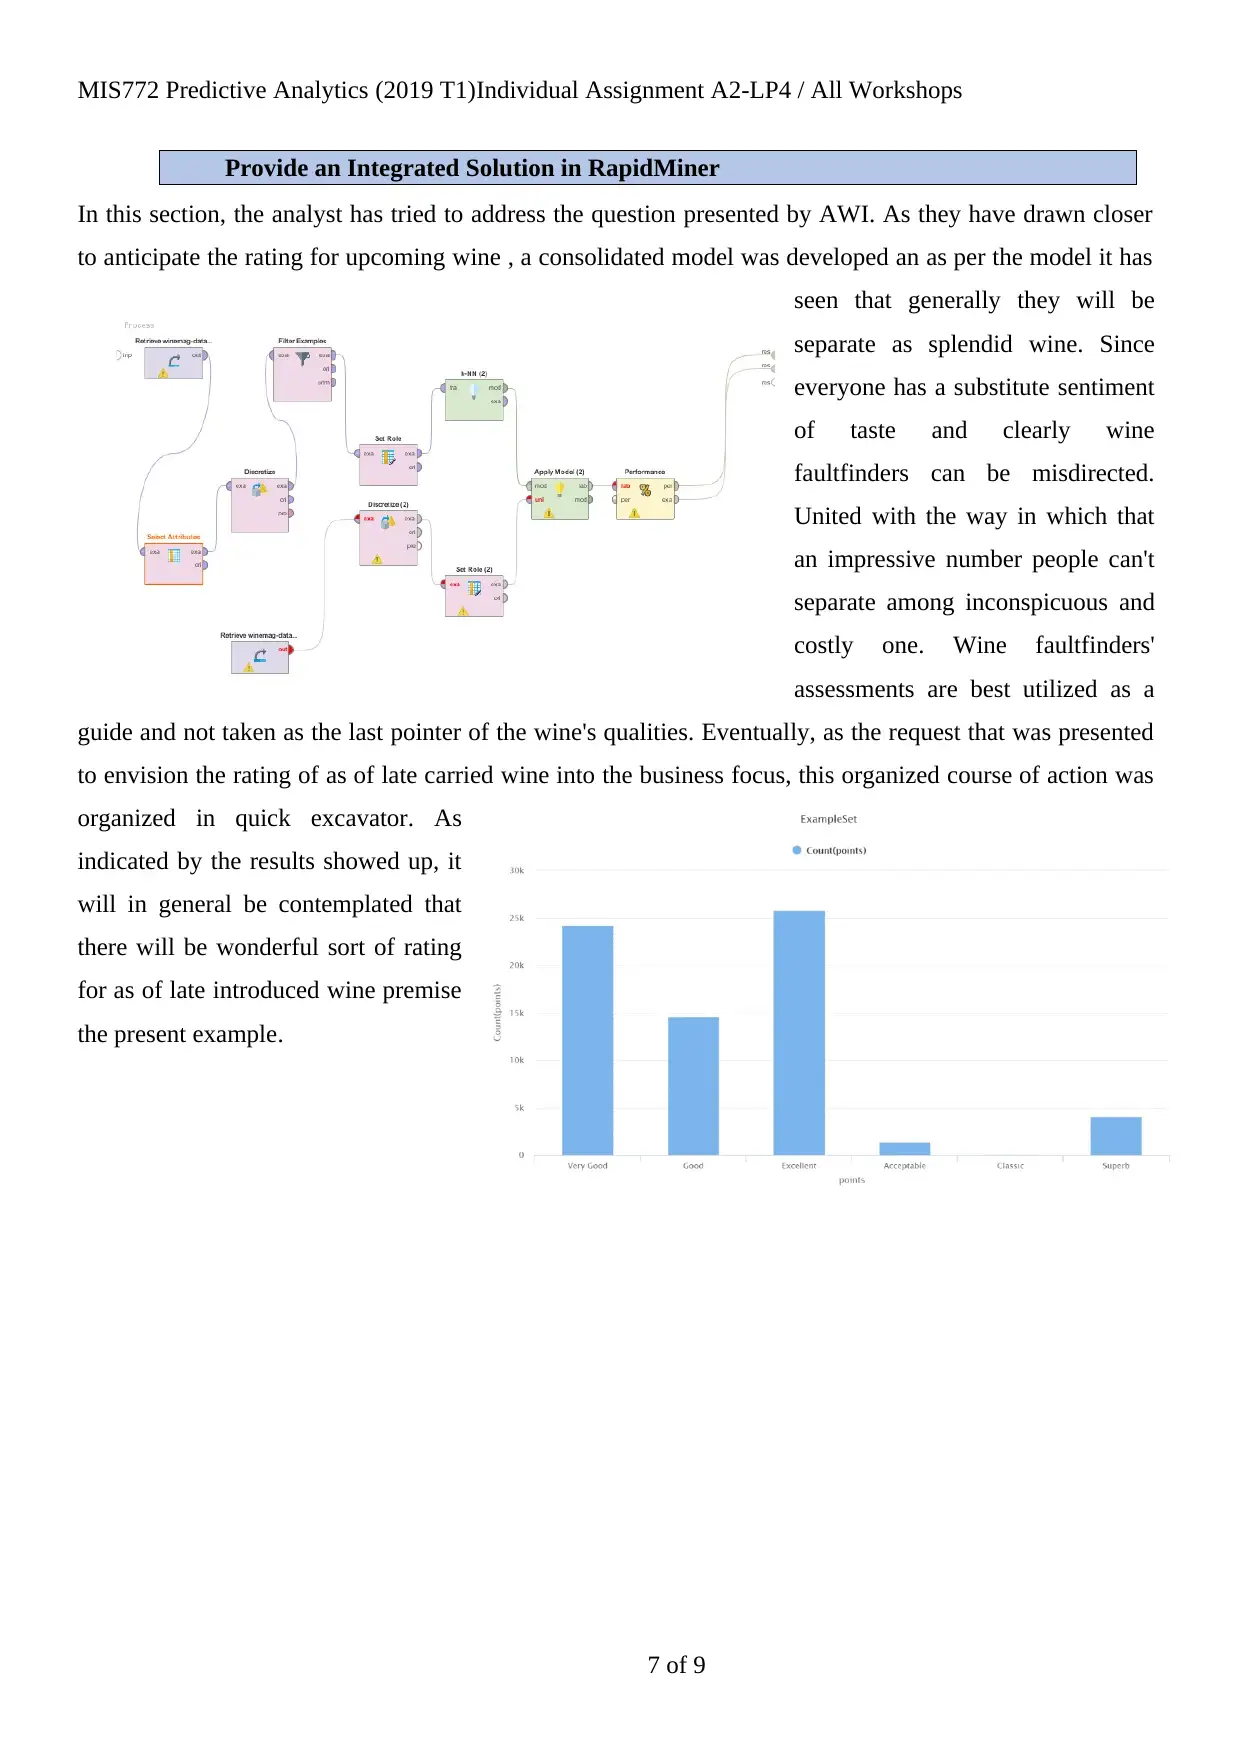
In this section, the analyst has tried to address the question presented by AWI. As they have drawn closer
to anticipate the rating for upcoming wine , a consolidated model was developed an as per the model it has
seen that generally they will be
separate as splendid wine. Since
everyone has a substitute sentiment
of taste and clearly wine
faultfinders can be misdirected.
United with the way in which that
an impressive number people can't
separate among inconspicuous and
costly one. Wine faultfinders'
assessments are best utilized as a
guide and not taken as the last pointer of the wine's qualities. Eventually, as the request that was presented
to envision the rating of as of late carried wine into the business focus, this organized course of action was
organized in quick excavator. As
indicated by the results showed up, it
will in general be contemplated that
there will be wonderful sort of rating
for as of late introduced wine premise
the present example.
7 of 9
Provide an Integrated Solution in RapidMiner
In this section, the analyst has tried to address the question presented by AWI. As they have drawn closer
to anticipate the rating for upcoming wine , a consolidated model was developed an as per the model it has
seen that generally they will be
separate as splendid wine. Since
everyone has a substitute sentiment
of taste and clearly wine
faultfinders can be misdirected.
United with the way in which that
an impressive number people can't
separate among inconspicuous and
costly one. Wine faultfinders'
assessments are best utilized as a
guide and not taken as the last pointer of the wine's qualities. Eventually, as the request that was presented
to envision the rating of as of late carried wine into the business focus, this organized course of action was
organized in quick excavator. As
indicated by the results showed up, it
will in general be contemplated that
there will be wonderful sort of rating
for as of late introduced wine premise
the present example.
7 of 9
Paraphrase This Document
Need a fresh take? Get an instant paraphrase of this document with our AI Paraphraser
MIS772 Predictive Analytics (2019 T1)Individual Assignment A2-LP4 / All Workshops
Further Research and Extensions in RM
The researcher has extended this research by introducing k-NN model in R. following code was developed to build k-NN in R
library(caret)
wine_df <- read.csv("k-nn.csv", header = FALSE)
set.seed(3033)
intrain <- createDataPartition(y = wine_df$V1, p= 0.7, list = FALSE)
training <- wine_df[intrain,]
testing <- wine_df[-intrain,]
trctrl <- trainControl(method = "repeatedcv", number = 10, repeats = 3)
set.seed(3333)
knn_fit <- train(V1 ~., data = training, method = "knn",
trControl=trctrl,
preProcess = c("center", "scale"),
tuneLength = 10)
k Accuracy Kappa
5 0.9543790 0.9317929
7 0.9404512 0.9109657
9 0.9379260 0.9073292
11 0.9374598 0.9067419
13 0.9396270 0.9099077
15 0.9482129 0.9225977
17 0.9479604 0.9222815
19 0.9516706 0.9276711
21 0.9597597 0.9401666
23 0.9432678 0.9152521
Accuracy was used to select the optimal model using the largest value.
The final value used for the model was k = 21
The result has shown 95% accuracy.
8 of 9
MIS772 Predictive Analytics (2019 T1)Individual Assignment A2-LP4 / All Workshops
Bibliography:
Bifet, A., Zhang, J., Fan, W., He, C., Zhang, J., Qian, J., Holmes, G. and Pfahringer, B.,
2017, August. Extremely fast decision tree mining for evolving data streams. In
Proceedings of the 23rd ACM SIGKDD International Conference on Knowledge
Discovery and Data Mining (pp. 1733-1742). ACM.
Gentile, A.L., Kirstein, S., Paulheim, H. and Bizer, C., 2016, May. Extending RapidMiner
with data search and integration capabilities. In European Semantic Web Conference (pp.
167-171). Springer, Cham.
Ristoski, P., Bizer, C. and Paulheim, H., 2015. Mining the web of linked data with
rapidminer. Web Semantics: Science, Services and Agents on the World Wide Web, 35,
pp.142-151.
Roiger, R.J., 2017. Data mining: a tutorial-based primer. Chapman and Hall/CRC.
Windarto, A.P. and Wanto, A., 2018, September. Data mining tools| rapidminer: K-means
method on clustering of rice crops by province as efforts to stabilize food crops in
Indonesia. In IOP Conference Series: Materials Science and Engineering (Vol. 420, No.
1, p. 012089). IOP Publishing.
9 of 9
⊘ This is a preview!⊘
Do you want full access?
Subscribe today to unlock all pages.
Trusted by 1+ million students worldwide
1 out of 9
Related Documents


Your All-in-One AI-Powered Toolkit for Academic Success.
+13062052269
info@desklib.com
Available 24*7 on WhatsApp / Email
![[object Object]](/_next/static/media/star-bottom.7253800d.svg)
Unlock your academic potential
Copyright © 2020–2026 A2Z Services. All Rights Reserved. Developed and managed by ZUCOL.