National Clothing RARE: Promotional Sales Statistical Analysis

Verified

Added on  2023/01/23

|12
|1121
|86
Project
AI Summary
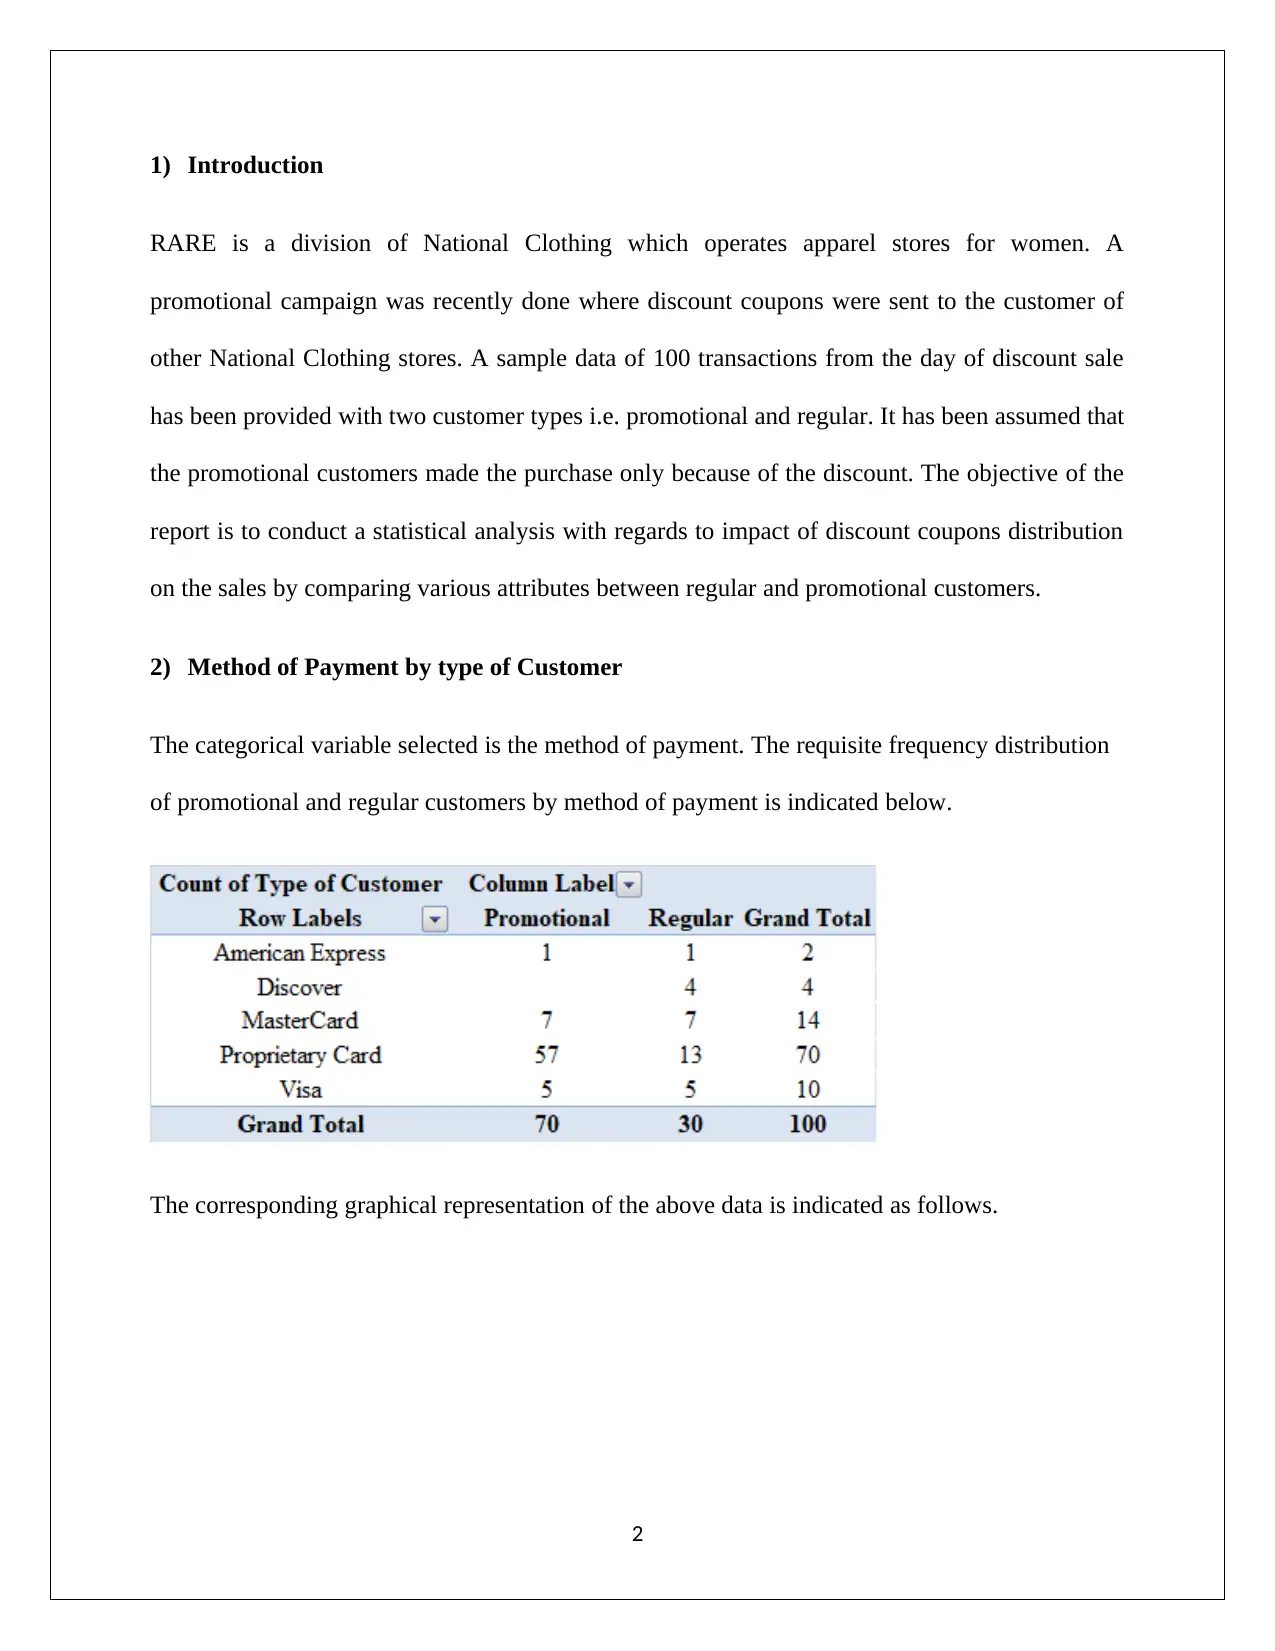
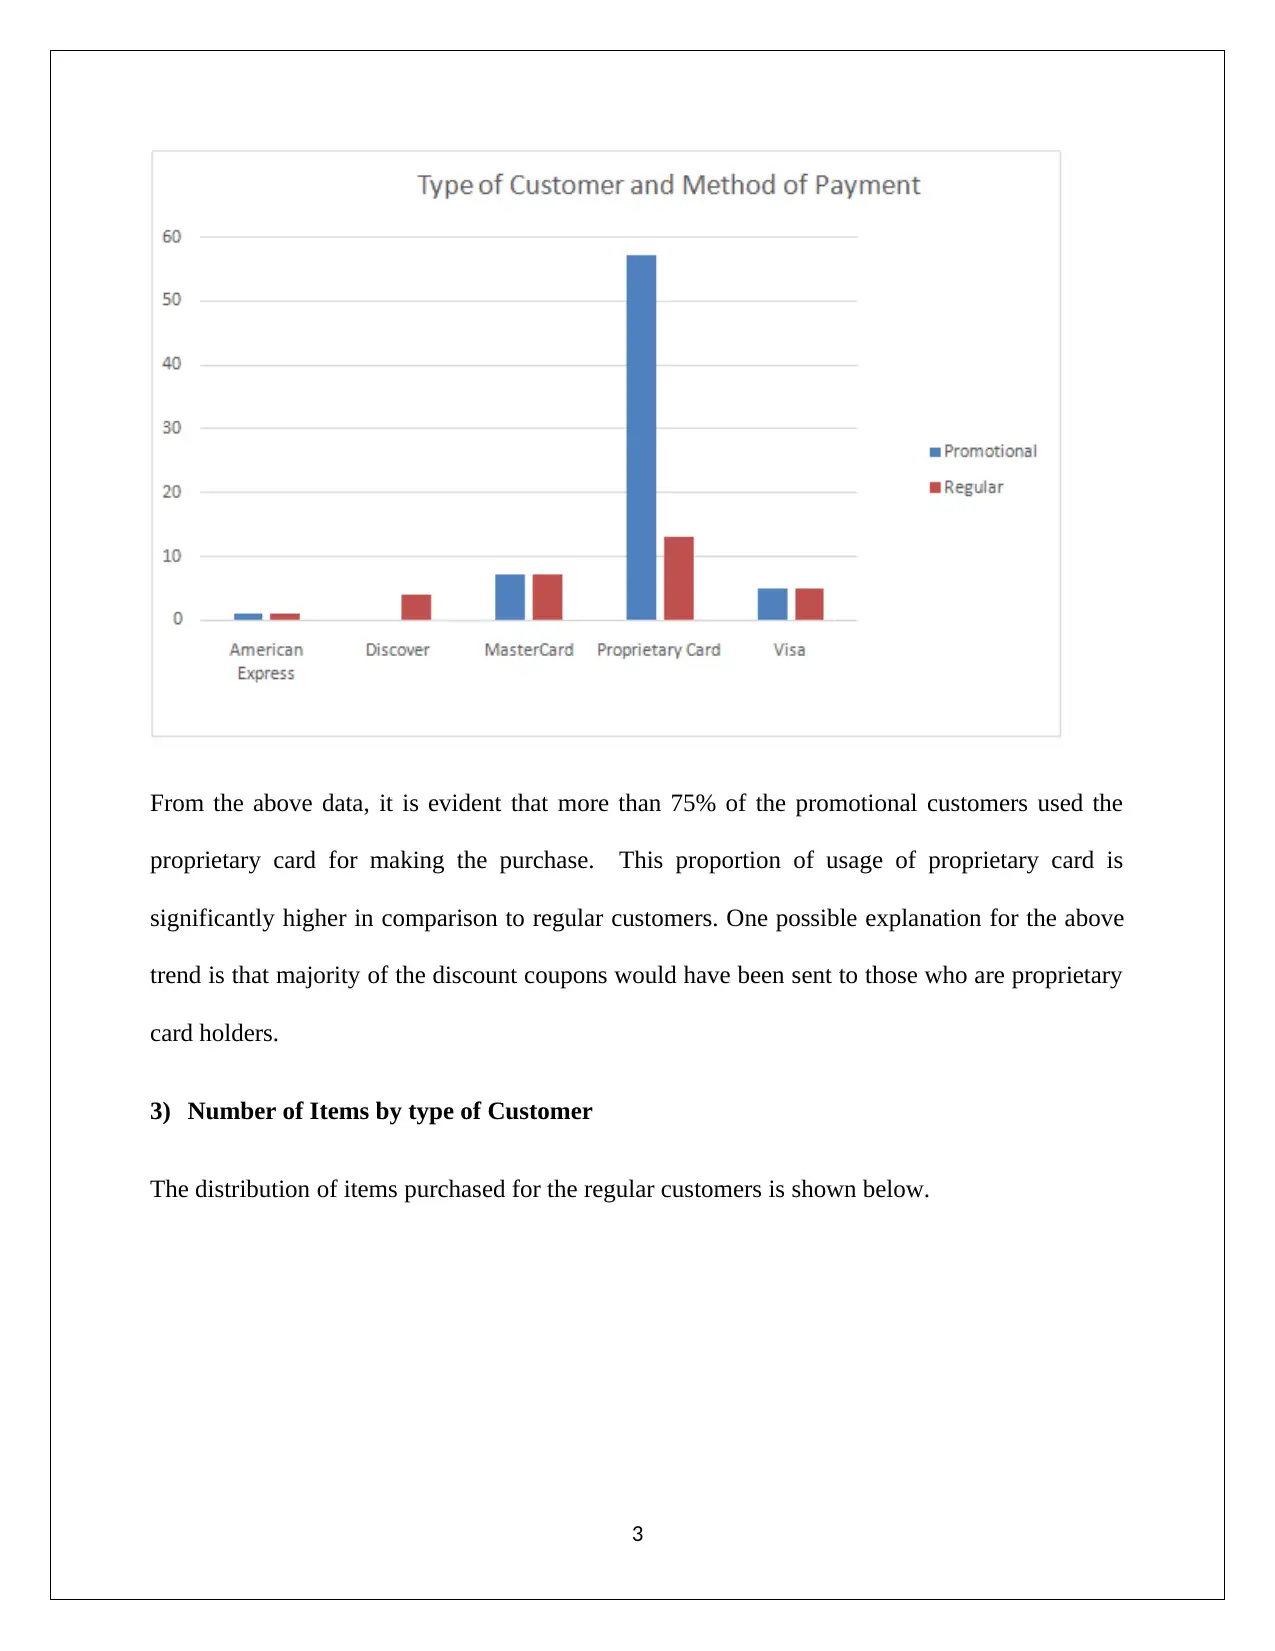
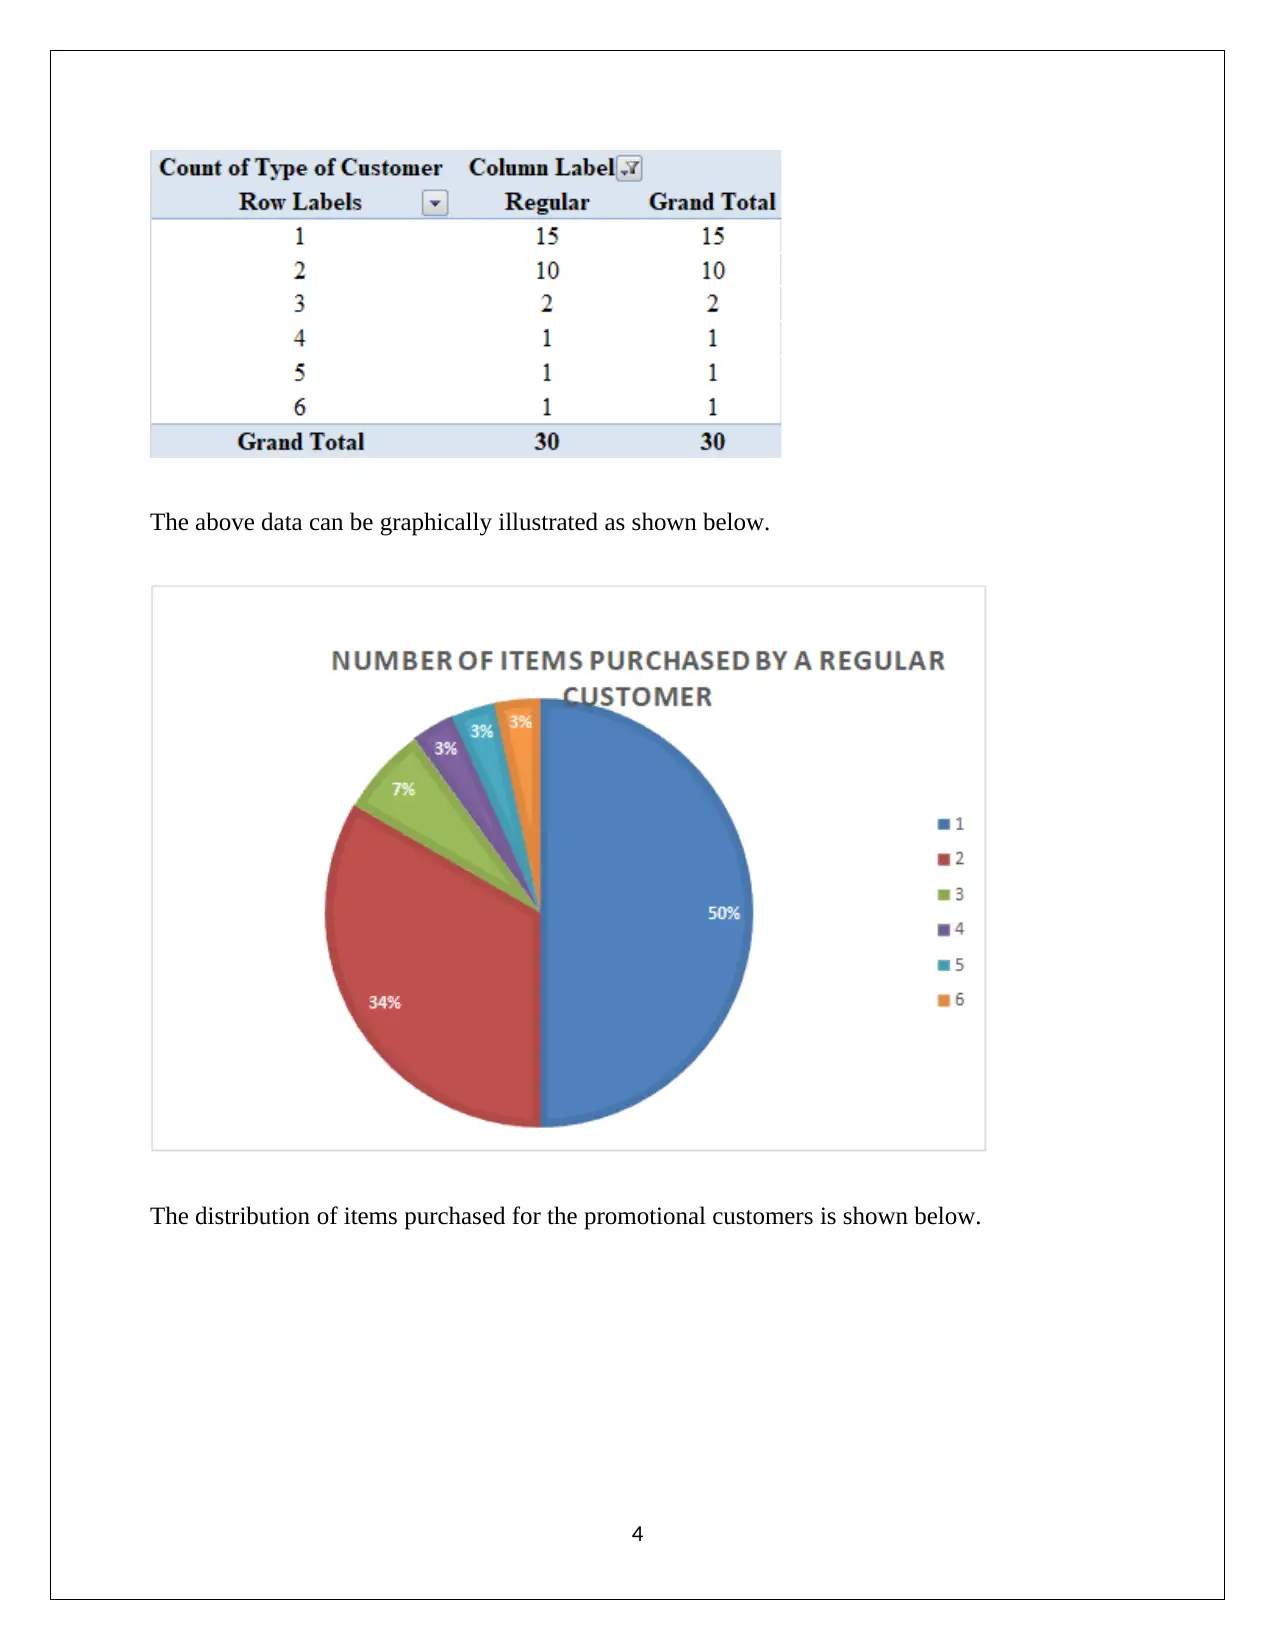
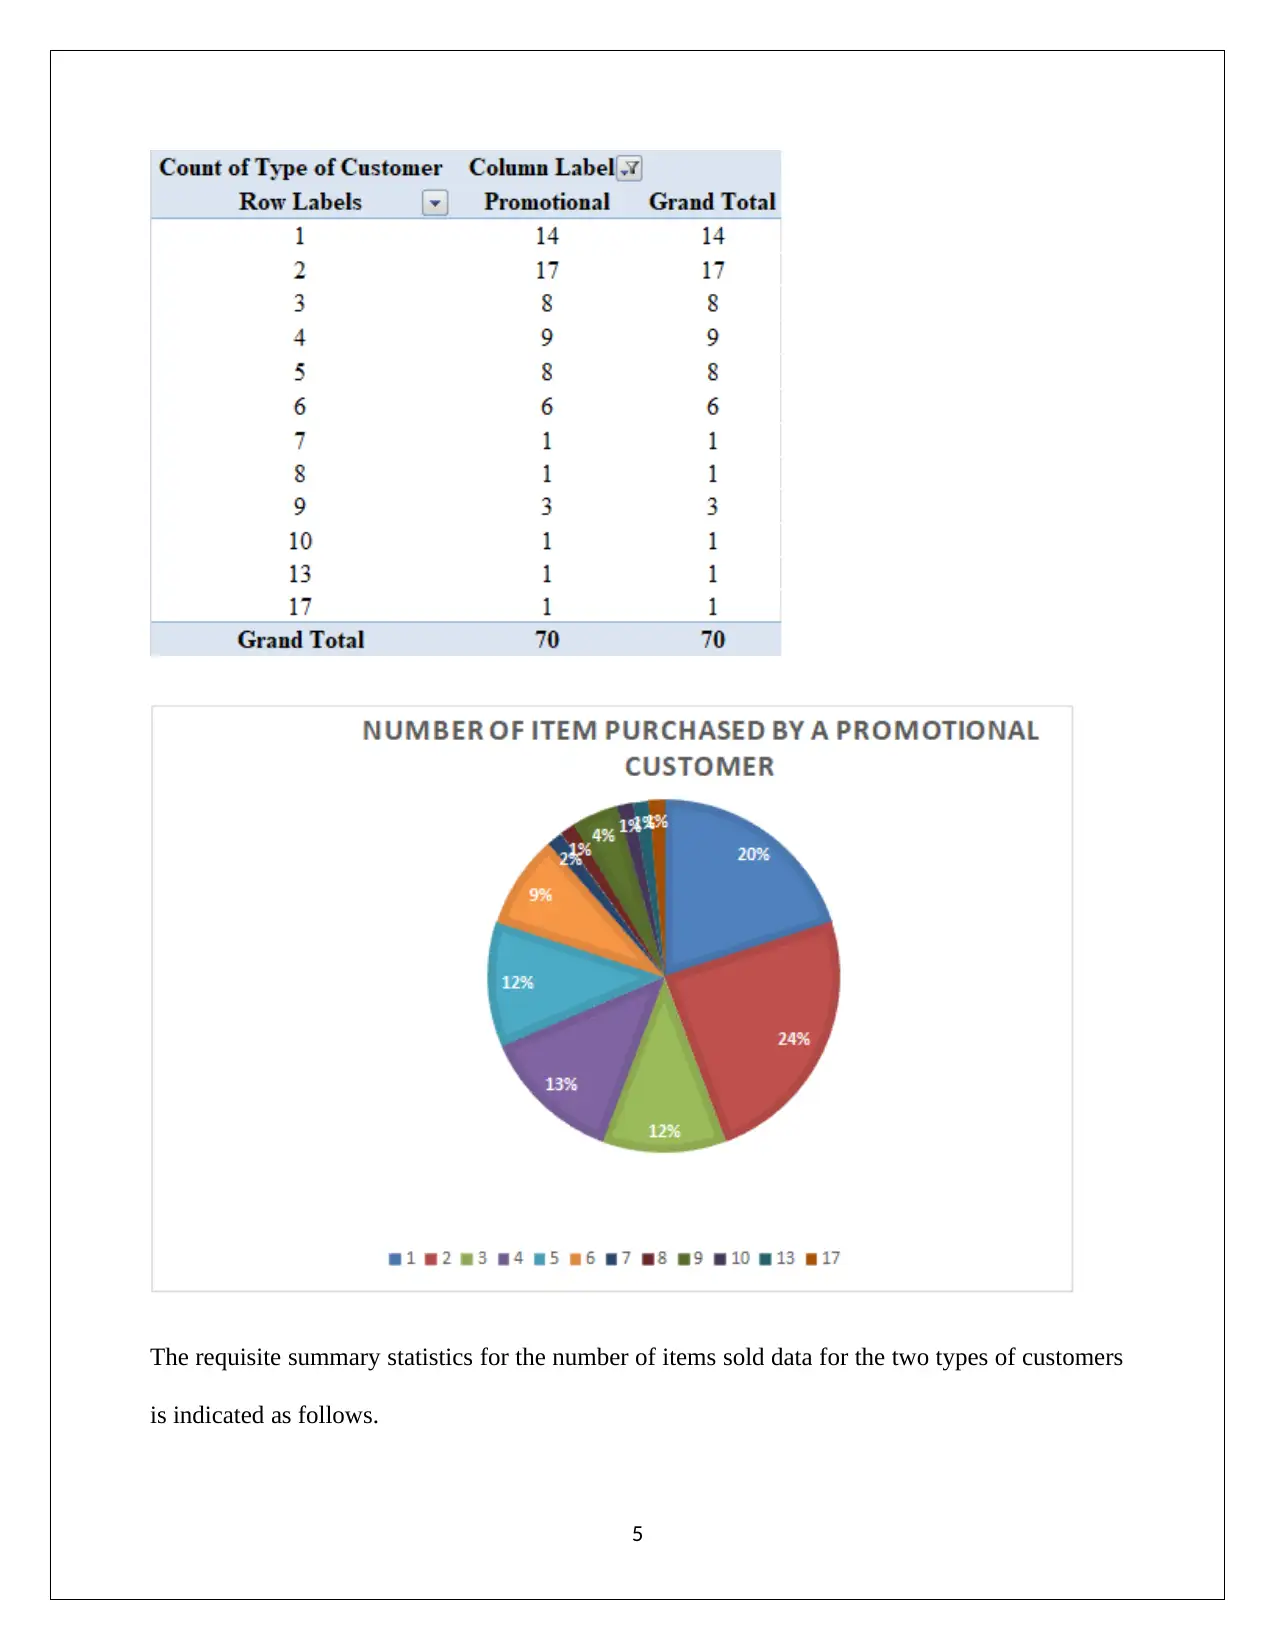
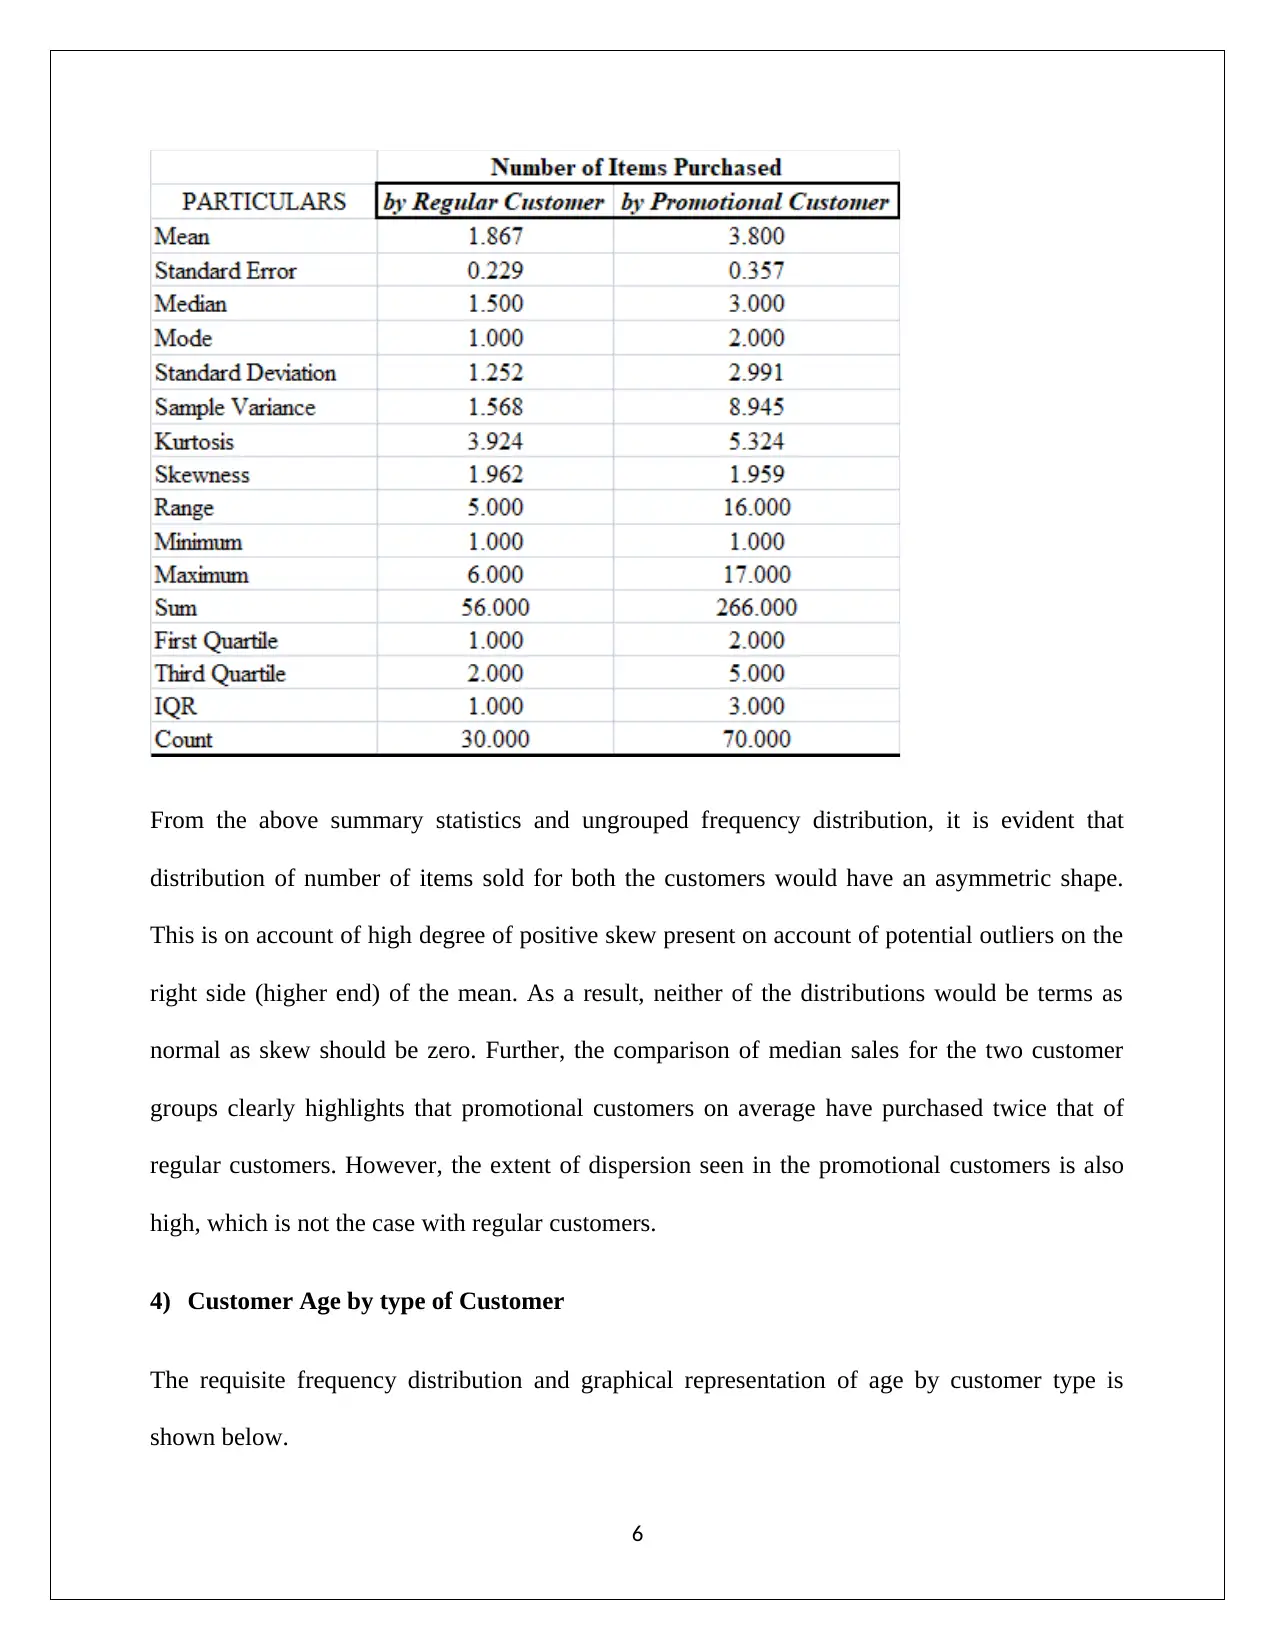
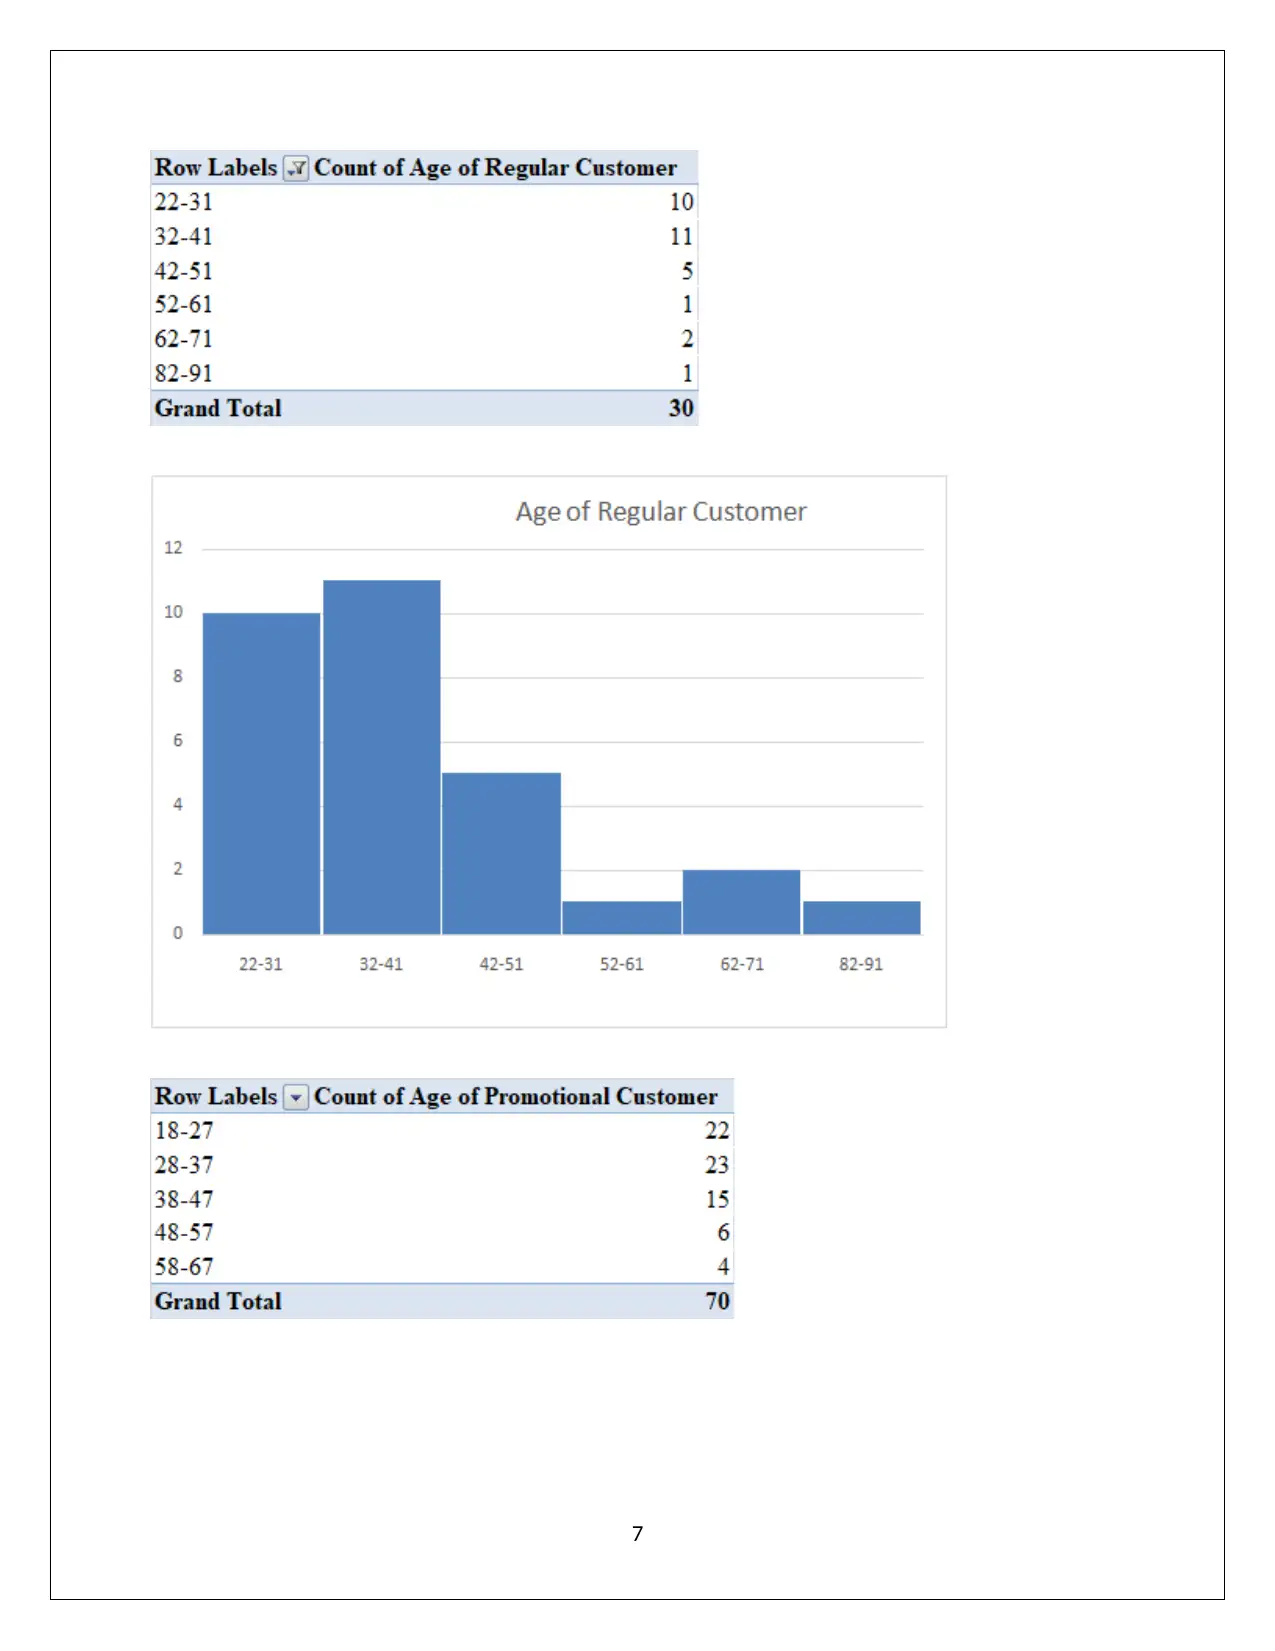
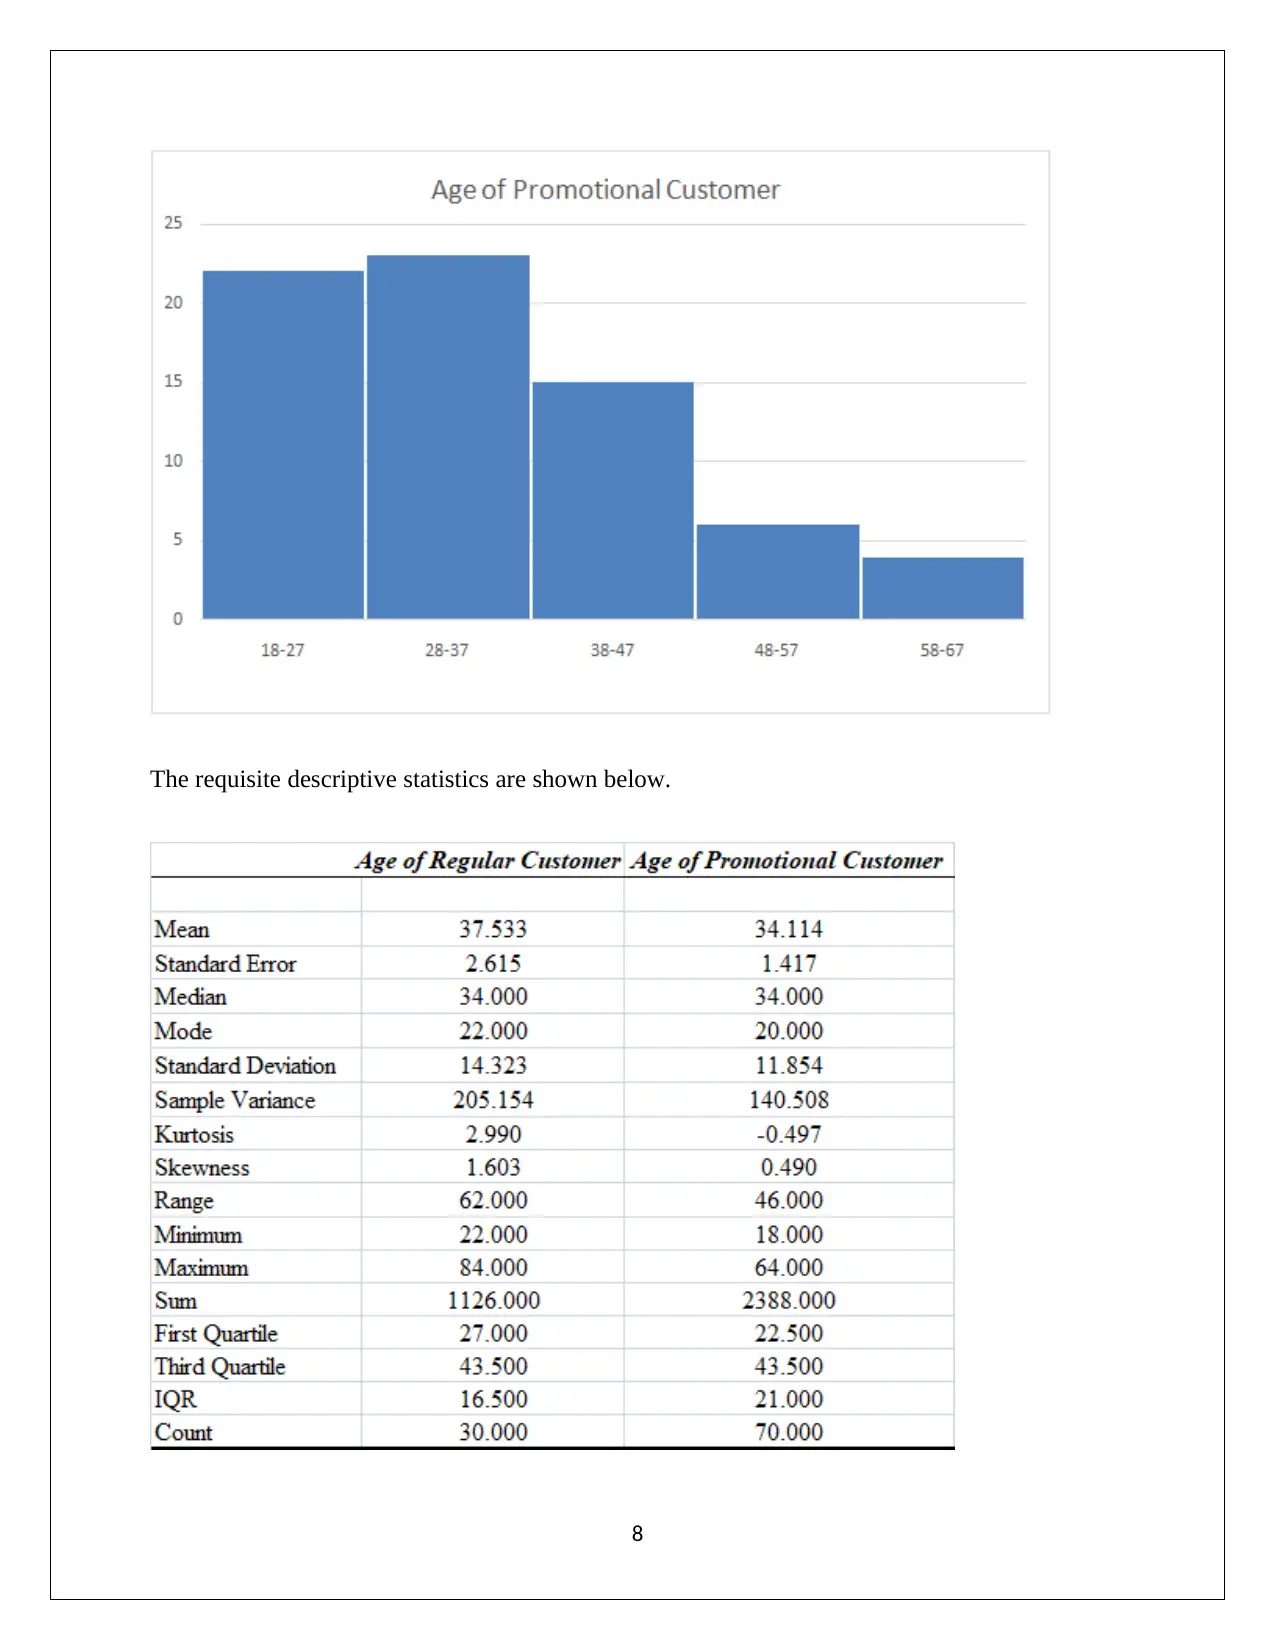
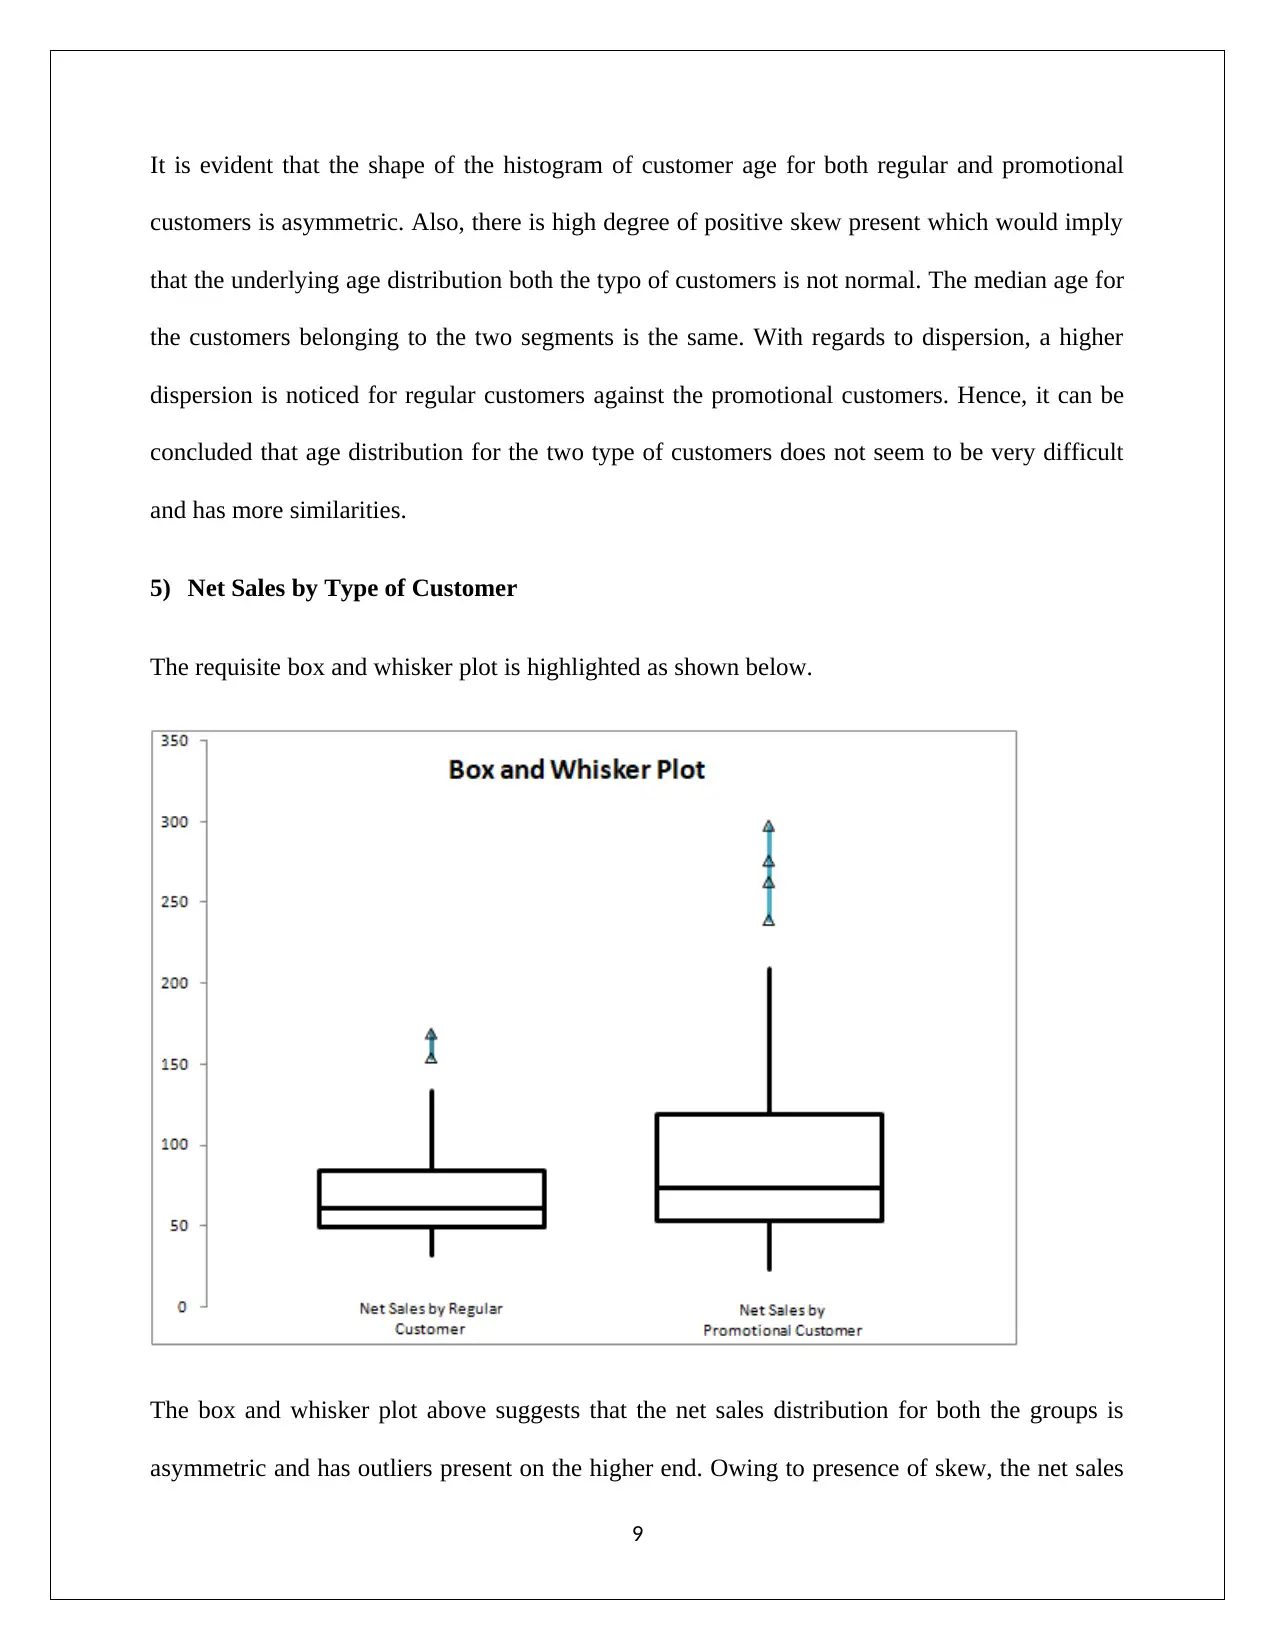
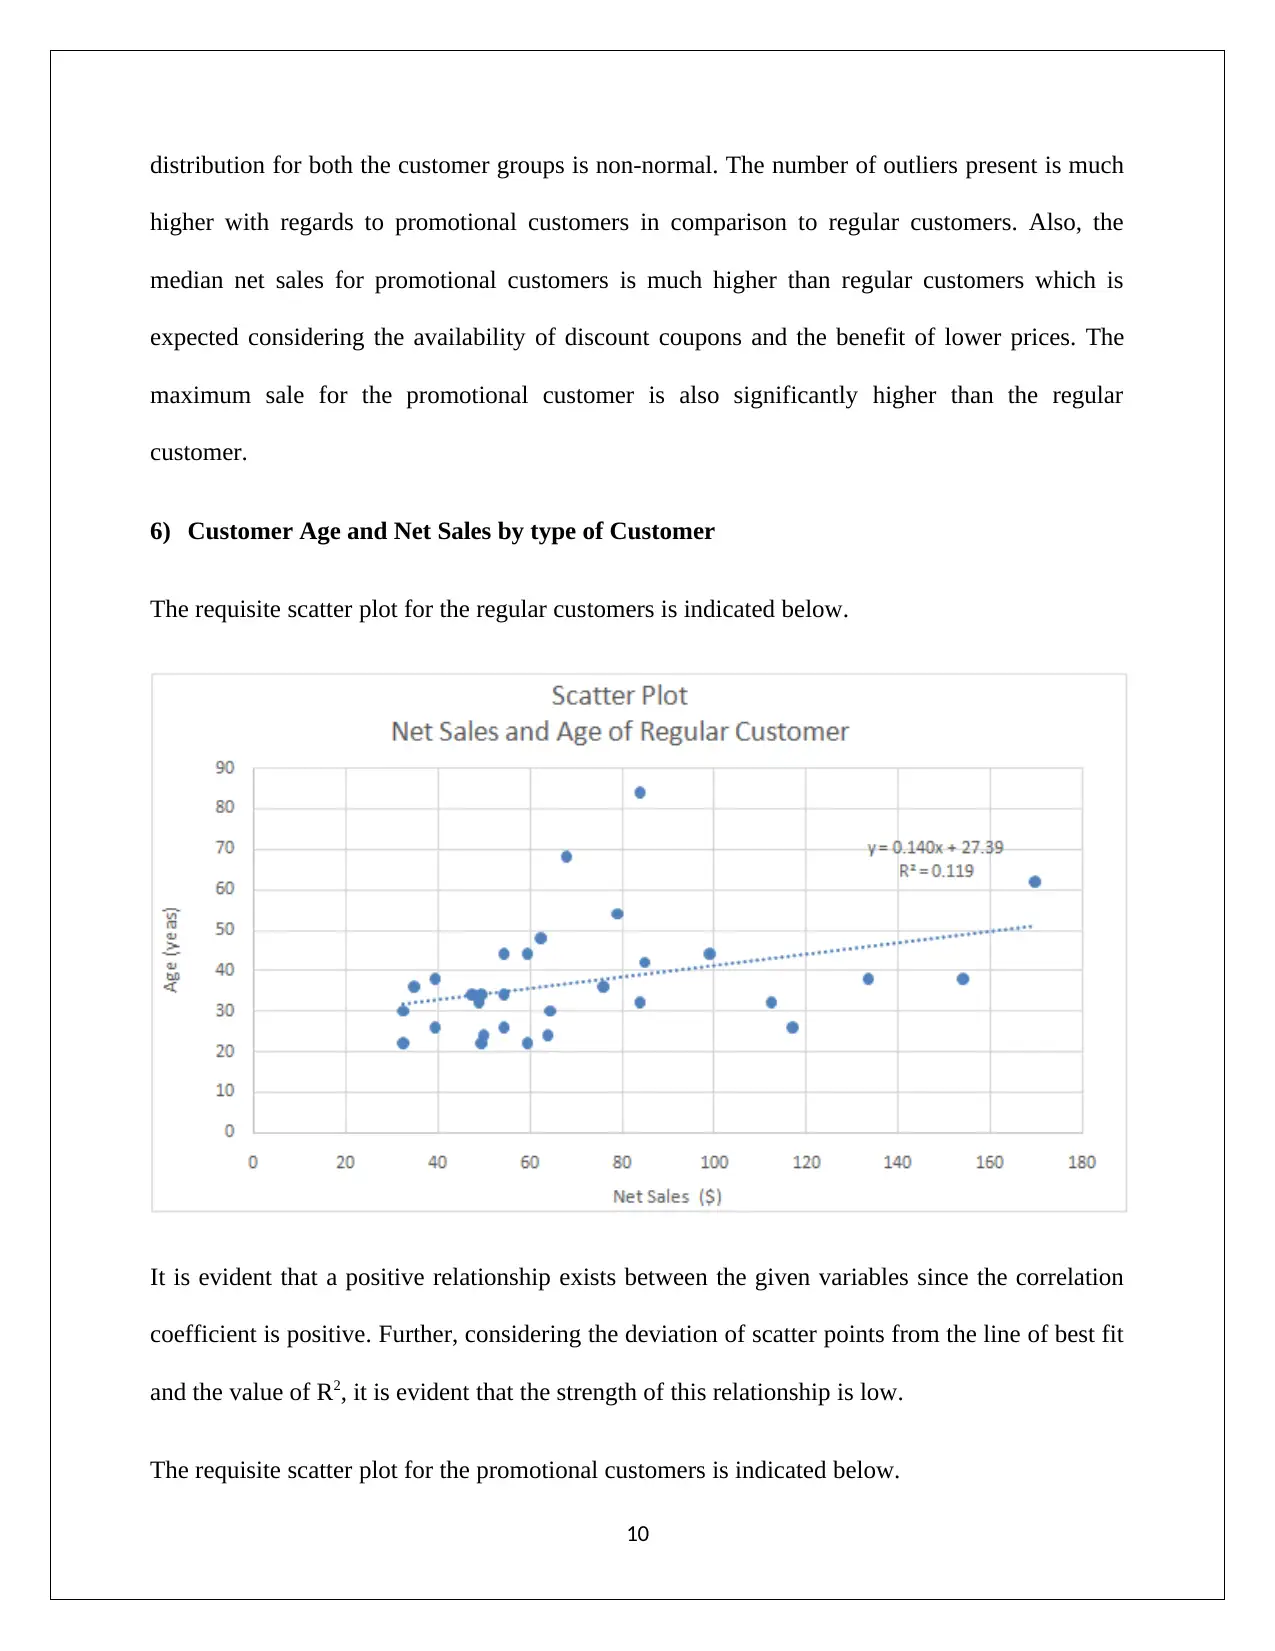
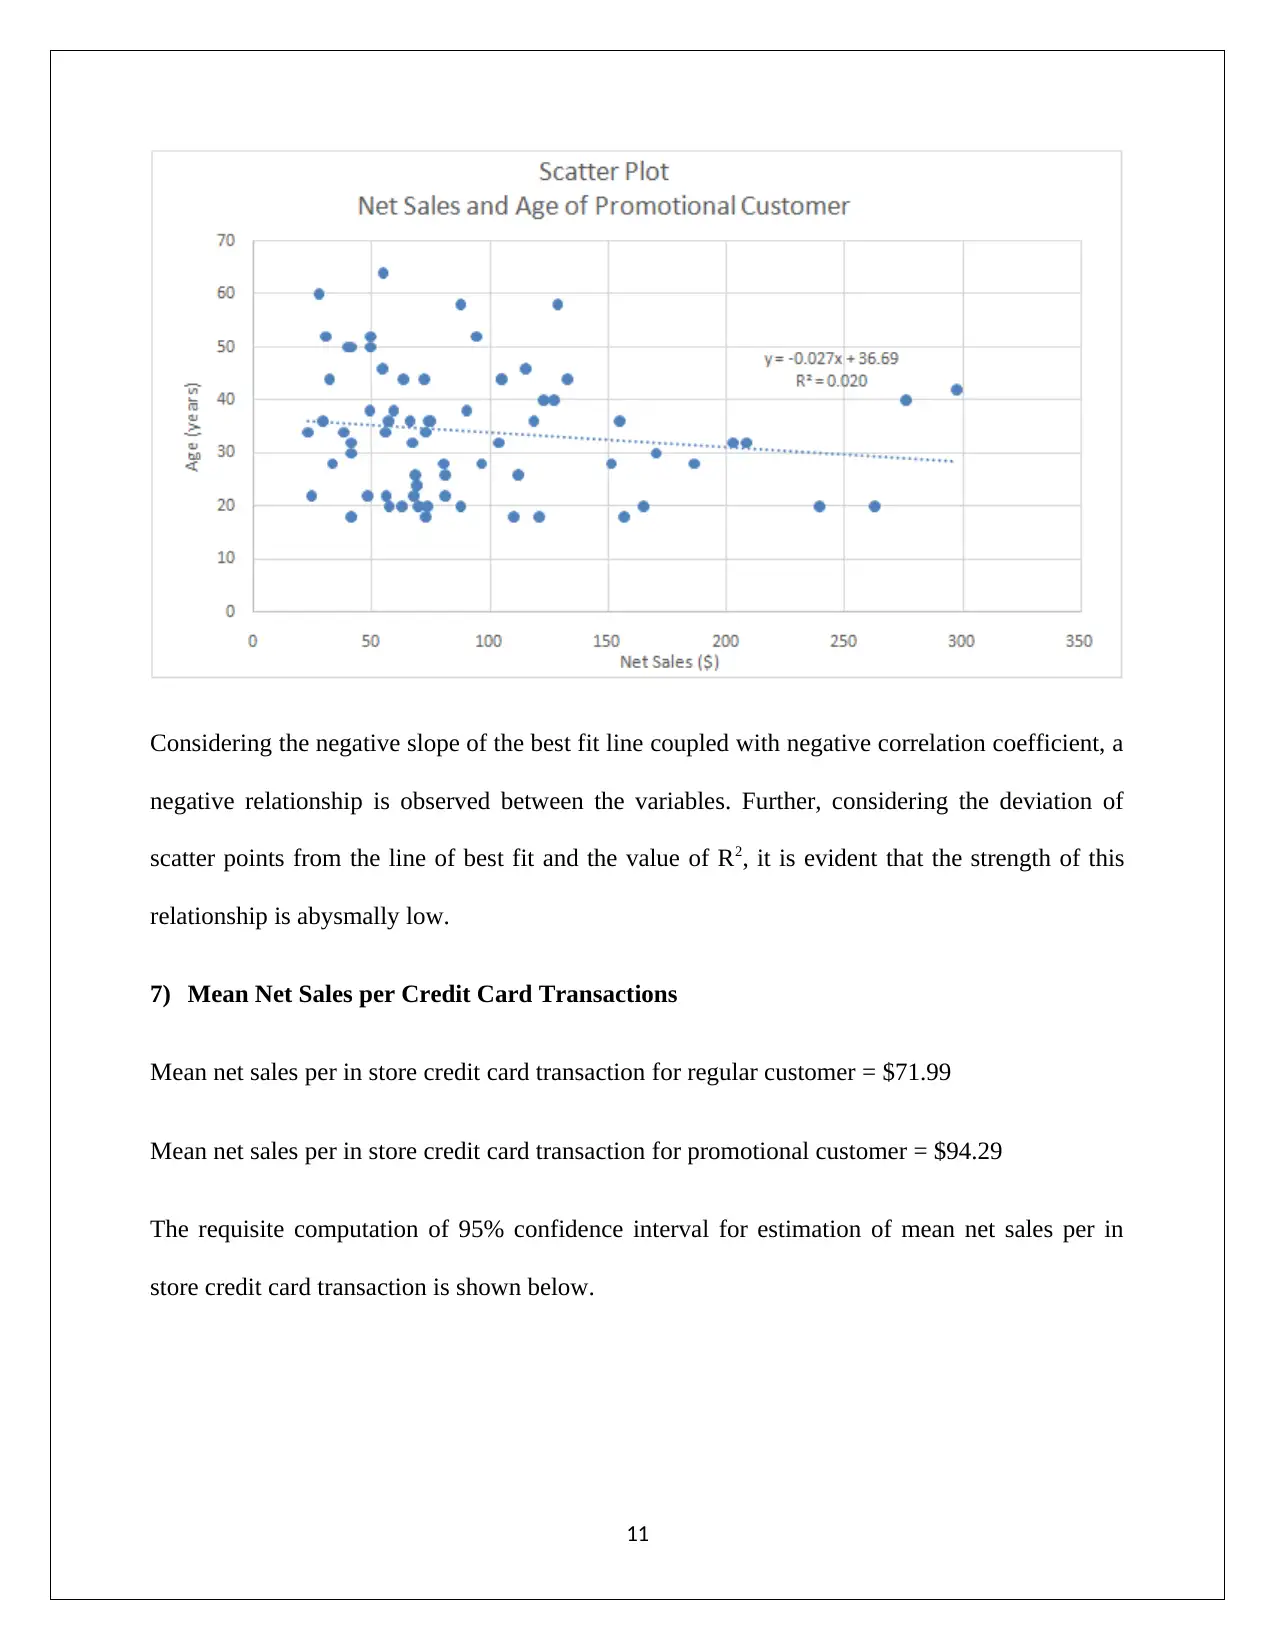
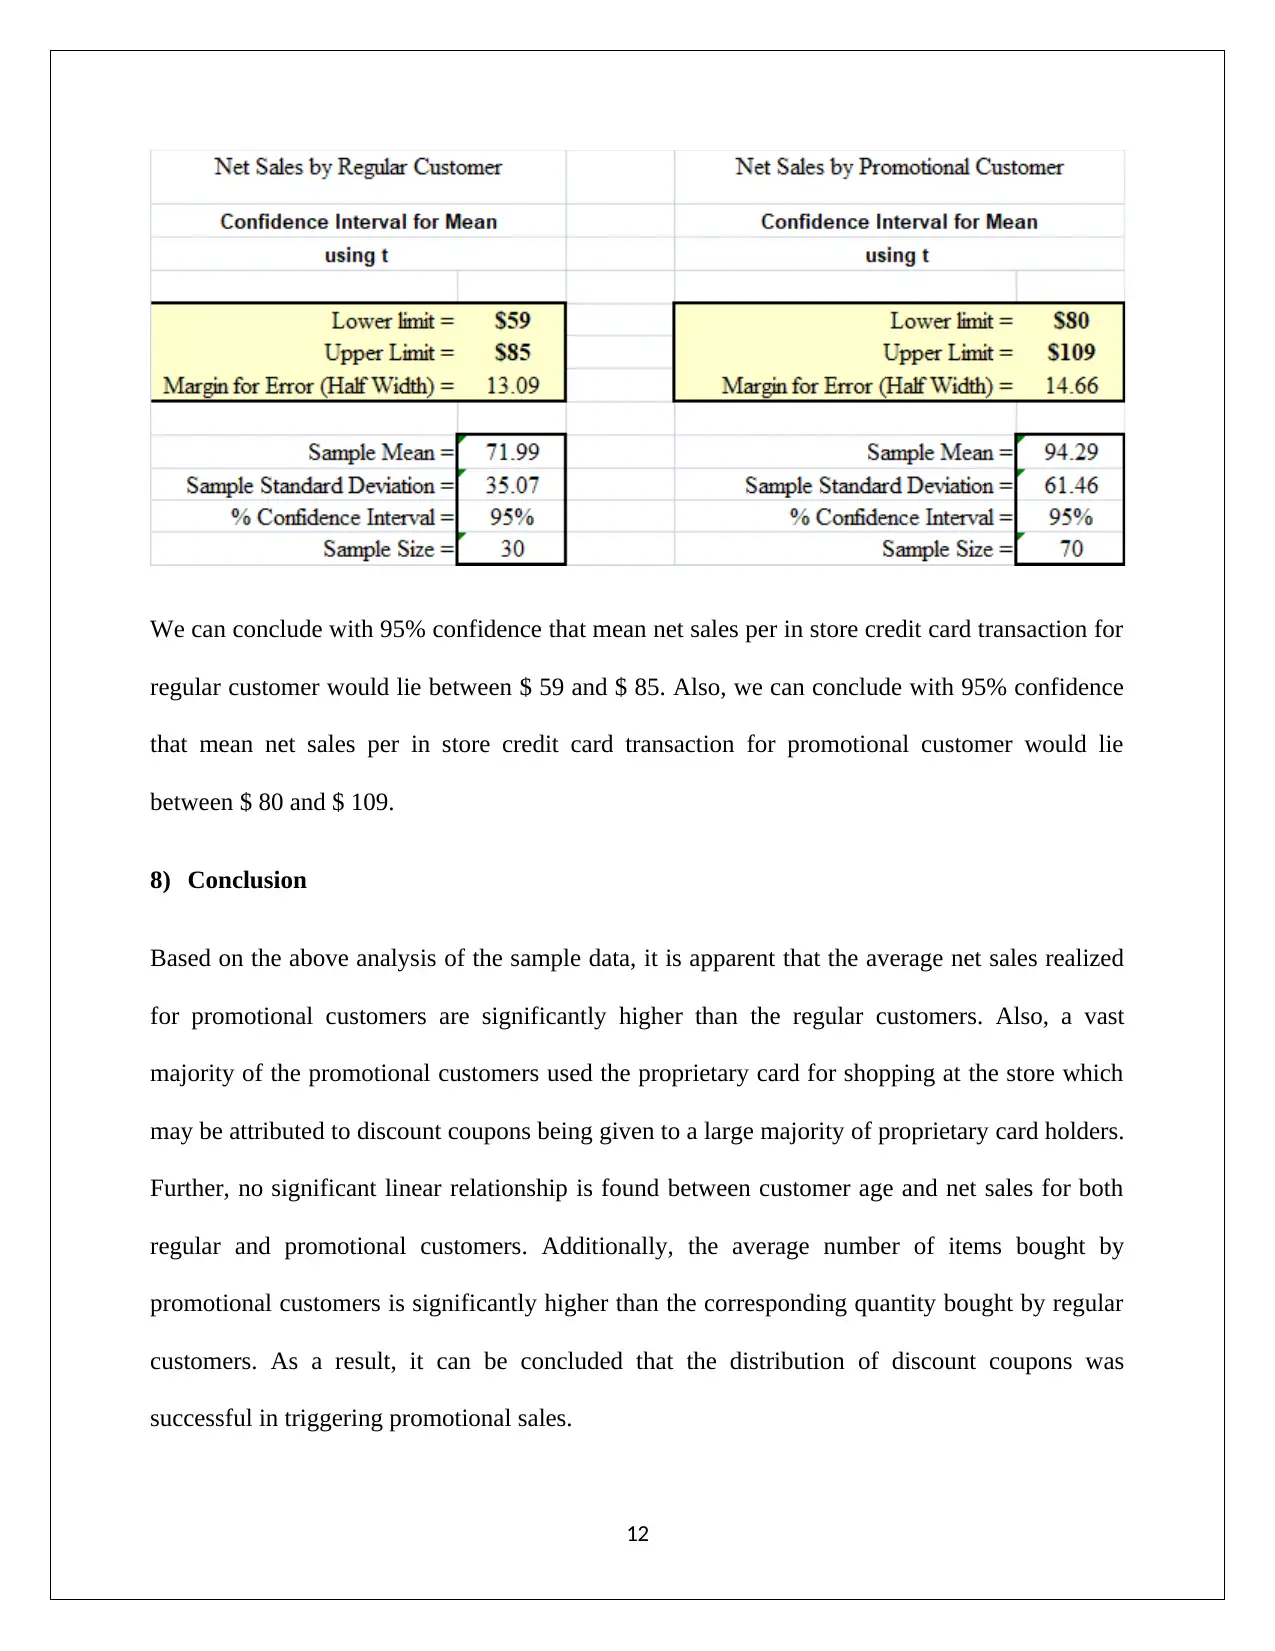
This capstone project analyzes the impact of a promotional campaign on sales at RARE, a division of National Clothing. The analysis uses a sample of 100 transactions, comparing regular and promotional customers across various attributes. The study examines payment methods, finding that promotional customers heavily utilized proprietary cards, potentially due to targeted coupon distribution. It analyzes the number of items purchased, revealing that promotional customers bought twice as many items on average. Customer age and net sales are also examined, showing similarities in age distribution but higher net sales for promotional customers. Scatter plots reveal weak linear relationships between age and net sales. The project concludes that the discount coupons were successful in increasing sales, with promotional customers showing significantly higher net sales and purchasing more items. Confidence intervals for mean net sales per credit card transaction are also provided, reinforcing the campaign's positive impact.
Document Page
PROBLEM ANALYSIS AND STATISTICS
CAPSTONE PROJECT
STUDENT ID:
[Pick the date]
tabler-icon-diamond-filled.svg

Paraphrase This Document

Need a fresh take? Get an instant paraphrase of this document with our AI Paraphraser
Document Page
1) Introduction
RARE is a division of National Clothing which operates apparel stores for women. A
promotional campaign was recently done where discount coupons were sent to the customer of
other National Clothing stores. A sample data of 100 transactions from the day of discount sale
has been provided with two customer types i.e. promotional and regular. It has been assumed that
the promotional customers made the purchase only because of the discount. The objective of the
report is to conduct a statistical analysis with regards to impact of discount coupons distribution
on the sales by comparing various attributes between regular and promotional customers.
2) Method of Payment by type of Customer
The categorical variable selected is the method of payment. The requisite frequency distribution
of promotional and regular customers by method of payment is indicated below.
The corresponding graphical representation of the above data is indicated as follows.
2
Document Page
From the above data, it is evident that more than 75% of the promotional customers used the
proprietary card for making the purchase. This proportion of usage of proprietary card is
significantly higher in comparison to regular customers. One possible explanation for the above
trend is that majority of the discount coupons would have been sent to those who are proprietary
card holders.
3) Number of Items by type of Customer
The distribution of items purchased for the regular customers is shown below.
3
Document Page
The above data can be graphically illustrated as shown below.
The distribution of items purchased for the promotional customers is shown below.
4
tabler-icon-diamond-filled.svg

Paraphrase This Document

Need a fresh take? Get an instant paraphrase of this document with our AI Paraphraser
Document Page
The requisite summary statistics for the number of items sold data for the two types of customers
is indicated as follows.
5
Document Page
From the above summary statistics and ungrouped frequency distribution, it is evident that
distribution of number of items sold for both the customers would have an asymmetric shape.
This is on account of high degree of positive skew present on account of potential outliers on the
right side (higher end) of the mean. As a result, neither of the distributions would be terms as
normal as skew should be zero. Further, the comparison of median sales for the two customer
groups clearly highlights that promotional customers on average have purchased twice that of
regular customers. However, the extent of dispersion seen in the promotional customers is also
high, which is not the case with regular customers.
4) Customer Age by type of Customer
The requisite frequency distribution and graphical representation of age by customer type is
shown below.
6
Document Page
7
tabler-icon-diamond-filled.svg

Paraphrase This Document

Need a fresh take? Get an instant paraphrase of this document with our AI Paraphraser
Document Page
The requisite descriptive statistics are shown below.
8
Document Page
It is evident that the shape of the histogram of customer age for both regular and promotional
customers is asymmetric. Also, there is high degree of positive skew present which would imply
that the underlying age distribution both the typo of customers is not normal. The median age for
the customers belonging to the two segments is the same. With regards to dispersion, a higher
dispersion is noticed for regular customers against the promotional customers. Hence, it can be
concluded that age distribution for the two type of customers does not seem to be very difficult
and has more similarities.
5) Net Sales by Type of Customer
The requisite box and whisker plot is highlighted as shown below.
The box and whisker plot above suggests that the net sales distribution for both the groups is
asymmetric and has outliers present on the higher end. Owing to presence of skew, the net sales
9
Document Page
distribution for both the customer groups is non-normal. The number of outliers present is much
higher with regards to promotional customers in comparison to regular customers. Also, the
median net sales for promotional customers is much higher than regular customers which is
expected considering the availability of discount coupons and the benefit of lower prices. The
maximum sale for the promotional customer is also significantly higher than the regular
customer.
6) Customer Age and Net Sales by type of Customer
The requisite scatter plot for the regular customers is indicated below.
It is evident that a positive relationship exists between the given variables since the correlation
coefficient is positive. Further, considering the deviation of scatter points from the line of best fit
and the value of R2, it is evident that the strength of this relationship is low.
The requisite scatter plot for the promotional customers is indicated below.
10
tabler-icon-diamond-filled.svg

Paraphrase This Document

Need a fresh take? Get an instant paraphrase of this document with our AI Paraphraser
Document Page
Considering the negative slope of the best fit line coupled with negative correlation coefficient, a
negative relationship is observed between the variables. Further, considering the deviation of
scatter points from the line of best fit and the value of R2, it is evident that the strength of this
relationship is abysmally low.
7) Mean Net Sales per Credit Card Transactions
Mean net sales per in store credit card transaction for regular customer = $71.99
Mean net sales per in store credit card transaction for promotional customer = $94.29
The requisite computation of 95% confidence interval for estimation of mean net sales per in
store credit card transaction is shown below.
11
Document Page
We can conclude with 95% confidence that mean net sales per in store credit card transaction for
regular customer would lie between $ 59 and $ 85. Also, we can conclude with 95% confidence
that mean net sales per in store credit card transaction for promotional customer would lie
between $ 80 and $ 109.
8) Conclusion
Based on the above analysis of the sample data, it is apparent that the average net sales realized
for promotional customers are significantly higher than the regular customers. Also, a vast
majority of the promotional customers used the proprietary card for shopping at the store which
may be attributed to discount coupons being given to a large majority of proprietary card holders.
Further, no significant linear relationship is found between customer age and net sales for both
regular and promotional customers. Additionally, the average number of items bought by
promotional customers is significantly higher than the corresponding quantity bought by regular
customers. As a result, it can be concluded that the distribution of discount coupons was
successful in triggering promotional sales.
12
chevron_up_icon
1 out of 12
circle_padding
hide_on_mobile
zoom_out_icon
[object Object]