ACC00724 - Applying Accounting Concepts: Ratio Analysis Assignment
VerifiedAdded on 2023/06/16
|9
|1700
|186
Homework Assignment
AI Summary
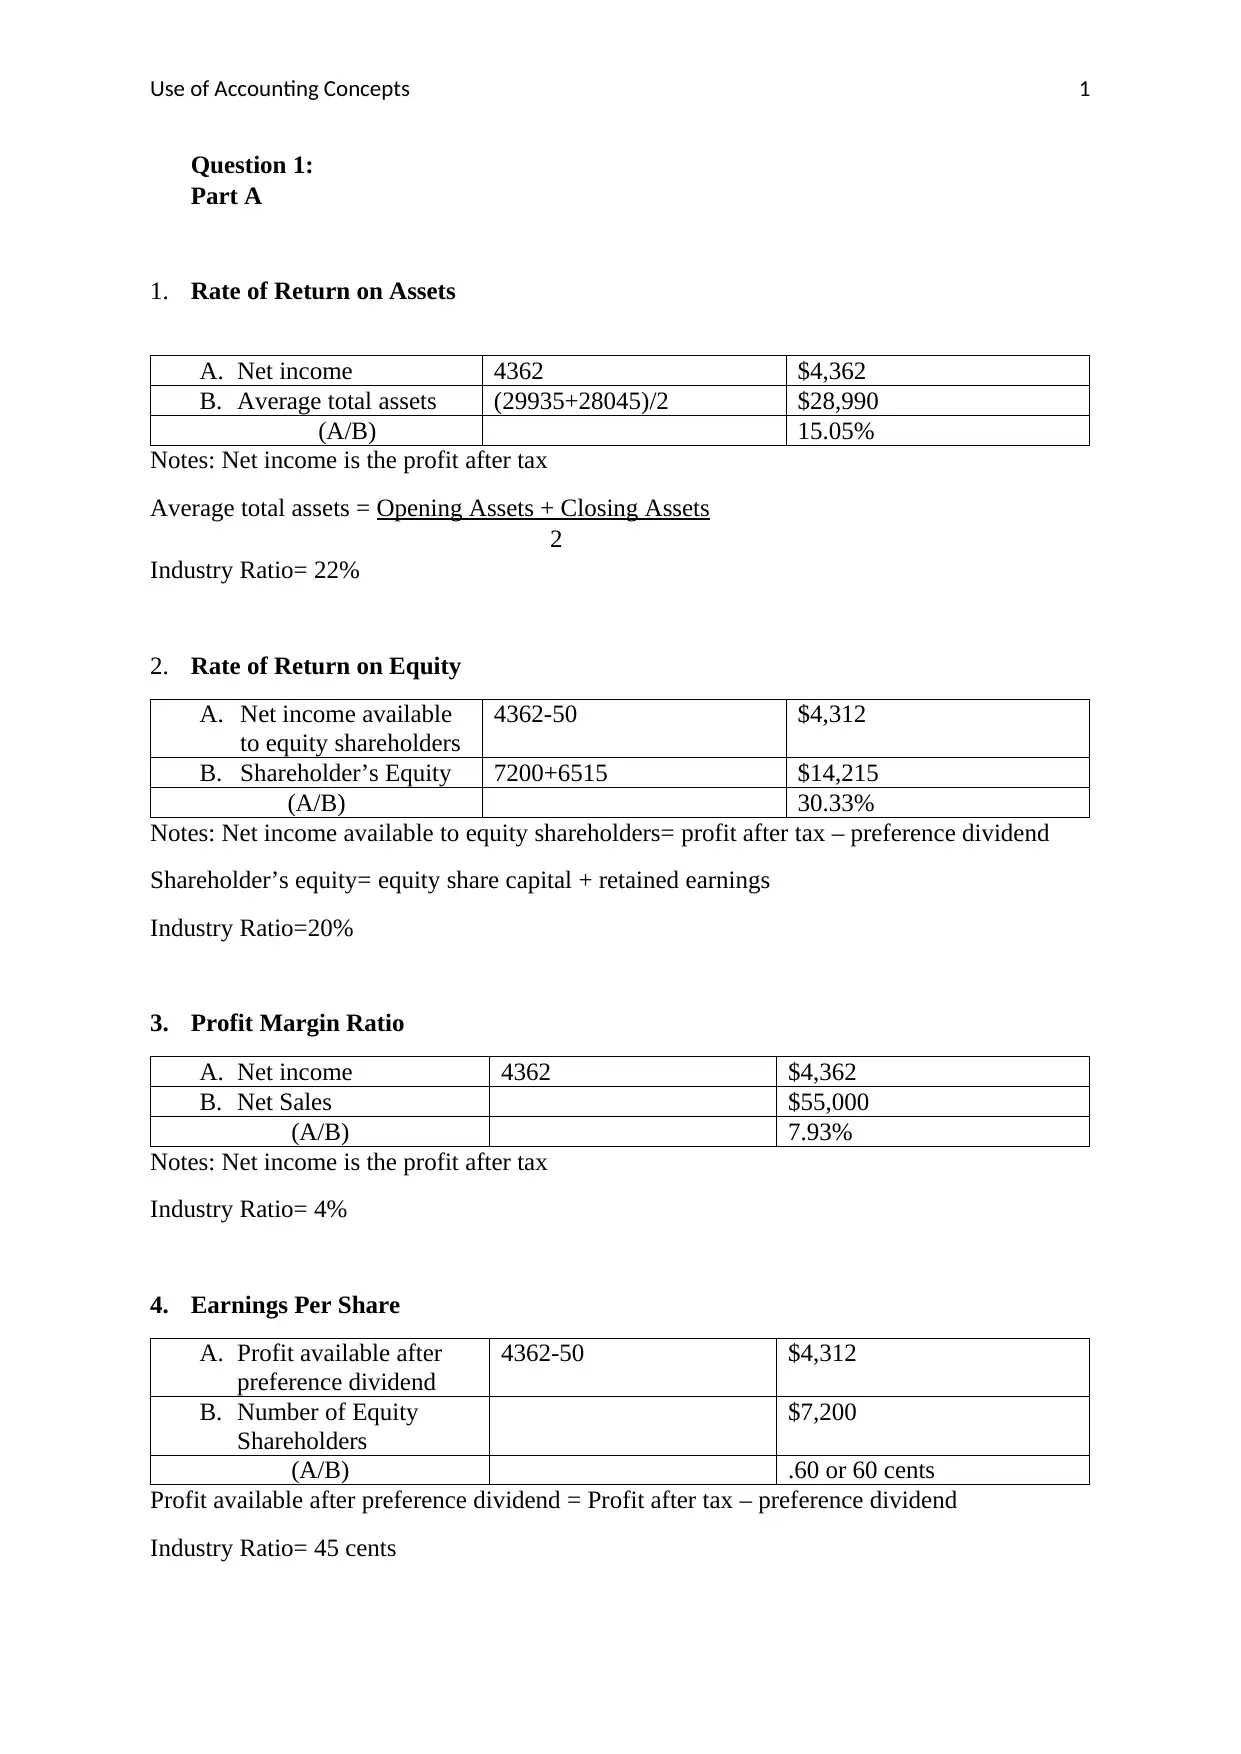
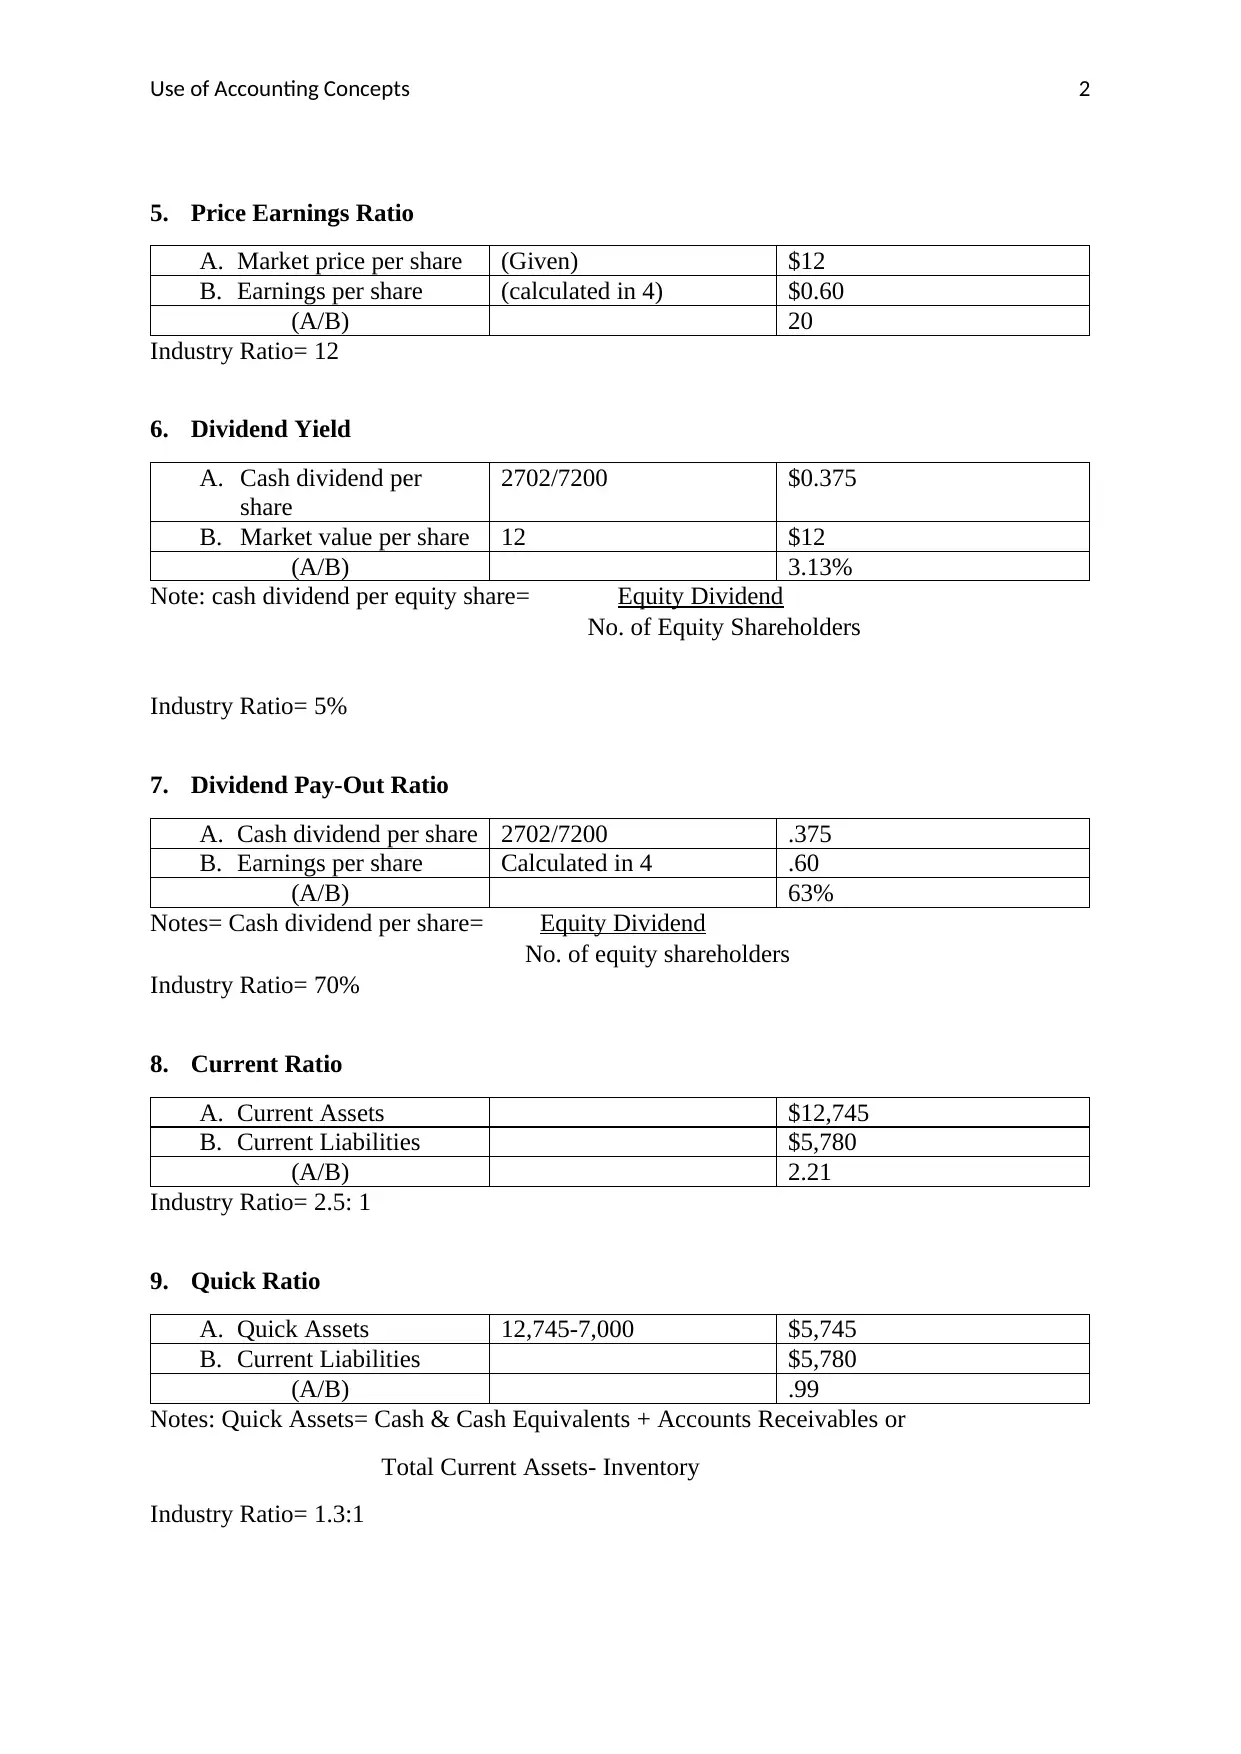
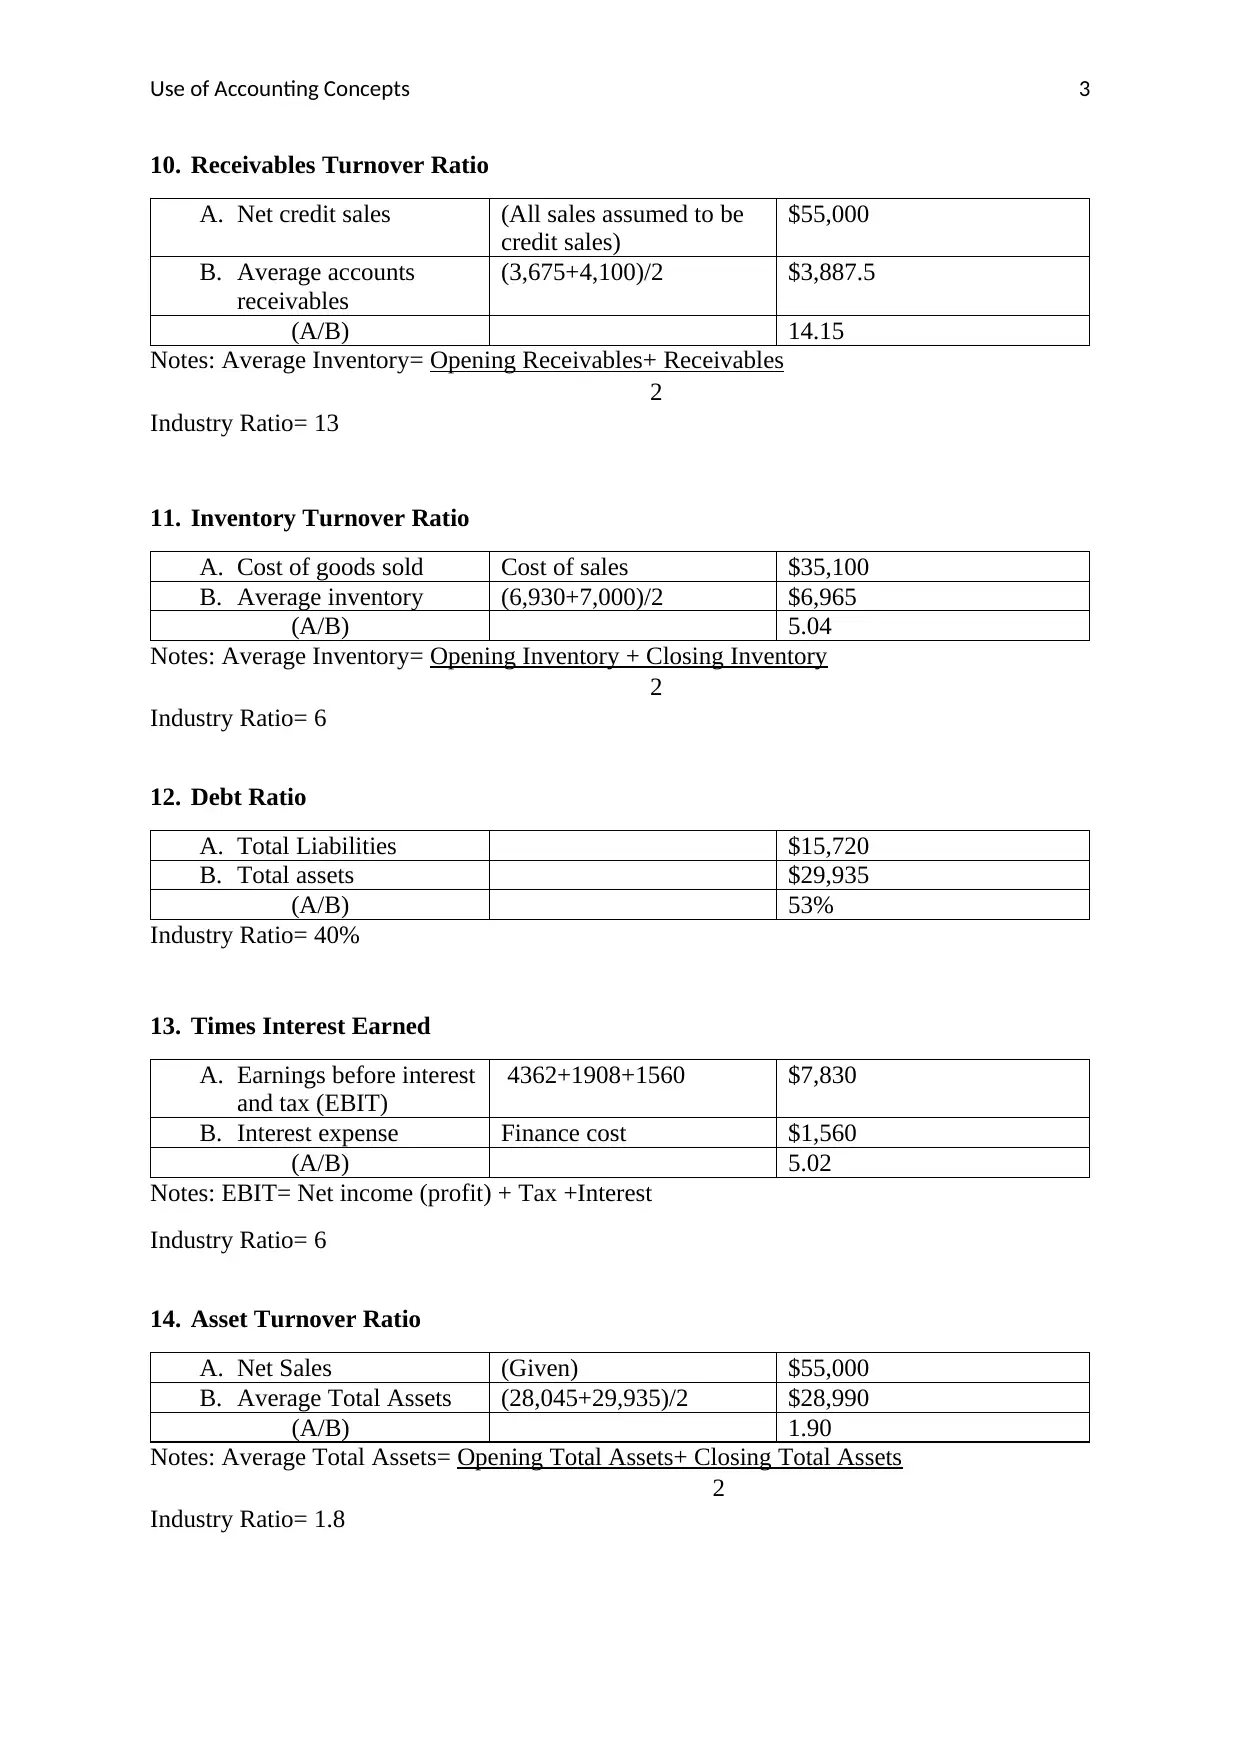
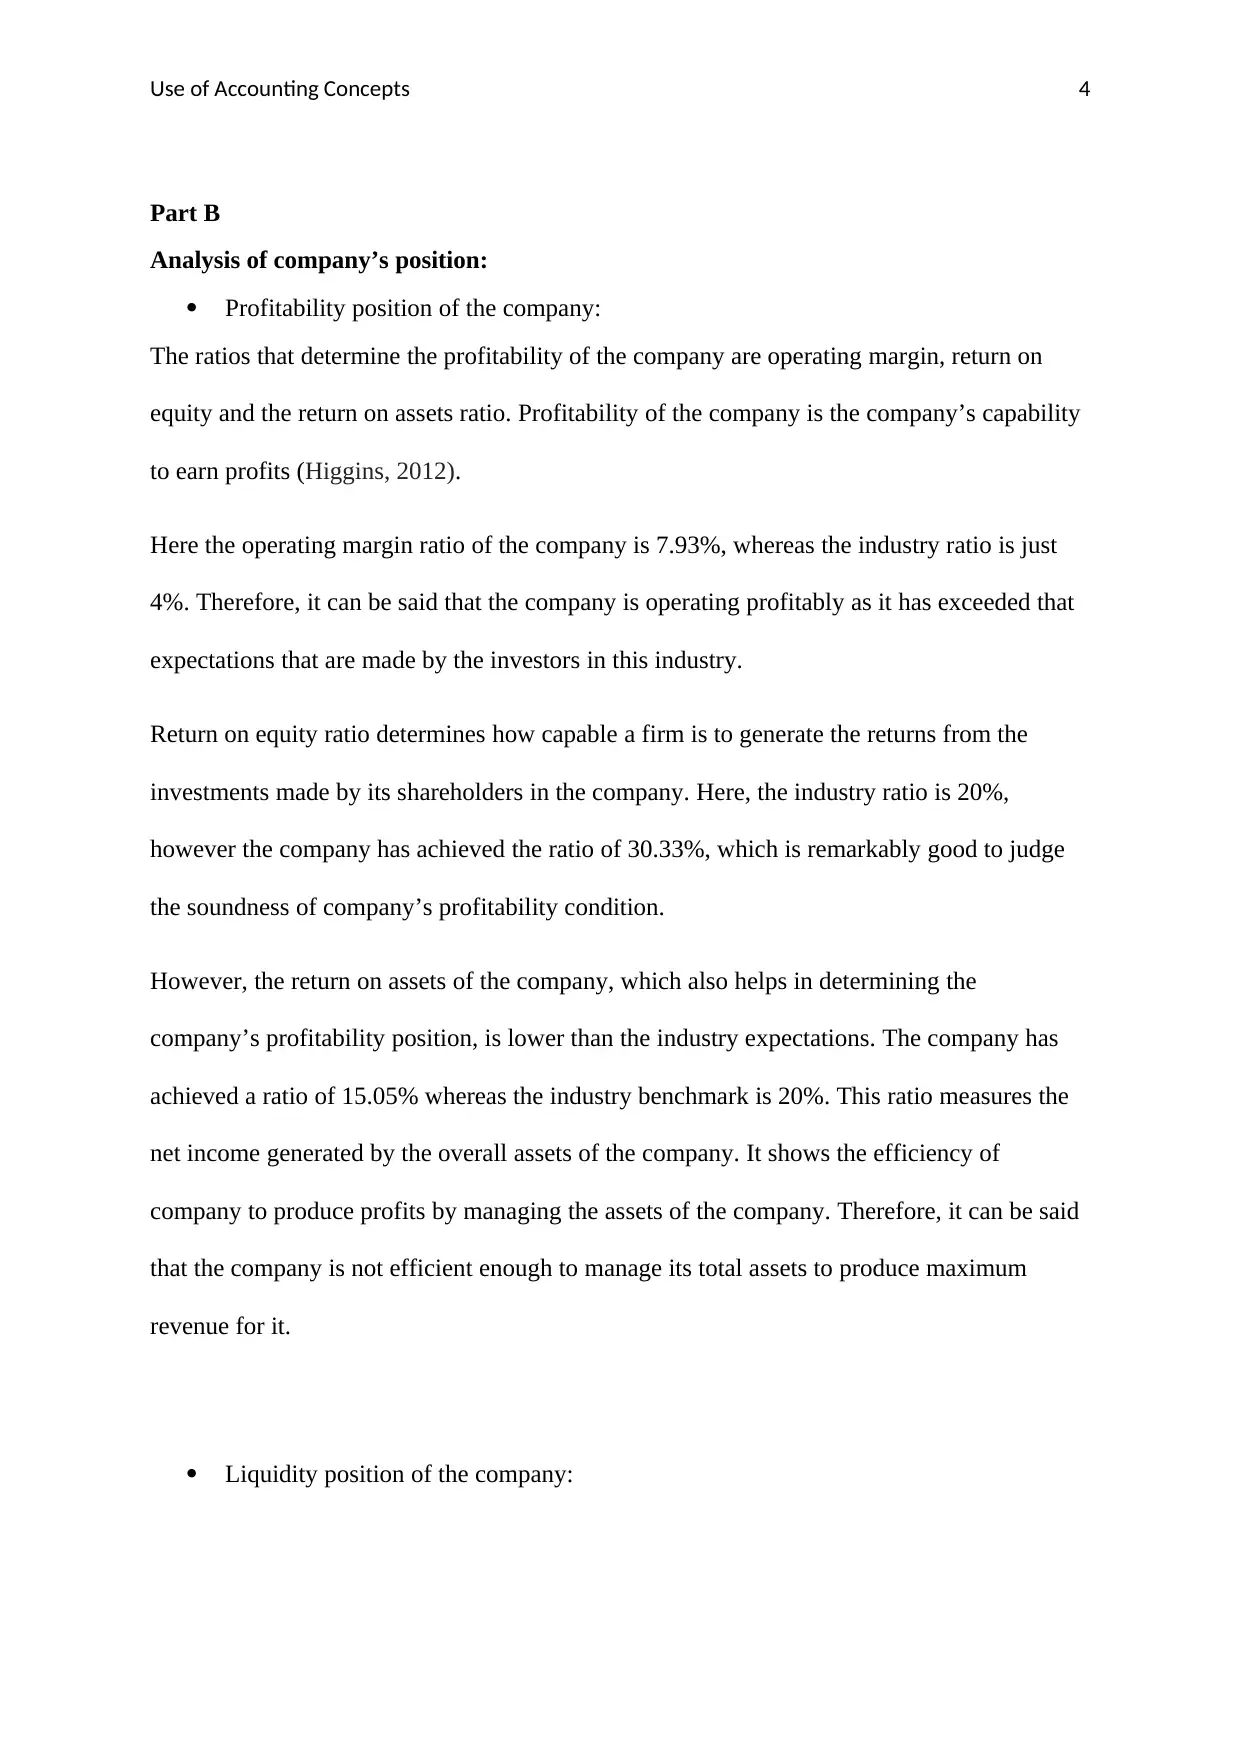
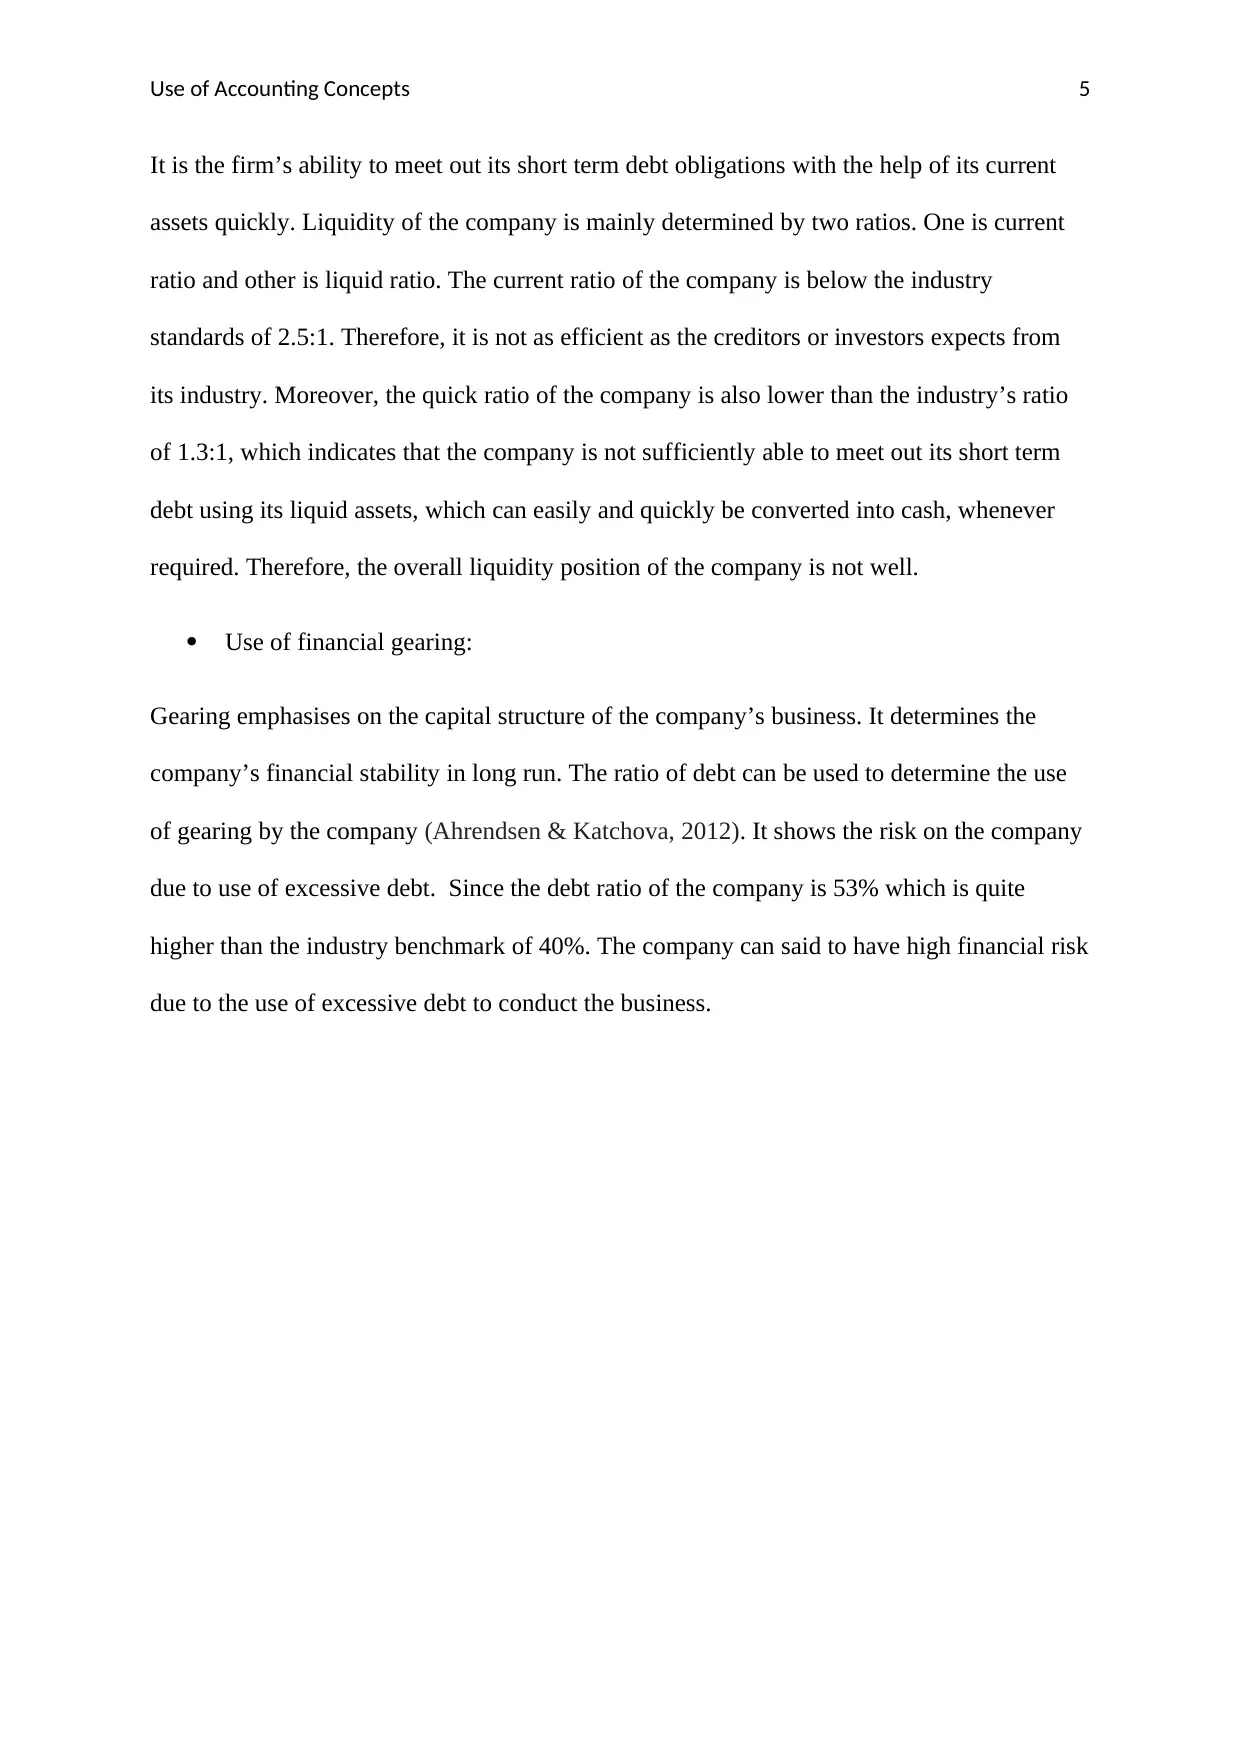
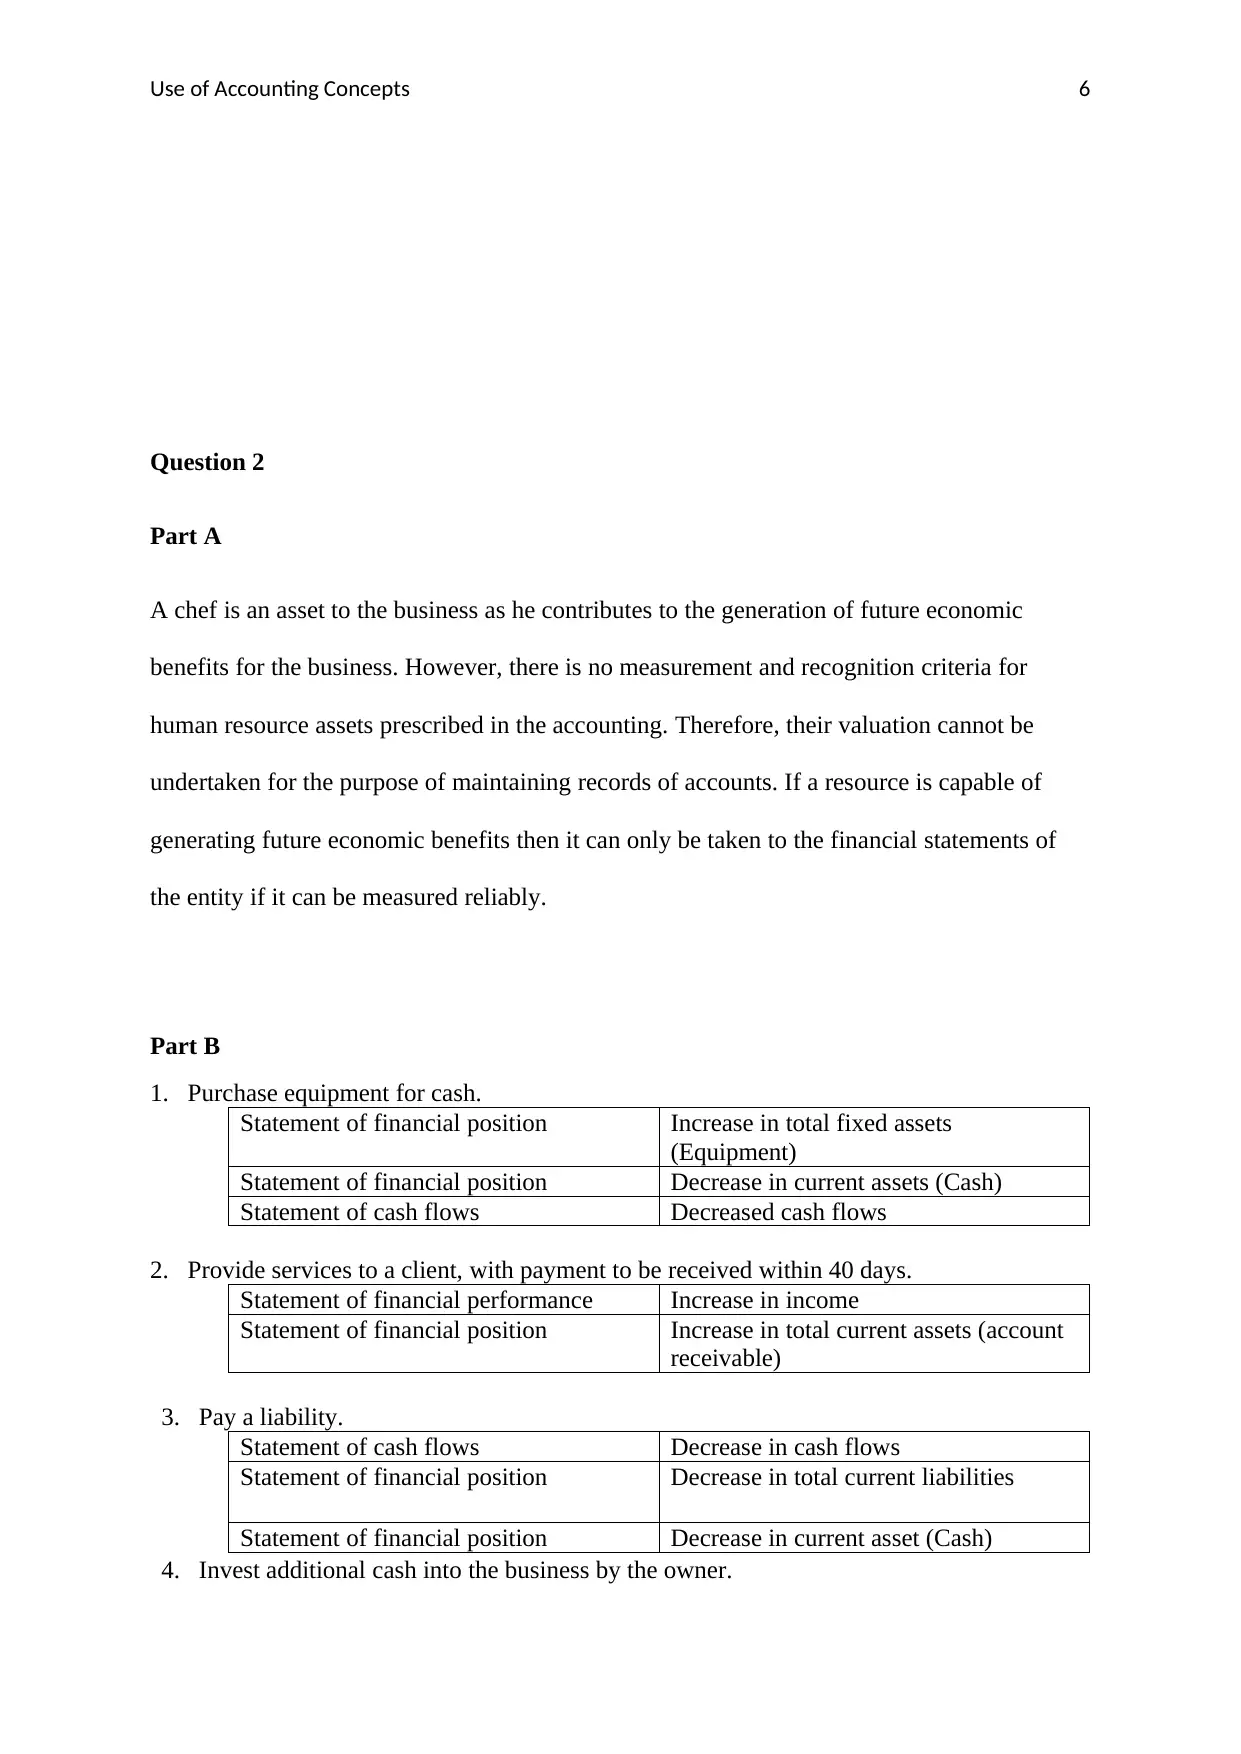
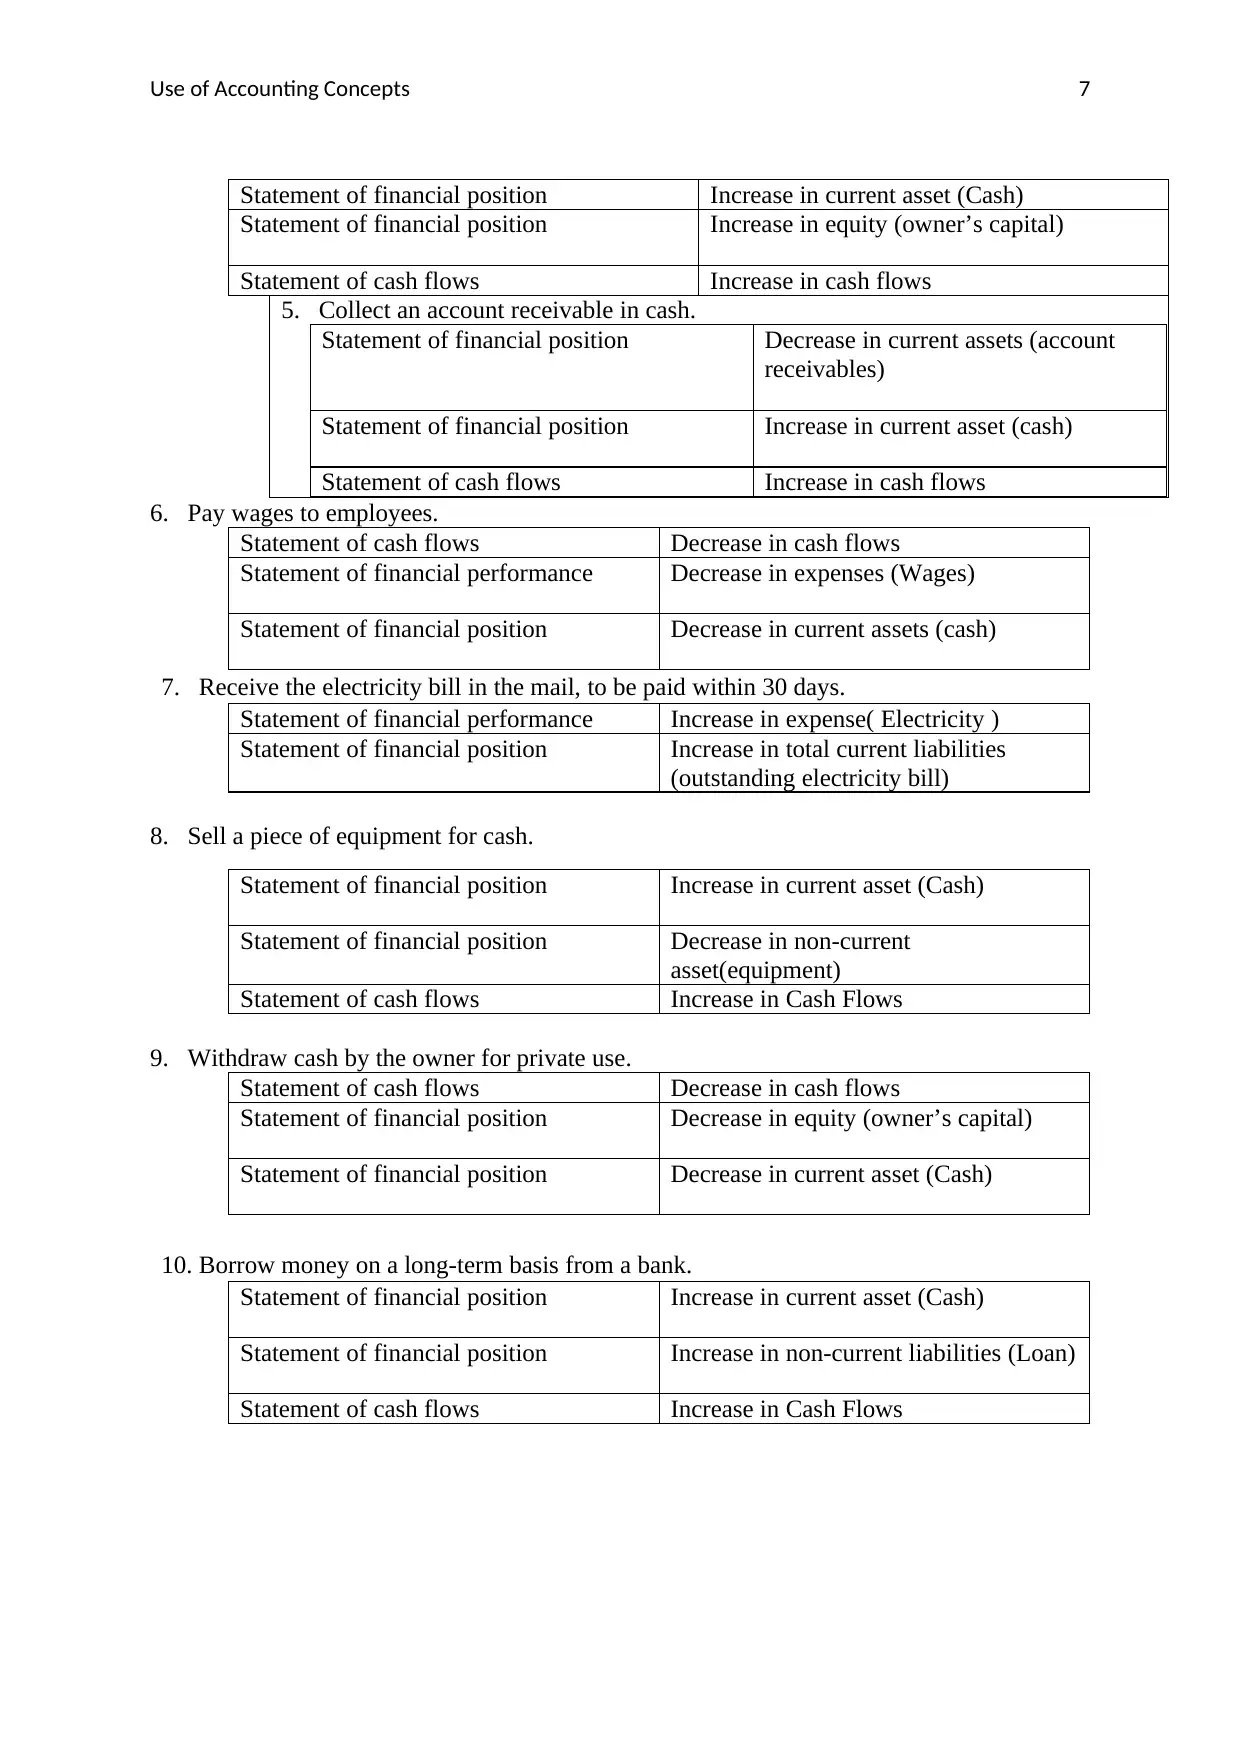
This assignment focuses on ratio analysis and the application of accounting concepts to assess a company's financial health. It includes a detailed analysis of various financial ratios such as Return on Assets, Return on Equity, Profit Margin Ratio, Earnings Per Share, Price Earnings Ratio, Dividend Yiel...
Read More
Contribute Materials
Your contribution can guide someone’s learning journey. Share your
documents today.

Ratio analysis: Use of Accounting Concepts
Accounting for Managers
Secure Best Marks with AI Grader
Need help grading? Try our AI Grader for instant feedback on your assignments.

Use of Accounting Concepts 1
Question 1:
Part A
1. Rate of Return on Assets
A. Net income 4362 $4,362
B. Average total assets (29935+28045)/2 $28,990
(A/B) 15.05%
Notes: Net income is the profit after tax
Average total assets = Opening Assets + Closing Assets
2
Industry Ratio= 22%
2. Rate of Return on Equity
A. Net income available
to equity shareholders
4362-50 $4,312
B. Shareholder’s Equity 7200+6515 $14,215
(A/B) 30.33%
Notes: Net income available to equity shareholders= profit after tax – preference dividend
Shareholder’s equity= equity share capital + retained earnings
Industry Ratio=20%
3. Profit Margin Ratio
A. Net income 4362 $4,362
B. Net Sales $55,000
(A/B) 7.93%
Notes: Net income is the profit after tax
Industry Ratio= 4%
4. Earnings Per Share
A. Profit available after
preference dividend
4362-50 $4,312
B. Number of Equity
Shareholders
$7,200
(A/B) .60 or 60 cents
Profit available after preference dividend = Profit after tax – preference dividend
Industry Ratio= 45 cents

Use of Accounting Concepts 2
5. Price Earnings Ratio
A. Market price per share (Given) $12
B. Earnings per share (calculated in 4) $0.60
(A/B) 20
Industry Ratio= 12
6. Dividend Yield
A. Cash dividend per
share
2702/7200 $0.375
B. Market value per share 12 $12
(A/B) 3.13%
Note: cash dividend per equity share= Equity Dividend
No. of Equity Shareholders
Industry Ratio= 5%
7. Dividend Pay-Out Ratio
A. Cash dividend per share 2702/7200 .375
B. Earnings per share Calculated in 4 .60
(A/B) 63%
Notes= Cash dividend per share= Equity Dividend
No. of equity shareholders
Industry Ratio= 70%
8. Current Ratio
A. Current Assets $12,745
B. Current Liabilities $5,780
(A/B) 2.21
Industry Ratio= 2.5: 1
9. Quick Ratio
A. Quick Assets 12,745-7,000 $5,745
B. Current Liabilities $5,780
(A/B) .99
Notes: Quick Assets= Cash & Cash Equivalents + Accounts Receivables or
Total Current Assets- Inventory
Industry Ratio= 1.3:1

Use of Accounting Concepts 3
10. Receivables Turnover Ratio
A. Net credit sales (All sales assumed to be
credit sales)
$55,000
B. Average accounts
receivables
(3,675+4,100)/2 $3,887.5
(A/B) 14.15
Notes: Average Inventory= Opening Receivables+ Receivables
2
Industry Ratio= 13
11. Inventory Turnover Ratio
A. Cost of goods sold Cost of sales $35,100
B. Average inventory (6,930+7,000)/2 $6,965
(A/B) 5.04
Notes: Average Inventory= Opening Inventory + Closing Inventory
2
Industry Ratio= 6
12. Debt Ratio
A. Total Liabilities $15,720
B. Total assets $29,935
(A/B) 53%
Industry Ratio= 40%
13. Times Interest Earned
A. Earnings before interest
and tax (EBIT)
4362+1908+1560 $7,830
B. Interest expense Finance cost $1,560
(A/B) 5.02
Notes: EBIT= Net income (profit) + Tax +Interest
Industry Ratio= 6
14. Asset Turnover Ratio
A. Net Sales (Given) $55,000
B. Average Total Assets (28,045+29,935)/2 $28,990
(A/B) 1.90
Notes: Average Total Assets= Opening Total Assets+ Closing Total Assets
2
Industry Ratio= 1.8
Secure Best Marks with AI Grader
Need help grading? Try our AI Grader for instant feedback on your assignments.

Use of Accounting Concepts 4
Part B
Analysis of company’s position:
Profitability position of the company:
The ratios that determine the profitability of the company are operating margin, return on
equity and the return on assets ratio. Profitability of the company is the company’s capability
to earn profits (Higgins, 2012).
Here the operating margin ratio of the company is 7.93%, whereas the industry ratio is just
4%. Therefore, it can be said that the company is operating profitably as it has exceeded that
expectations that are made by the investors in this industry.
Return on equity ratio determines how capable a firm is to generate the returns from the
investments made by its shareholders in the company. Here, the industry ratio is 20%,
however the company has achieved the ratio of 30.33%, which is remarkably good to judge
the soundness of company’s profitability condition.
However, the return on assets of the company, which also helps in determining the
company’s profitability position, is lower than the industry expectations. The company has
achieved a ratio of 15.05% whereas the industry benchmark is 20%. This ratio measures the
net income generated by the overall assets of the company. It shows the efficiency of
company to produce profits by managing the assets of the company. Therefore, it can be said
that the company is not efficient enough to manage its total assets to produce maximum
revenue for it.
Liquidity position of the company:

Use of Accounting Concepts 5
It is the firm’s ability to meet out its short term debt obligations with the help of its current
assets quickly. Liquidity of the company is mainly determined by two ratios. One is current
ratio and other is liquid ratio. The current ratio of the company is below the industry
standards of 2.5:1. Therefore, it is not as efficient as the creditors or investors expects from
its industry. Moreover, the quick ratio of the company is also lower than the industry’s ratio
of 1.3:1, which indicates that the company is not sufficiently able to meet out its short term
debt using its liquid assets, which can easily and quickly be converted into cash, whenever
required. Therefore, the overall liquidity position of the company is not well.
Use of financial gearing:
Gearing emphasises on the capital structure of the company’s business. It determines the
company’s financial stability in long run. The ratio of debt can be used to determine the use
of gearing by the company (Ahrendsen & Katchova, 2012). It shows the risk on the company
due to use of excessive debt. Since the debt ratio of the company is 53% which is quite
higher than the industry benchmark of 40%. The company can said to have high financial risk
due to the use of excessive debt to conduct the business.

Use of Accounting Concepts 6
Question 2
Part A
A chef is an asset to the business as he contributes to the generation of future economic
benefits for the business. However, there is no measurement and recognition criteria for
human resource assets prescribed in the accounting. Therefore, their valuation cannot be
undertaken for the purpose of maintaining records of accounts. If a resource is capable of
generating future economic benefits then it can only be taken to the financial statements of
the entity if it can be measured reliably.
Part B
1. Purchase equipment for cash.
Statement of financial position Increase in total fixed assets
(Equipment)
Statement of financial position Decrease in current assets (Cash)
Statement of cash flows Decreased cash flows
2. Provide services to a client, with payment to be received within 40 days.
Statement of financial performance Increase in income
Statement of financial position Increase in total current assets (account
receivable)
3. Pay a liability.
Statement of cash flows Decrease in cash flows
Statement of financial position Decrease in total current liabilities
Statement of financial position Decrease in current asset (Cash)
4. Invest additional cash into the business by the owner.
Paraphrase This Document
Need a fresh take? Get an instant paraphrase of this document with our AI Paraphraser

Use of Accounting Concepts 7
Statement of financial position Increase in current asset (Cash)
Statement of financial position Increase in equity (owner’s capital)
Statement of cash flows Increase in cash flows
5. Collect an account receivable in cash.
Statement of financial position Decrease in current assets (account
receivables)
Statement of financial position Increase in current asset (cash)
Statement of cash flows Increase in cash flows
6. Pay wages to employees.
Statement of cash flows Decrease in cash flows
Statement of financial performance Decrease in expenses (Wages)
Statement of financial position Decrease in current assets (cash)
7. Receive the electricity bill in the mail, to be paid within 30 days.
Statement of financial performance Increase in expense( Electricity )
Statement of financial position Increase in total current liabilities
(outstanding electricity bill)
8. Sell a piece of equipment for cash.
Statement of financial position Increase in current asset (Cash)
Statement of financial position Decrease in non-current
asset(equipment)
Statement of cash flows Increase in Cash Flows
9. Withdraw cash by the owner for private use.
Statement of cash flows Decrease in cash flows
Statement of financial position Decrease in equity (owner’s capital)
Statement of financial position Decrease in current asset (Cash)
10. Borrow money on a long-term basis from a bank.
Statement of financial position Increase in current asset (Cash)
Statement of financial position Increase in non-current liabilities (Loan)
Statement of cash flows Increase in Cash Flows
Statement of financial position Increase in current asset (Cash)
Statement of financial position Increase in equity (owner’s capital)
Statement of cash flows Increase in cash flows
5. Collect an account receivable in cash.
Statement of financial position Decrease in current assets (account
receivables)
Statement of financial position Increase in current asset (cash)
Statement of cash flows Increase in cash flows
6. Pay wages to employees.
Statement of cash flows Decrease in cash flows
Statement of financial performance Decrease in expenses (Wages)
Statement of financial position Decrease in current assets (cash)
7. Receive the electricity bill in the mail, to be paid within 30 days.
Statement of financial performance Increase in expense( Electricity )
Statement of financial position Increase in total current liabilities
(outstanding electricity bill)
8. Sell a piece of equipment for cash.
Statement of financial position Increase in current asset (Cash)
Statement of financial position Decrease in non-current
asset(equipment)
Statement of cash flows Increase in Cash Flows
9. Withdraw cash by the owner for private use.
Statement of cash flows Decrease in cash flows
Statement of financial position Decrease in equity (owner’s capital)
Statement of financial position Decrease in current asset (Cash)
10. Borrow money on a long-term basis from a bank.
Statement of financial position Increase in current asset (Cash)
Statement of financial position Increase in non-current liabilities (Loan)
Statement of cash flows Increase in Cash Flows

Use of Accounting Concepts 8
References:
Ahrendsen, B.L. and Katchova, A.L., 2012. Financial ratio analysis using ARMS
data. Agricultural Finance Review, 72(2), pp.262-272.
Higgins, R.C., 2012. Analysis for financial management. McGraw-Hill/Irwin.
References:
Ahrendsen, B.L. and Katchova, A.L., 2012. Financial ratio analysis using ARMS
data. Agricultural Finance Review, 72(2), pp.262-272.
Higgins, R.C., 2012. Analysis for financial management. McGraw-Hill/Irwin.
1 out of 9
Related Documents

Your All-in-One AI-Powered Toolkit for Academic Success.
+13062052269
info@desklib.com
Available 24*7 on WhatsApp / Email
Unlock your academic potential
© 2024 | Zucol Services PVT LTD | All rights reserved.