Analyzing Financial Health: Ratio Analysis of ANZ & Commonwealth
VerifiedAdded on 2021/06/15
|20
|4434
|60
Report
AI Summary
This report analyzes the financial statements of The Australia and New Zealand Banking Group Limited (ANZ) and Commonwealth Bank of Australia using ratio analysis. It assesses their long-term solvency, short-term solvency (liquidity), asset utilization, profitability, and market value. For ANZ, the debt-to-equity ratio indicates a high debt component, while the interest coverage ratio suggests no issues in paying interest expenses. Liquidity ratios are low, which could be a concern. Asset turnover is constant, and return on assets has increased. Profitability ratios show a significant increase in net margin. Market value ratios show an increase in earnings per share, but a low dividend yield. For Commonwealth Bank, both current and quick ratios have improved slightly. A low debt equity ratio is preferred. The report concludes with a comparison of the ratios between the two banks, providing insights into their relative financial positions. Desklib offers similar solved assignments and past papers for students.

Ratio analysis
1
1
Paraphrase This Document
Need a fresh take? Get an instant paraphrase of this document with our AI Paraphraser
Contents
Introduction......................................................................................................................................3
The Australia and New Zealand Banking Group Limited...............................................................4
Long term solvency.....................................................................................................................4
Short term solvency (Liquidity ratio)..........................................................................................4
Asset utilization ratio...................................................................................................................5
Profitability ratio..........................................................................................................................6
Market value ratios......................................................................................................................7
Commonwealth Bank of Australia..................................................................................................8
Short term solvency (Liquidity ratios).........................................................................................8
Long term solvency ratio (Financial leverage ratio)..................................................................10
Asset utilization ratio.................................................................................................................12
Profitability ratio........................................................................................................................14
Market value ratios-...................................................................................................................15
Comparison between ratios of two banking companies................................................................16
Conclusion.....................................................................................................................................18
References......................................................................................................................................19
2
Introduction
Main objective of this report is to analyze financial statement of two companies with the help of
ratio analysis. Ratio analysis helps in giving a sense of understandability to the financial
information provided in financial statements of a company (David, 2011). Analysis of financial
statement is one of the very important function that can help in determining actual progress of
company as comparison can be made with its past year performances and other companies
working in similar industry (). This ratio analysis and comparison with other organization helps
in making plans related to business finance, operation and other strategic business areas. The role
of financial statement analysis increases where the level of competition among various
companies is very high. In such scenarios, a company can gain competitive advantage over other
companies with the help of financial statement analysis (Wheelen et.al, 2017). Here ratio
analysis has been used to analyze financial position of two major banking sector companies in
Australia that are Commonwealth Bank of Australia and The Australia and New Zealand
Banking Group Limited. Ratio analysis has been done in two parts. Firstly each of the two
companies are analyzed on individual basis and then comparison has been made between ratios
of these companies.
3
⊘ This is a preview!⊘
Do you want full access?
Subscribe today to unlock all pages.
Trusted by 1+ million students worldwide
The Australia and New Zealand Banking Group Limited
The Australia and New Zealand Banking Group Limited
This analysis has been sub categories into four subjective analysis of company that are
profitability, efficiency, liquidity and market analysis.
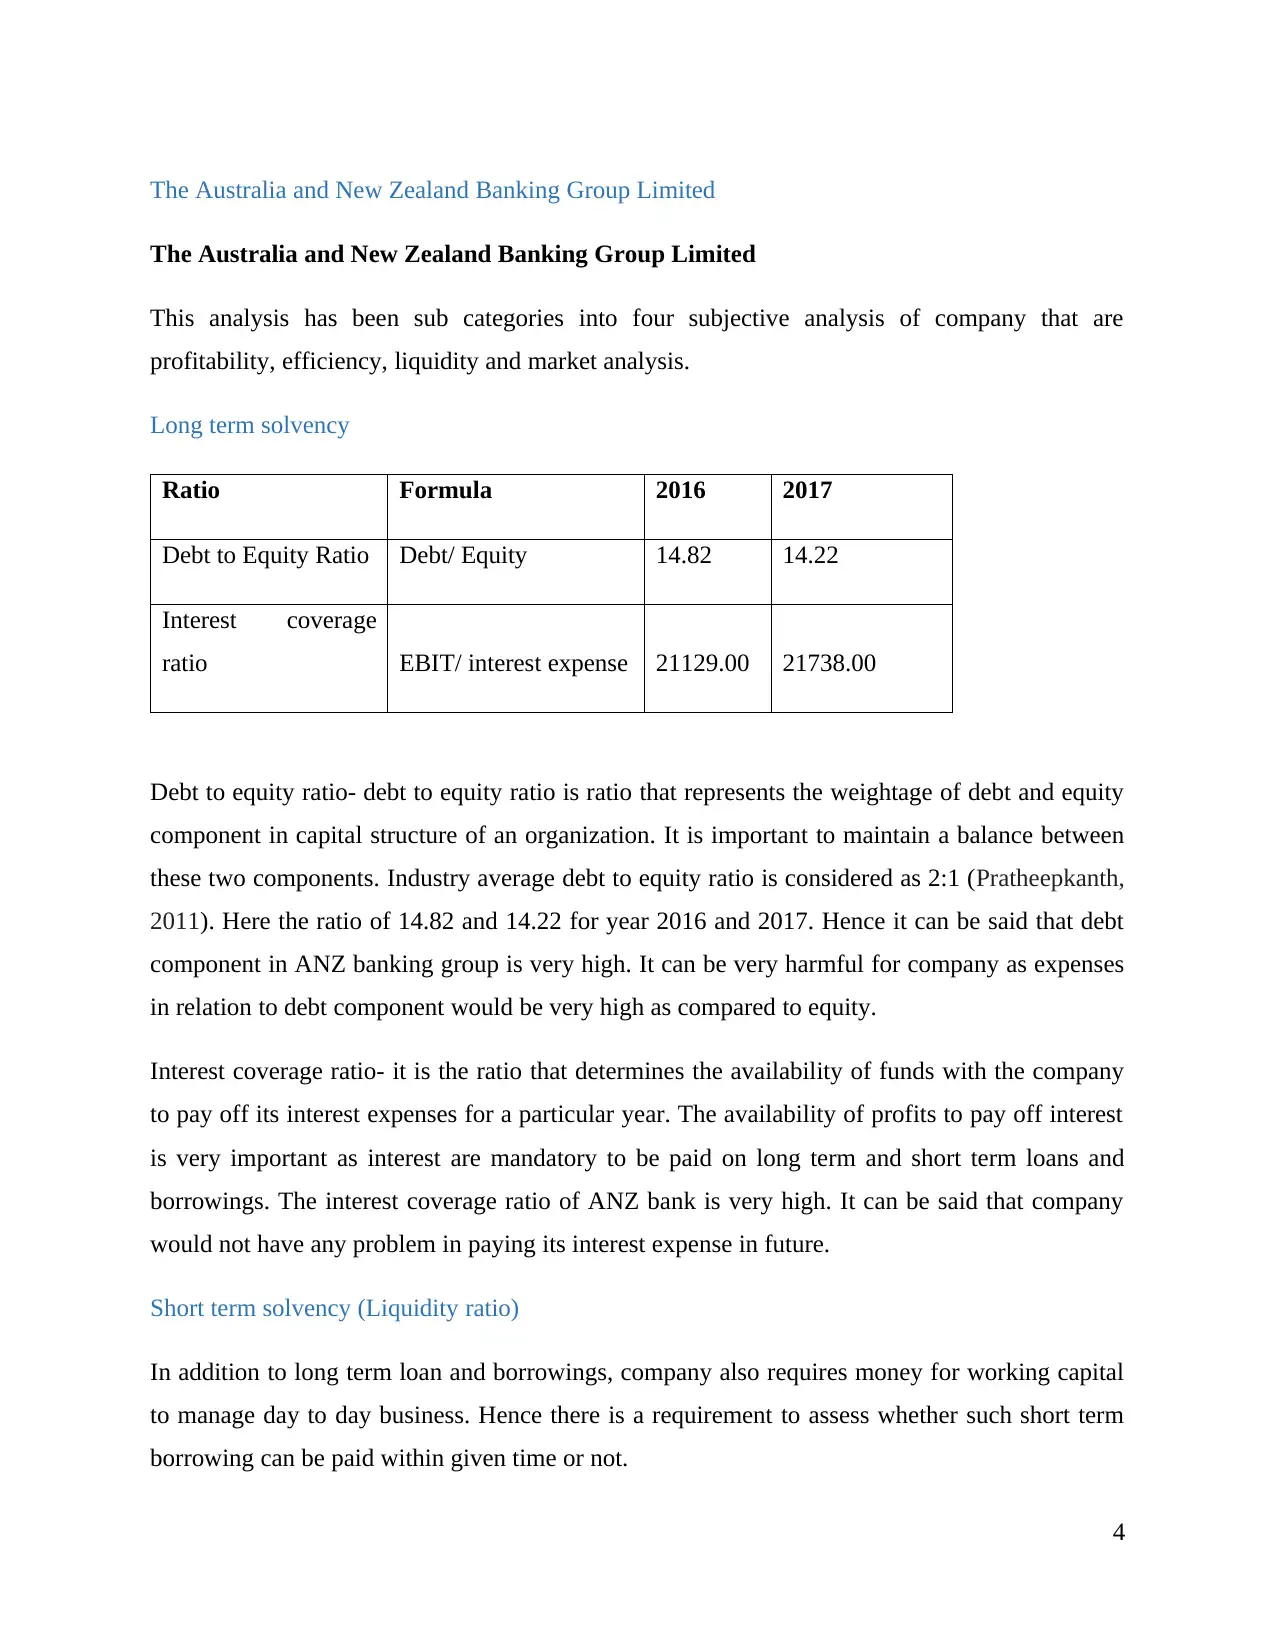
Long term solvency
Ratio Formula 2016 2017
Debt to Equity Ratio Debt/ Equity 14.82 14.22
Interest coverage
ratio EBIT/ interest expense 21129.00 21738.00
Debt to equity ratio- debt to equity ratio is ratio that represents the weightage of debt and equity
component in capital structure of an organization. It is important to maintain a balance between
these two components. Industry average debt to equity ratio is considered as 2:1 (Pratheepkanth,
2011). Here the ratio of 14.82 and 14.22 for year 2016 and 2017. Hence it can be said that debt
component in ANZ banking group is very high. It can be very harmful for company as expenses
in relation to debt component would be very high as compared to equity.
Interest coverage ratio- it is the ratio that determines the availability of funds with the company
to pay off its interest expenses for a particular year. The availability of profits to pay off interest
is very important as interest are mandatory to be paid on long term and short term loans and
borrowings. The interest coverage ratio of ANZ bank is very high. It can be said that company
would not have any problem in paying its interest expense in future.
Short term solvency (Liquidity ratio)
In addition to long term loan and borrowings, company also requires money for working capital
to manage day to day business. Hence there is a requirement to assess whether such short term
borrowing can be paid within given time or not.
4
The Australia and New Zealand Banking Group Limited
This analysis has been sub categories into four subjective analysis of company that are
profitability, efficiency, liquidity and market analysis.
Long term solvency
Ratio Formula 2016 2017
Debt to Equity Ratio Debt/ Equity 14.82 14.22
Interest coverage
ratio EBIT/ interest expense 21129.00 21738.00
Debt to equity ratio- debt to equity ratio is ratio that represents the weightage of debt and equity
component in capital structure of an organization. It is important to maintain a balance between
these two components. Industry average debt to equity ratio is considered as 2:1 (Pratheepkanth,
2011). Here the ratio of 14.82 and 14.22 for year 2016 and 2017. Hence it can be said that debt
component in ANZ banking group is very high. It can be very harmful for company as expenses
in relation to debt component would be very high as compared to equity.
Interest coverage ratio- it is the ratio that determines the availability of funds with the company
to pay off its interest expenses for a particular year. The availability of profits to pay off interest
is very important as interest are mandatory to be paid on long term and short term loans and
borrowings. The interest coverage ratio of ANZ bank is very high. It can be said that company
would not have any problem in paying its interest expense in future.
Short term solvency (Liquidity ratio)
In addition to long term loan and borrowings, company also requires money for working capital
to manage day to day business. Hence there is a requirement to assess whether such short term
borrowing can be paid within given time or not.
4
Paraphrase This Document
Need a fresh take? Get an instant paraphrase of this document with our AI Paraphraser
Ratio Formula 2016 2017
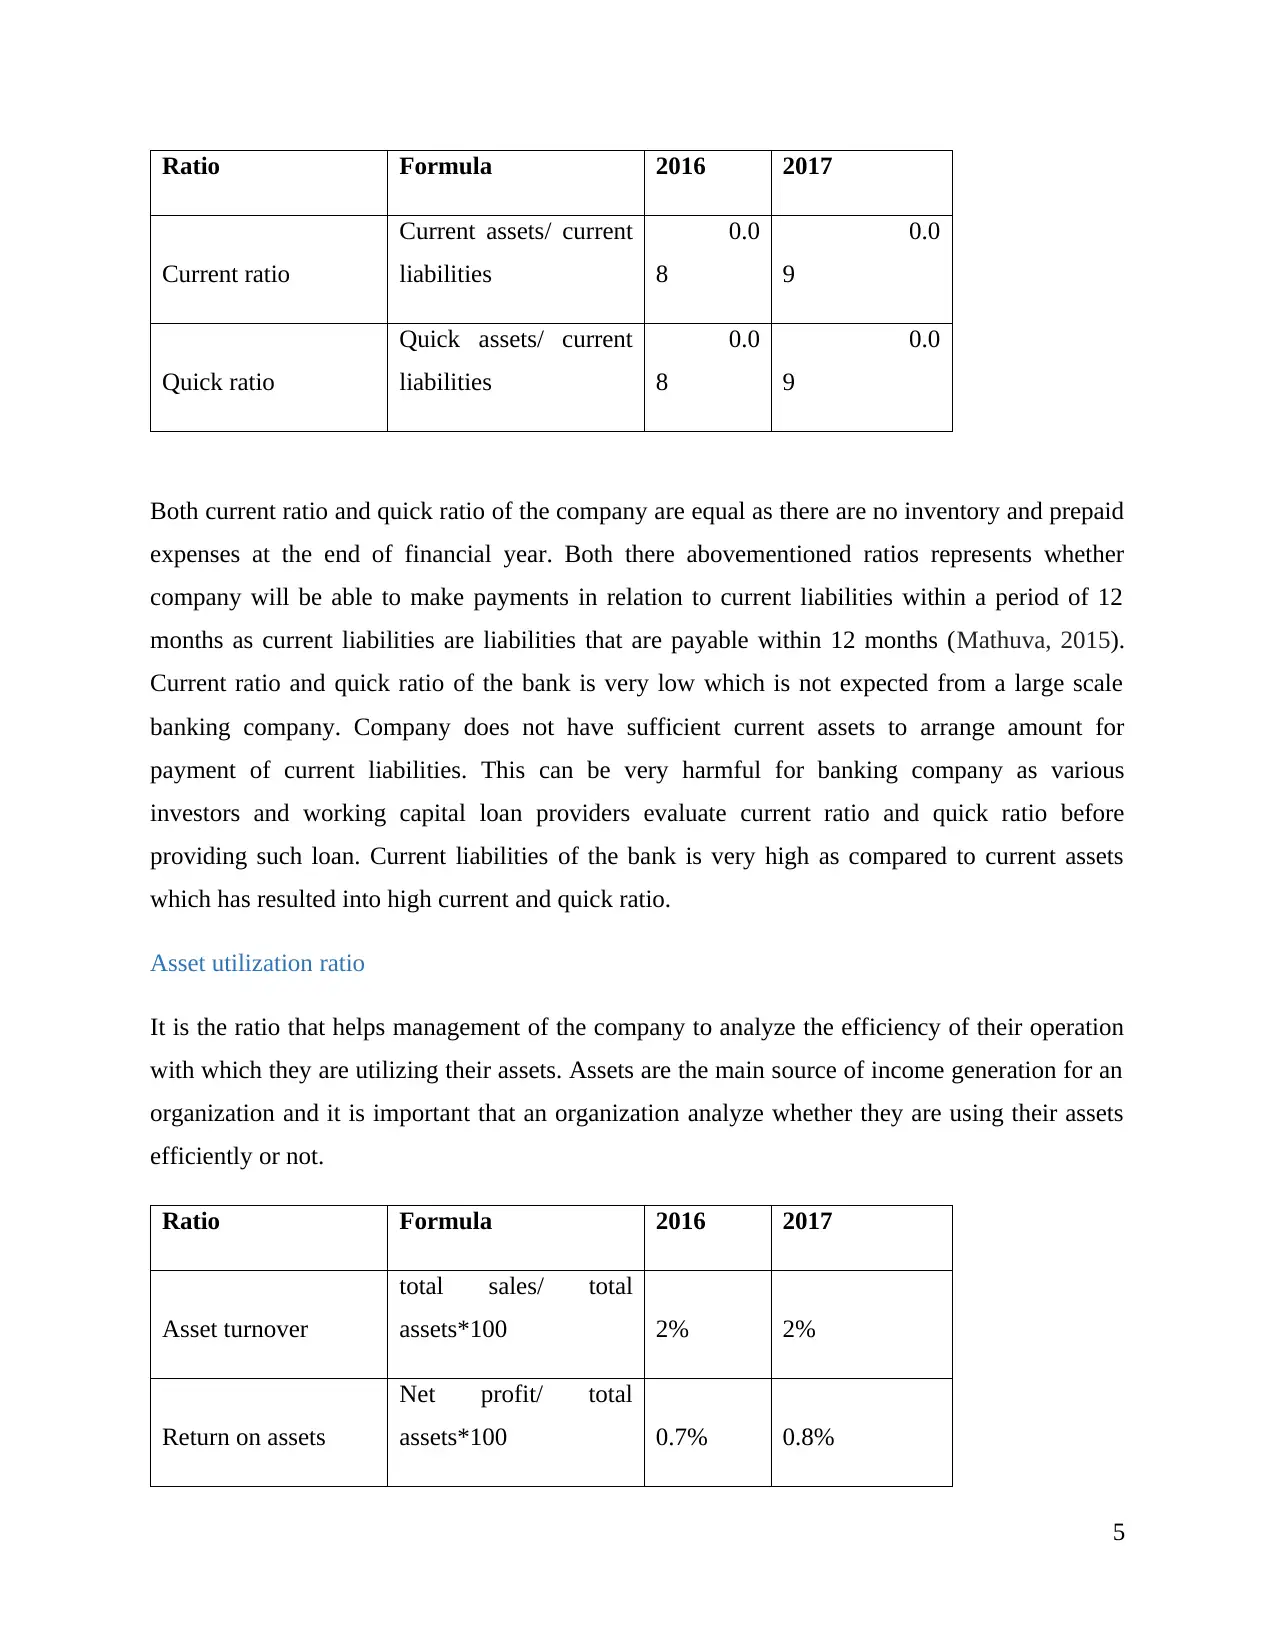
Current ratio
Current assets/ current
liabilities
0.0
8
0.0
9
Quick ratio
Quick assets/ current
liabilities
0.0
8
0.0
9
Both current ratio and quick ratio of the company are equal as there are no inventory and prepaid
expenses at the end of financial year. Both there abovementioned ratios represents whether
company will be able to make payments in relation to current liabilities within a period of 12
months as current liabilities are liabilities that are payable within 12 months (Mathuva, 2015).
Current ratio and quick ratio of the bank is very low which is not expected from a large scale
banking company. Company does not have sufficient current assets to arrange amount for
payment of current liabilities. This can be very harmful for banking company as various
investors and working capital loan providers evaluate current ratio and quick ratio before
providing such loan. Current liabilities of the bank is very high as compared to current assets
which has resulted into high current and quick ratio.
Asset utilization ratio
It is the ratio that helps management of the company to analyze the efficiency of their operation
with which they are utilizing their assets. Assets are the main source of income generation for an
organization and it is important that an organization analyze whether they are using their assets
efficiently or not.
Ratio Formula 2016 2017
Asset turnover
total sales/ total
assets*100 2% 2%
Return on assets
Net profit/ total
assets*100 0.7% 0.8%
5
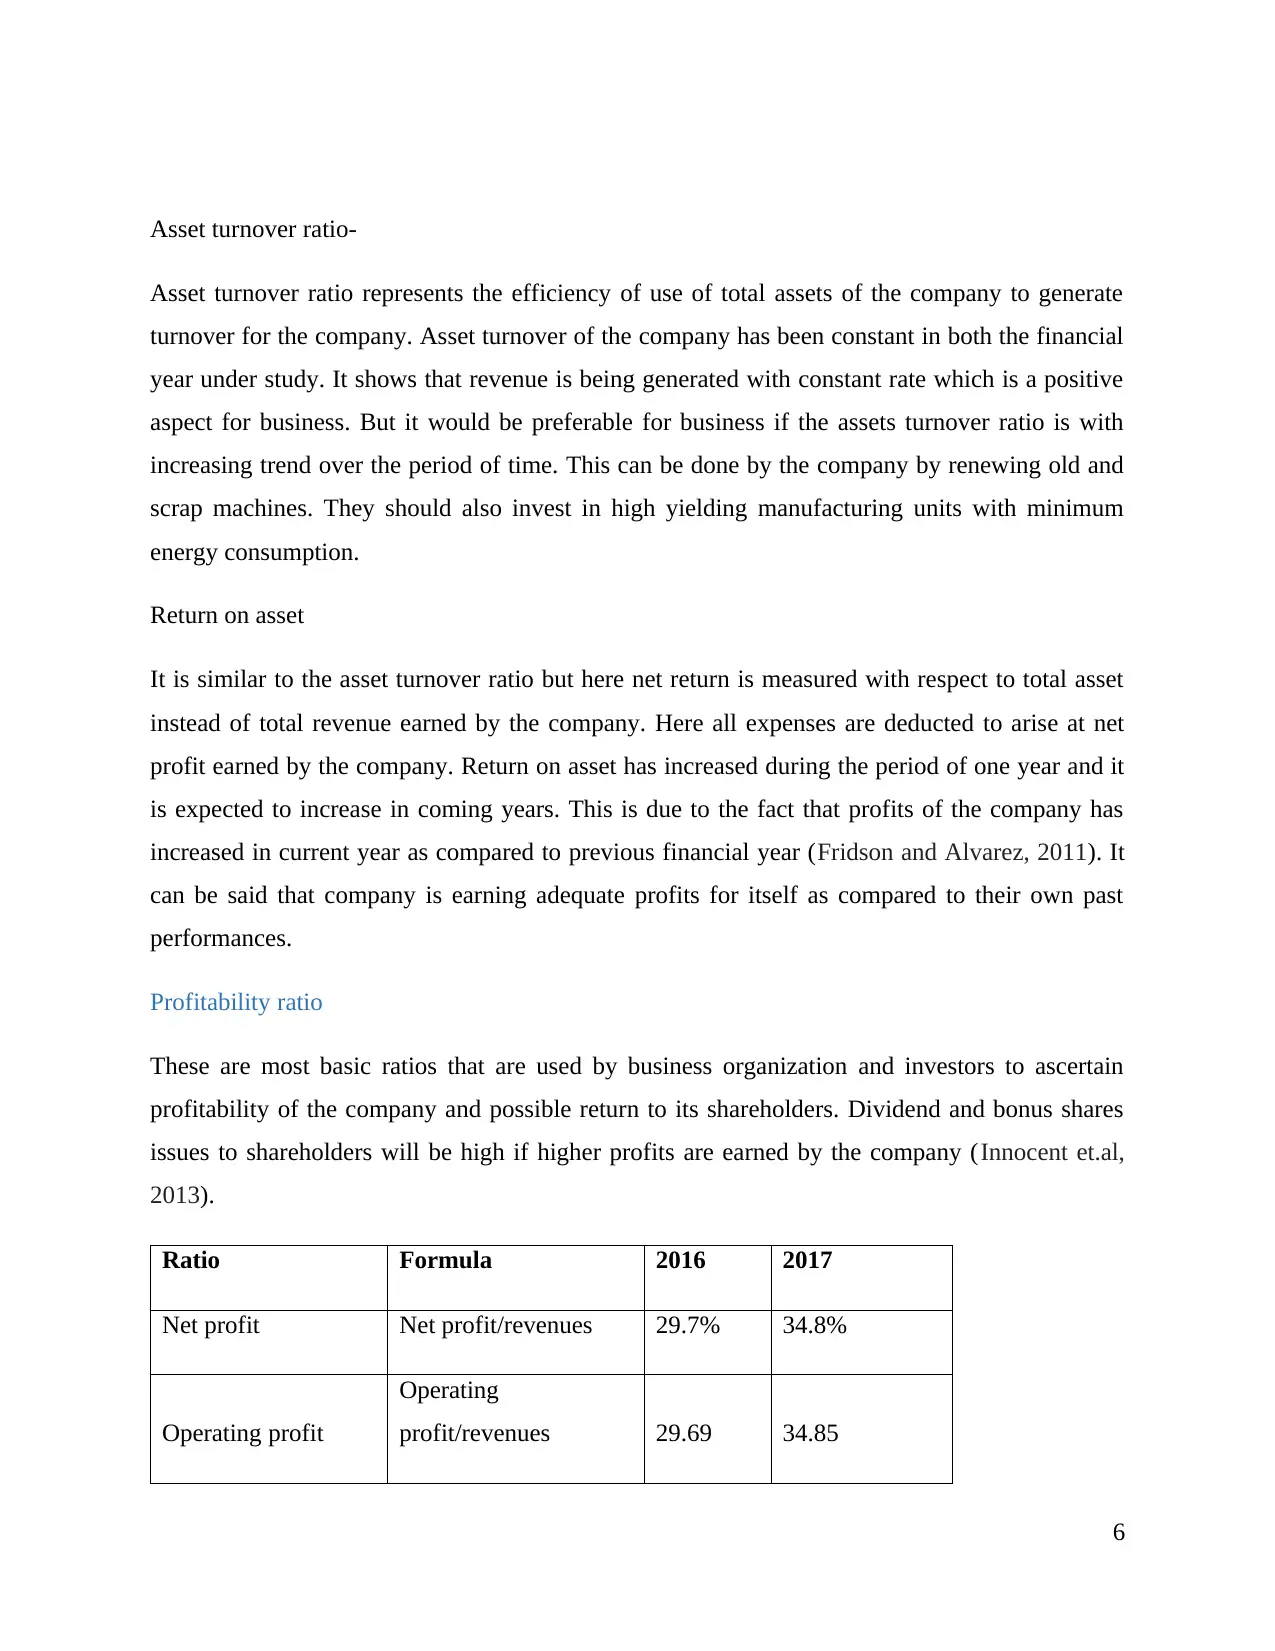
Asset turnover ratio-
Asset turnover ratio represents the efficiency of use of total assets of the company to generate
turnover for the company. Asset turnover of the company has been constant in both the financial
year under study. It shows that revenue is being generated with constant rate which is a positive
aspect for business. But it would be preferable for business if the assets turnover ratio is with
increasing trend over the period of time. This can be done by the company by renewing old and
scrap machines. They should also invest in high yielding manufacturing units with minimum
energy consumption.
Return on asset
It is similar to the asset turnover ratio but here net return is measured with respect to total asset
instead of total revenue earned by the company. Here all expenses are deducted to arise at net
profit earned by the company. Return on asset has increased during the period of one year and it
is expected to increase in coming years. This is due to the fact that profits of the company has
increased in current year as compared to previous financial year (Fridson and Alvarez, 2011). It
can be said that company is earning adequate profits for itself as compared to their own past
performances.
Profitability ratio
These are most basic ratios that are used by business organization and investors to ascertain
profitability of the company and possible return to its shareholders. Dividend and bonus shares
issues to shareholders will be high if higher profits are earned by the company (Innocent et.al,
2013).
Ratio Formula 2016 2017
Net profit Net profit/revenues 29.7% 34.8%
Operating profit
Operating
profit/revenues 29.69 34.85
6
⊘ This is a preview!⊘
Do you want full access?
Subscribe today to unlock all pages.
Trusted by 1+ million students worldwide
Operating profit is equal to net profit earned as a company working is banking sector does not
have major expenses and all expenses in such companies are indirect expenses. The net margin
ratio has increased by 17 % which can be considered as a significant increase in profits. There
can be various reasons for such increase in profitability such as operational efficiency, brand
value, established name etc. all of these factors has contributed towards this operating and net
profit margin. Strategic planning should be done by the management of the company to study the
current operating strategy (Ongore and Kusa, 2013). These strategies should be documented and
followed in near futures so that same ratio proportion of profitability can be maintained in future.
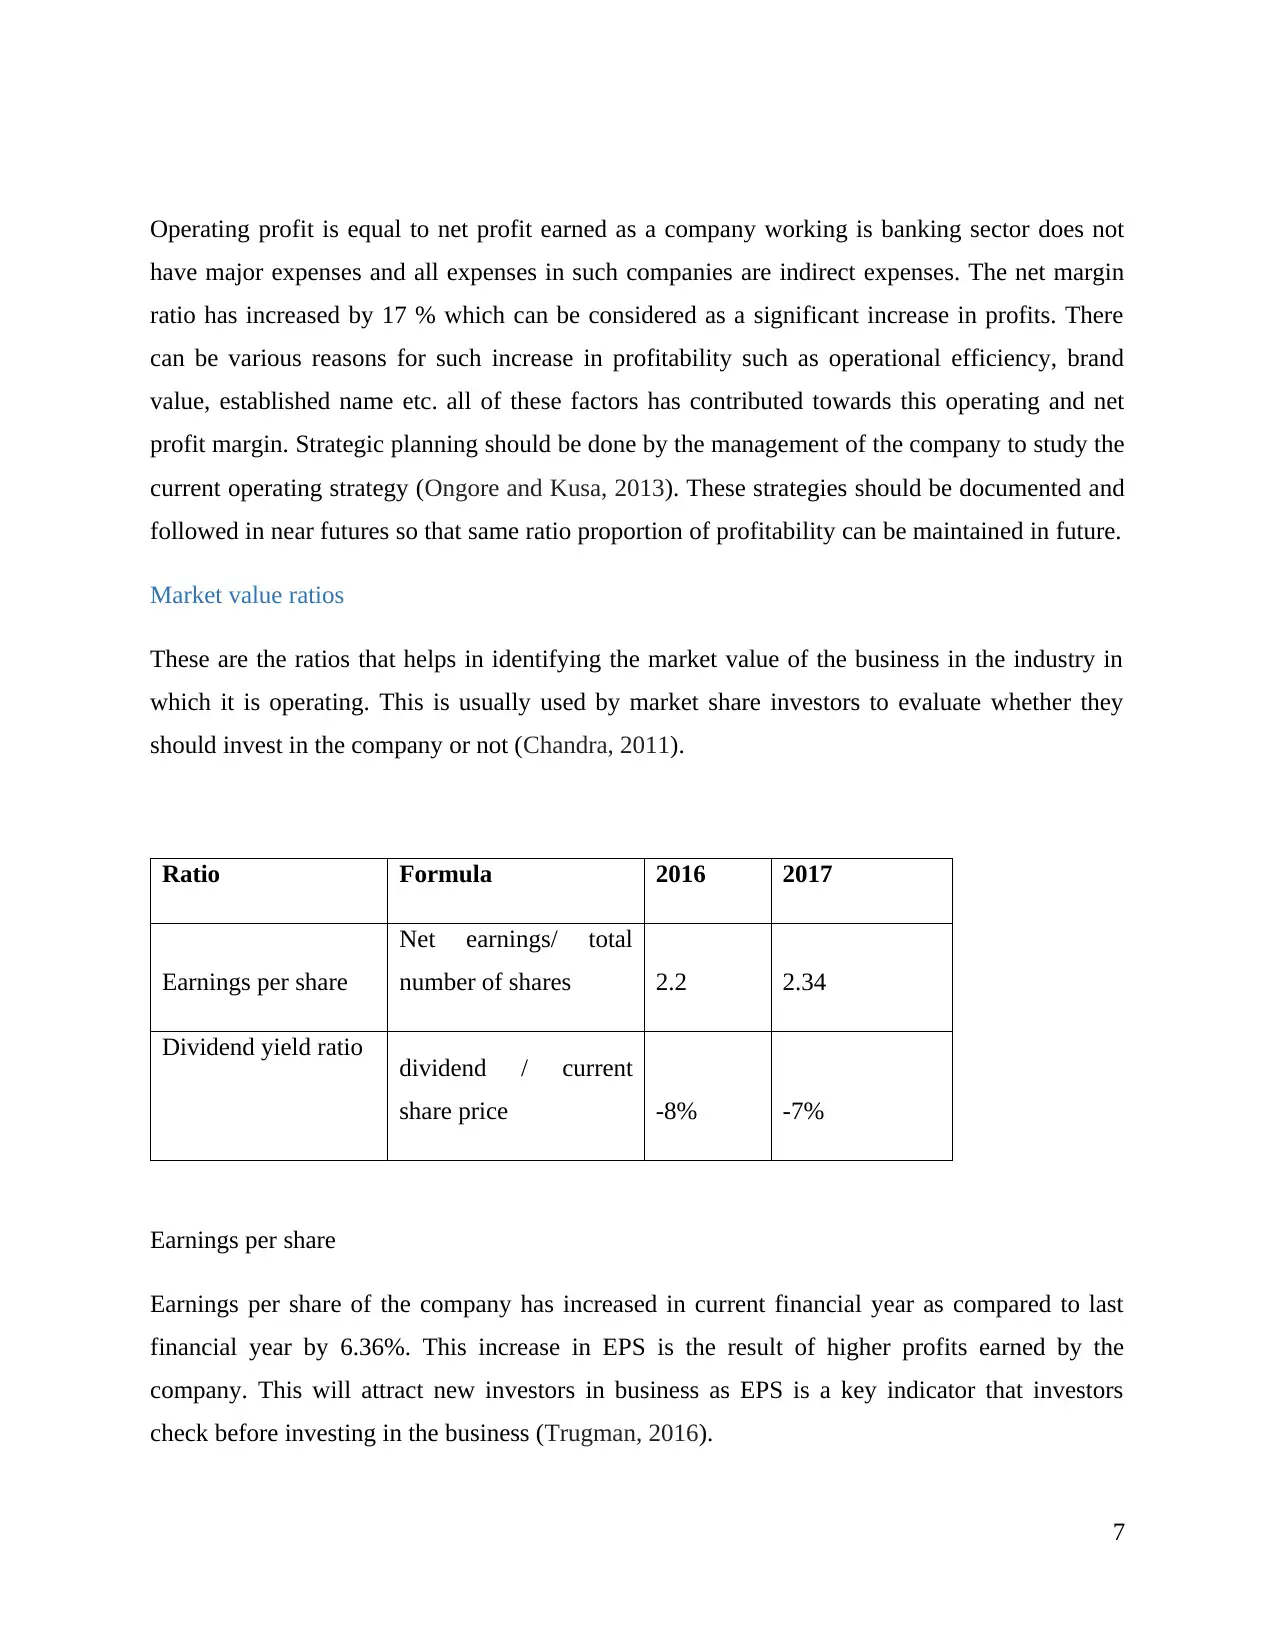
Market value ratios
These are the ratios that helps in identifying the market value of the business in the industry in
which it is operating. This is usually used by market share investors to evaluate whether they
should invest in the company or not (Chandra, 2011).
Ratio Formula 2016 2017
Earnings per share
Net earnings/ total
number of shares 2.2 2.34
Dividend yield ratio dividend / current
share price -8% -7%
Earnings per share
Earnings per share of the company has increased in current financial year as compared to last
financial year by 6.36%. This increase in EPS is the result of higher profits earned by the
company. This will attract new investors in business as EPS is a key indicator that investors
check before investing in the business (Trugman, 2016).
7
have major expenses and all expenses in such companies are indirect expenses. The net margin
ratio has increased by 17 % which can be considered as a significant increase in profits. There
can be various reasons for such increase in profitability such as operational efficiency, brand
value, established name etc. all of these factors has contributed towards this operating and net
profit margin. Strategic planning should be done by the management of the company to study the
current operating strategy (Ongore and Kusa, 2013). These strategies should be documented and
followed in near futures so that same ratio proportion of profitability can be maintained in future.
Market value ratios
These are the ratios that helps in identifying the market value of the business in the industry in
which it is operating. This is usually used by market share investors to evaluate whether they
should invest in the company or not (Chandra, 2011).
Ratio Formula 2016 2017
Earnings per share
Net earnings/ total
number of shares 2.2 2.34
Dividend yield ratio dividend / current
share price -8% -7%
Earnings per share
Earnings per share of the company has increased in current financial year as compared to last
financial year by 6.36%. This increase in EPS is the result of higher profits earned by the
company. This will attract new investors in business as EPS is a key indicator that investors
check before investing in the business (Trugman, 2016).
7
Paraphrase This Document
Need a fresh take? Get an instant paraphrase of this document with our AI Paraphraser
Dividend yield ratio
This is the ratio that forms a relationship between dividend paid to shareholders of the company
and market prices of the share of the company prevailing in share market. In simple words it can
be said dividend yield shows the proportion of market share of the company that is distributed by
the company in form of dividend. Dividend yield of the company is very low in both the
financial years under consideration. Hence it can be said that company should increase the
amount of dividend paid to equity shareholders of the company.
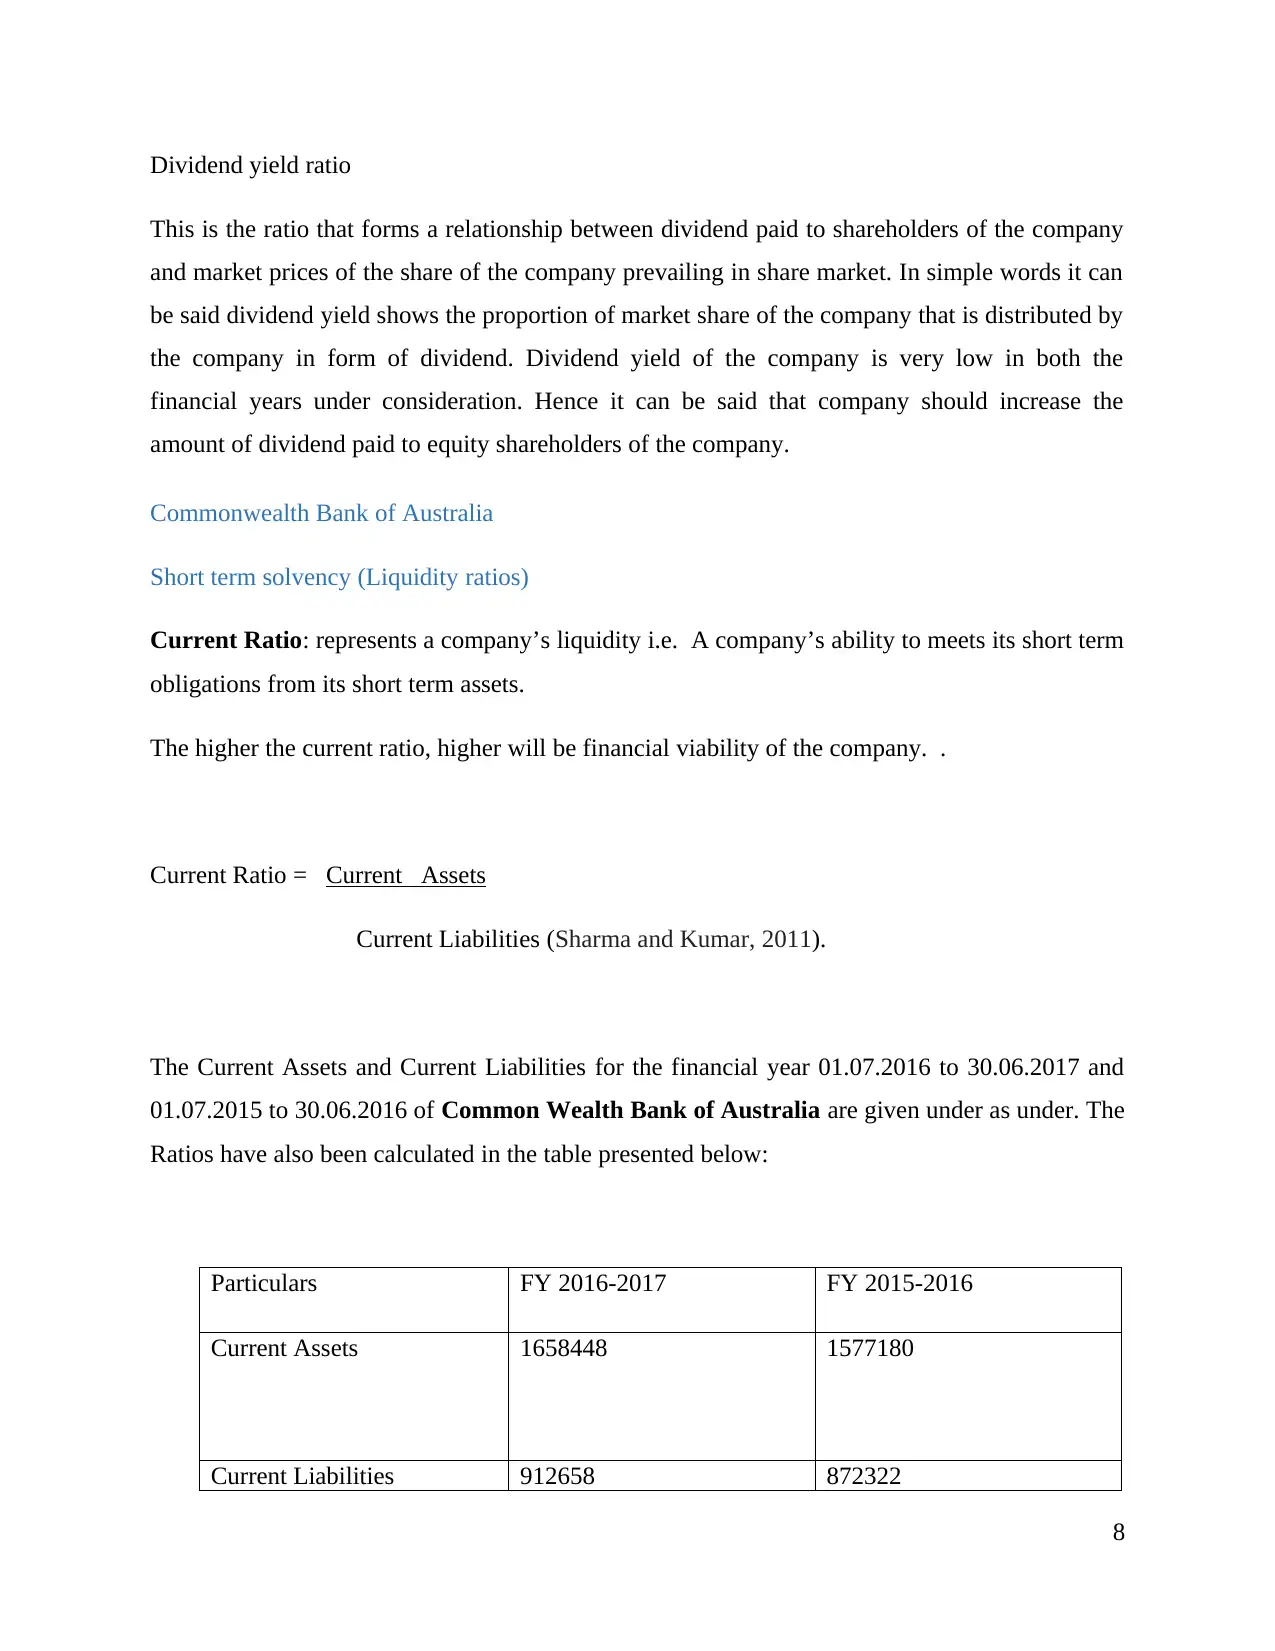
Commonwealth Bank of Australia
Short term solvency (Liquidity ratios)
Current Ratio: represents a company’s liquidity i.e. A company’s ability to meets its short term
obligations from its short term assets.
The higher the current ratio, higher will be financial viability of the company. .
Current Ratio = Current Assets
Current Liabilities (Sharma and Kumar, 2011).
The Current Assets and Current Liabilities for the financial year 01.07.2016 to 30.06.2017 and
01.07.2015 to 30.06.2016 of Common Wealth Bank of Australia are given under as under. The
Ratios have also been calculated in the table presented below:
Particulars FY 2016-2017 FY 2015-2016
Current Assets 1658448 1577180
Current Liabilities 912658 872322
8
This is the ratio that forms a relationship between dividend paid to shareholders of the company
and market prices of the share of the company prevailing in share market. In simple words it can
be said dividend yield shows the proportion of market share of the company that is distributed by
the company in form of dividend. Dividend yield of the company is very low in both the
financial years under consideration. Hence it can be said that company should increase the
amount of dividend paid to equity shareholders of the company.
Commonwealth Bank of Australia
Short term solvency (Liquidity ratios)
Current Ratio: represents a company’s liquidity i.e. A company’s ability to meets its short term
obligations from its short term assets.
The higher the current ratio, higher will be financial viability of the company. .
Current Ratio = Current Assets
Current Liabilities (Sharma and Kumar, 2011).
The Current Assets and Current Liabilities for the financial year 01.07.2016 to 30.06.2017 and
01.07.2015 to 30.06.2016 of Common Wealth Bank of Australia are given under as under. The
Ratios have also been calculated in the table presented below:
Particulars FY 2016-2017 FY 2015-2016
Current Assets 1658448 1577180
Current Liabilities 912658 872322
8
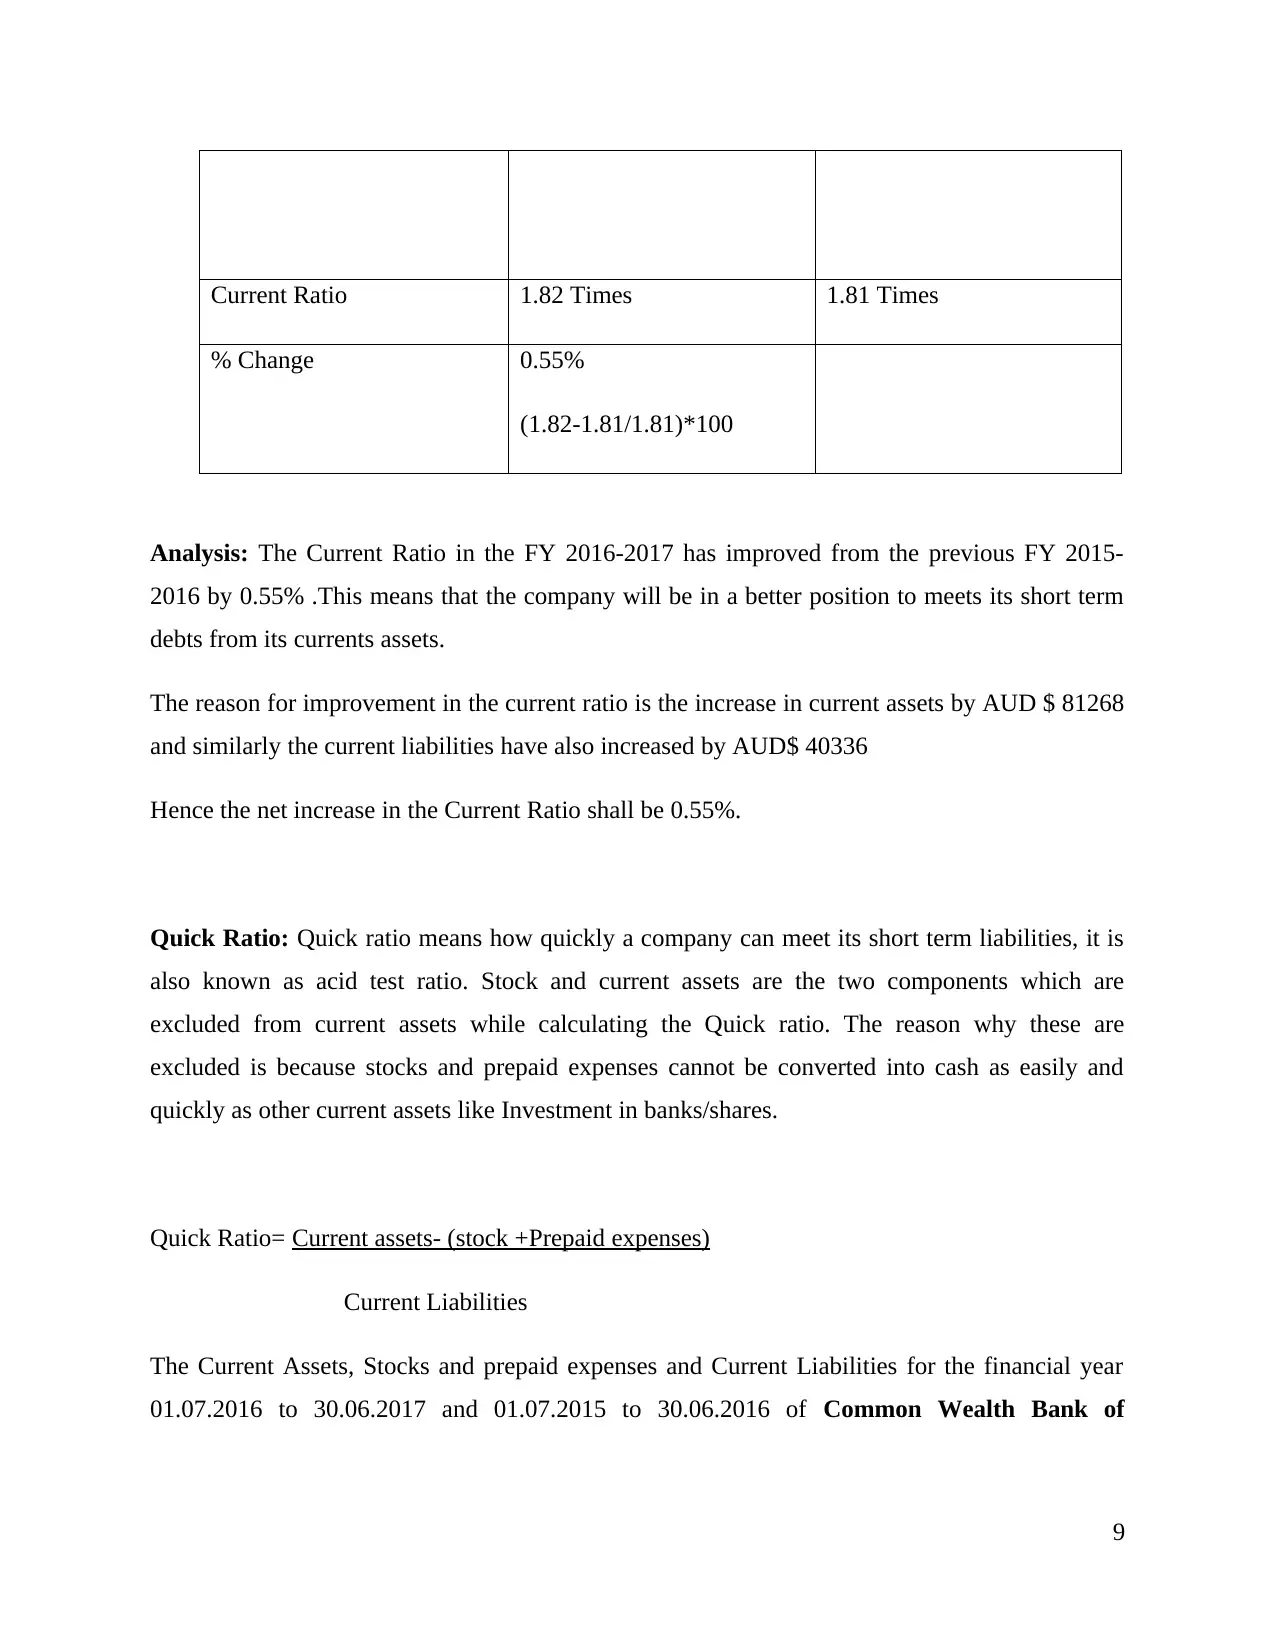
Current Ratio 1.82 Times 1.81 Times
% Change 0.55%
(1.82-1.81/1.81)*100
Analysis: The Current Ratio in the FY 2016-2017 has improved from the previous FY 2015-
2016 by 0.55% .This means that the company will be in a better position to meets its short term
debts from its currents assets.
The reason for improvement in the current ratio is the increase in current assets by AUD $ 81268
and similarly the current liabilities have also increased by AUD$ 40336
Hence the net increase in the Current Ratio shall be 0.55%.
Quick Ratio: Quick ratio means how quickly a company can meet its short term liabilities, it is
also known as acid test ratio. Stock and current assets are the two components which are
excluded from current assets while calculating the Quick ratio. The reason why these are
excluded is because stocks and prepaid expenses cannot be converted into cash as easily and
quickly as other current assets like Investment in banks/shares.
Quick Ratio= Current assets- (stock +Prepaid expenses)
Current Liabilities
The Current Assets, Stocks and prepaid expenses and Current Liabilities for the financial year
01.07.2016 to 30.06.2017 and 01.07.2015 to 30.06.2016 of Common Wealth Bank of
9
⊘ This is a preview!⊘
Do you want full access?
Subscribe today to unlock all pages.
Trusted by 1+ million students worldwide
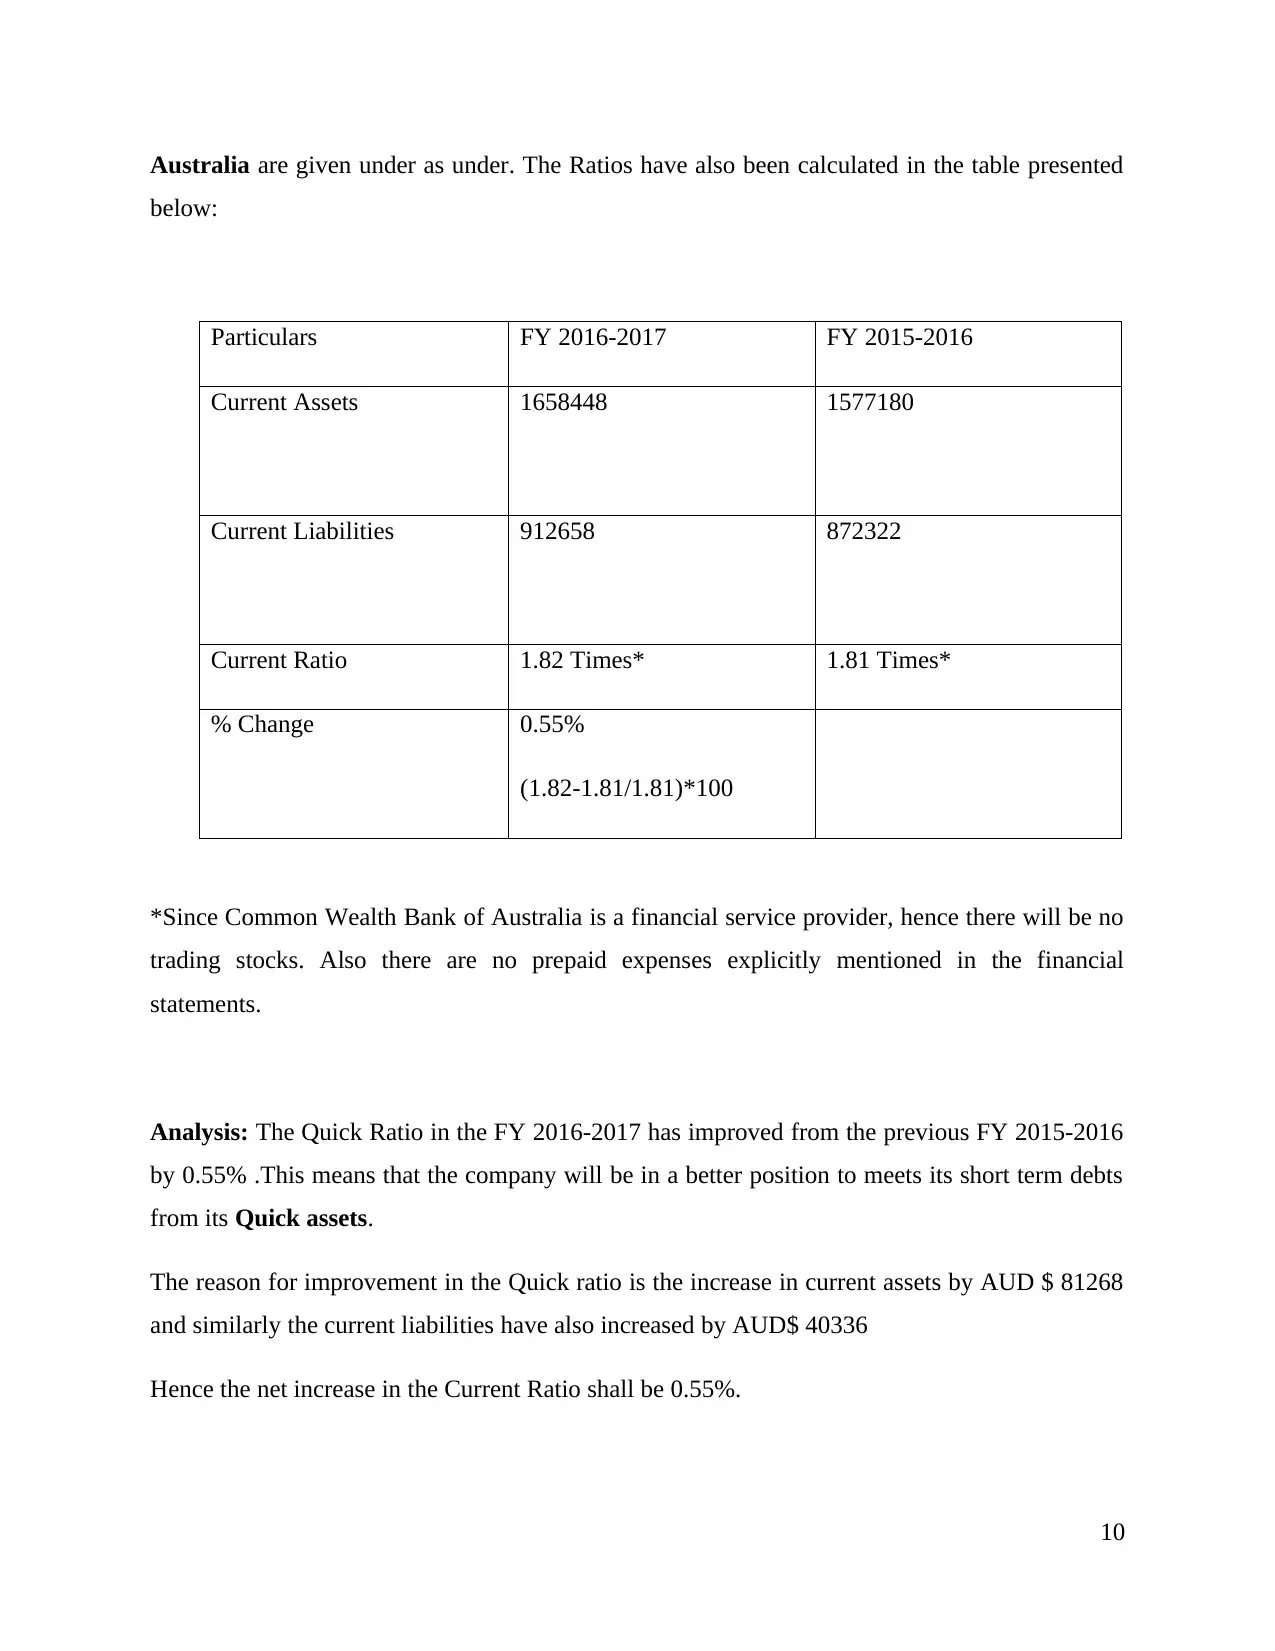
Australia are given under as under. The Ratios have also been calculated in the table presented
below:
Particulars FY 2016-2017 FY 2015-2016
Current Assets 1658448 1577180
Current Liabilities 912658 872322
Current Ratio 1.82 Times* 1.81 Times*
% Change 0.55%
(1.82-1.81/1.81)*100
*Since Common Wealth Bank of Australia is a financial service provider, hence there will be no
trading stocks. Also there are no prepaid expenses explicitly mentioned in the financial
statements.
Analysis: The Quick Ratio in the FY 2016-2017 has improved from the previous FY 2015-2016
by 0.55% .This means that the company will be in a better position to meets its short term debts
from its Quick assets.
The reason for improvement in the Quick ratio is the increase in current assets by AUD $ 81268
and similarly the current liabilities have also increased by AUD$ 40336
Hence the net increase in the Current Ratio shall be 0.55%.
10
Paraphrase This Document
Need a fresh take? Get an instant paraphrase of this document with our AI Paraphraser
Long term solvency ratio (Financial leverage ratio)
Debt Equity ratio: Debt Equity ratio means the proportionate of the liabilities of a company to
its equity or the shareholder’s funds. Which further means, Debt equity ratio represents the ratio
of the funds used by the company to source its assets (Feld et.al, 2013)
A high debt equity ratio means outside borrowings from creditors are more than borrowings from
shareholders made by the company to source its assets. However a low Debt Equity ratio means
the involvement of shareholder’s funds is more than the outside borrowings. Hence a Low Debt
Equity ratio is always preferred.
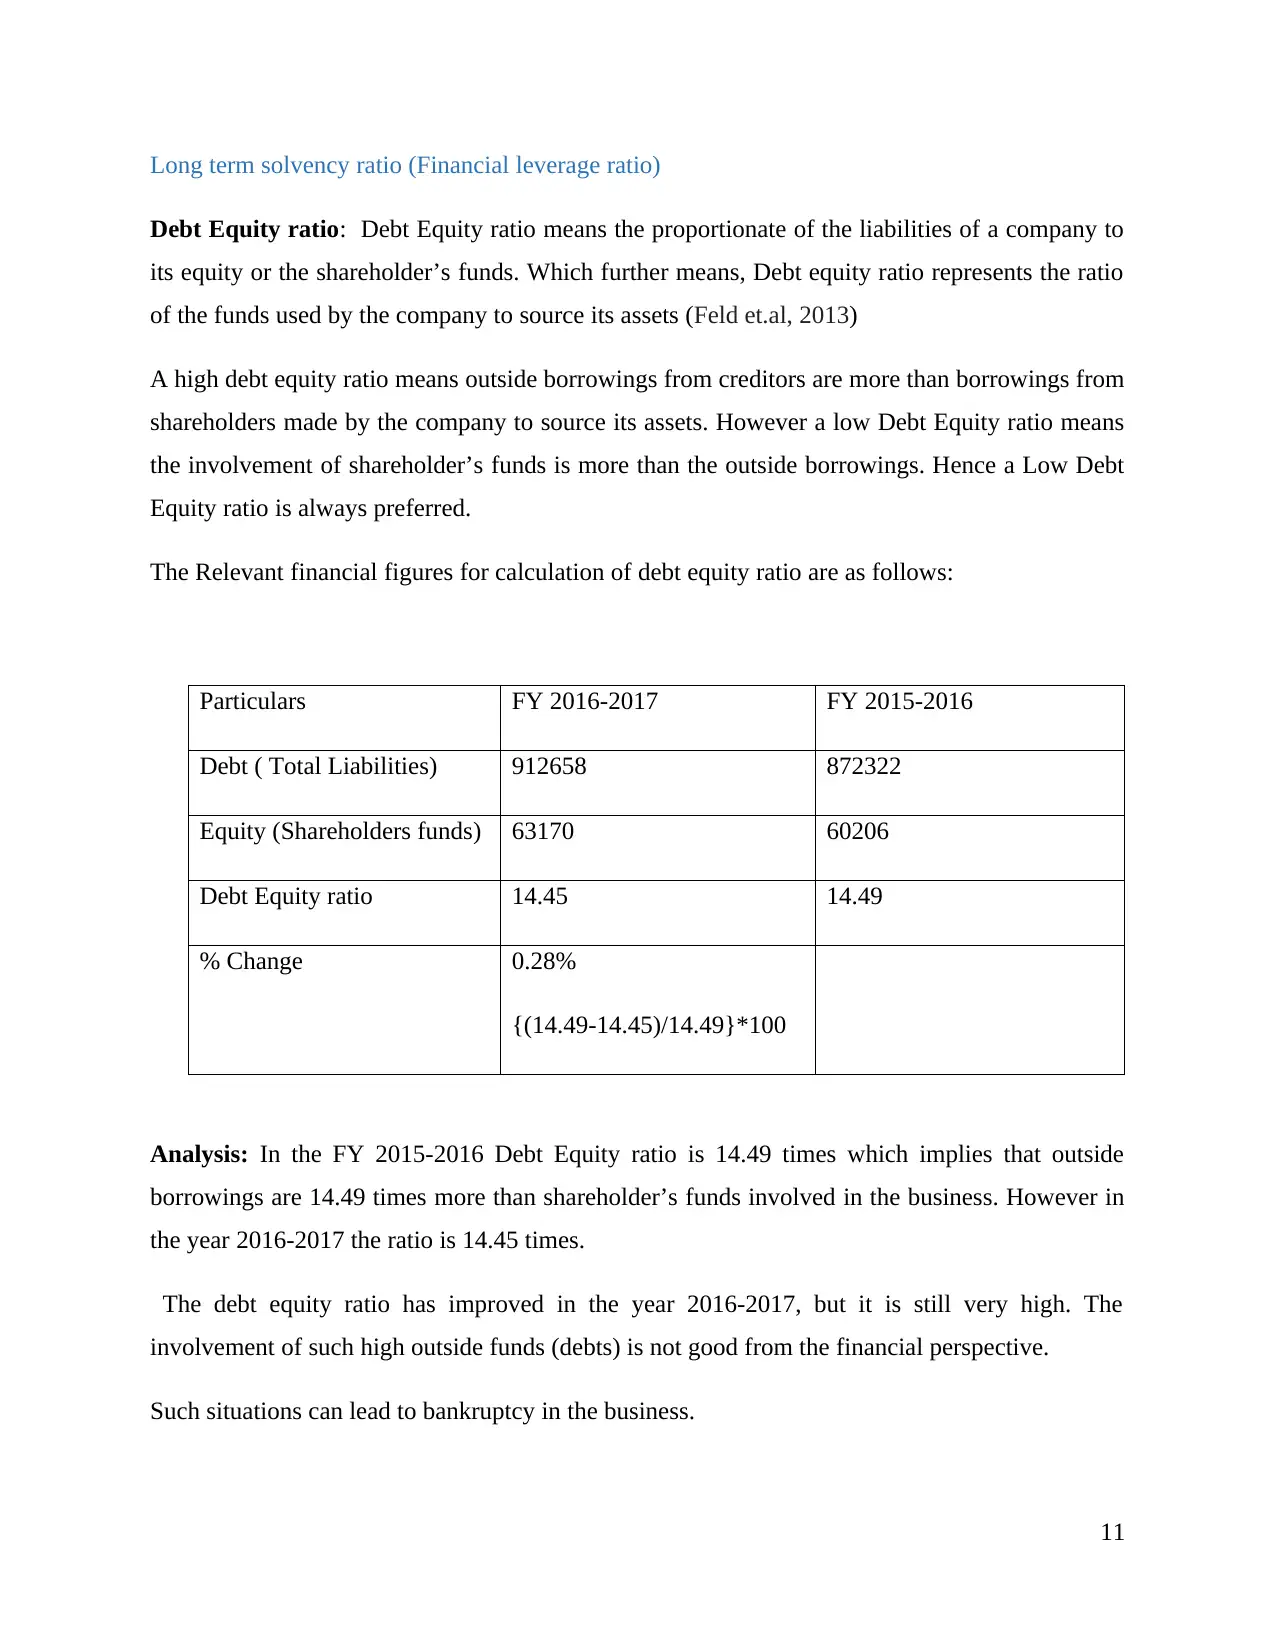
The Relevant financial figures for calculation of debt equity ratio are as follows:
Particulars FY 2016-2017 FY 2015-2016
Debt ( Total Liabilities) 912658 872322
Equity (Shareholders funds) 63170 60206
Debt Equity ratio 14.45 14.49
% Change 0.28%
{(14.49-14.45)/14.49}*100
Analysis: In the FY 2015-2016 Debt Equity ratio is 14.49 times which implies that outside
borrowings are 14.49 times more than shareholder’s funds involved in the business. However in
the year 2016-2017 the ratio is 14.45 times.
The debt equity ratio has improved in the year 2016-2017, but it is still very high. The
involvement of such high outside funds (debts) is not good from the financial perspective.
Such situations can lead to bankruptcy in the business.
11
Debt Equity ratio: Debt Equity ratio means the proportionate of the liabilities of a company to
its equity or the shareholder’s funds. Which further means, Debt equity ratio represents the ratio
of the funds used by the company to source its assets (Feld et.al, 2013)
A high debt equity ratio means outside borrowings from creditors are more than borrowings from
shareholders made by the company to source its assets. However a low Debt Equity ratio means
the involvement of shareholder’s funds is more than the outside borrowings. Hence a Low Debt
Equity ratio is always preferred.
The Relevant financial figures for calculation of debt equity ratio are as follows:
Particulars FY 2016-2017 FY 2015-2016
Debt ( Total Liabilities) 912658 872322
Equity (Shareholders funds) 63170 60206
Debt Equity ratio 14.45 14.49
% Change 0.28%
{(14.49-14.45)/14.49}*100
Analysis: In the FY 2015-2016 Debt Equity ratio is 14.49 times which implies that outside
borrowings are 14.49 times more than shareholder’s funds involved in the business. However in
the year 2016-2017 the ratio is 14.45 times.
The debt equity ratio has improved in the year 2016-2017, but it is still very high. The
involvement of such high outside funds (debts) is not good from the financial perspective.
Such situations can lead to bankruptcy in the business.
11
Interest Coverage Ratio: Interest coverage ratio means the proportionate of amount of earnings
made by the company before paying off the interest and tax expense (EBIT) to the interest cost
of borrowing the funds.
In other words, the earnings (EBIT) made on per rupee of interest cost is known the interest
coverage ratio
Interest Coverage Ratio= EBIT
Interest Cost
If the Interest coverage ratio is low, it means that Interest cost is much higher than the earnings
made by borrowing such funds. Hence a high Interest coverage ratio is considered as favorable.
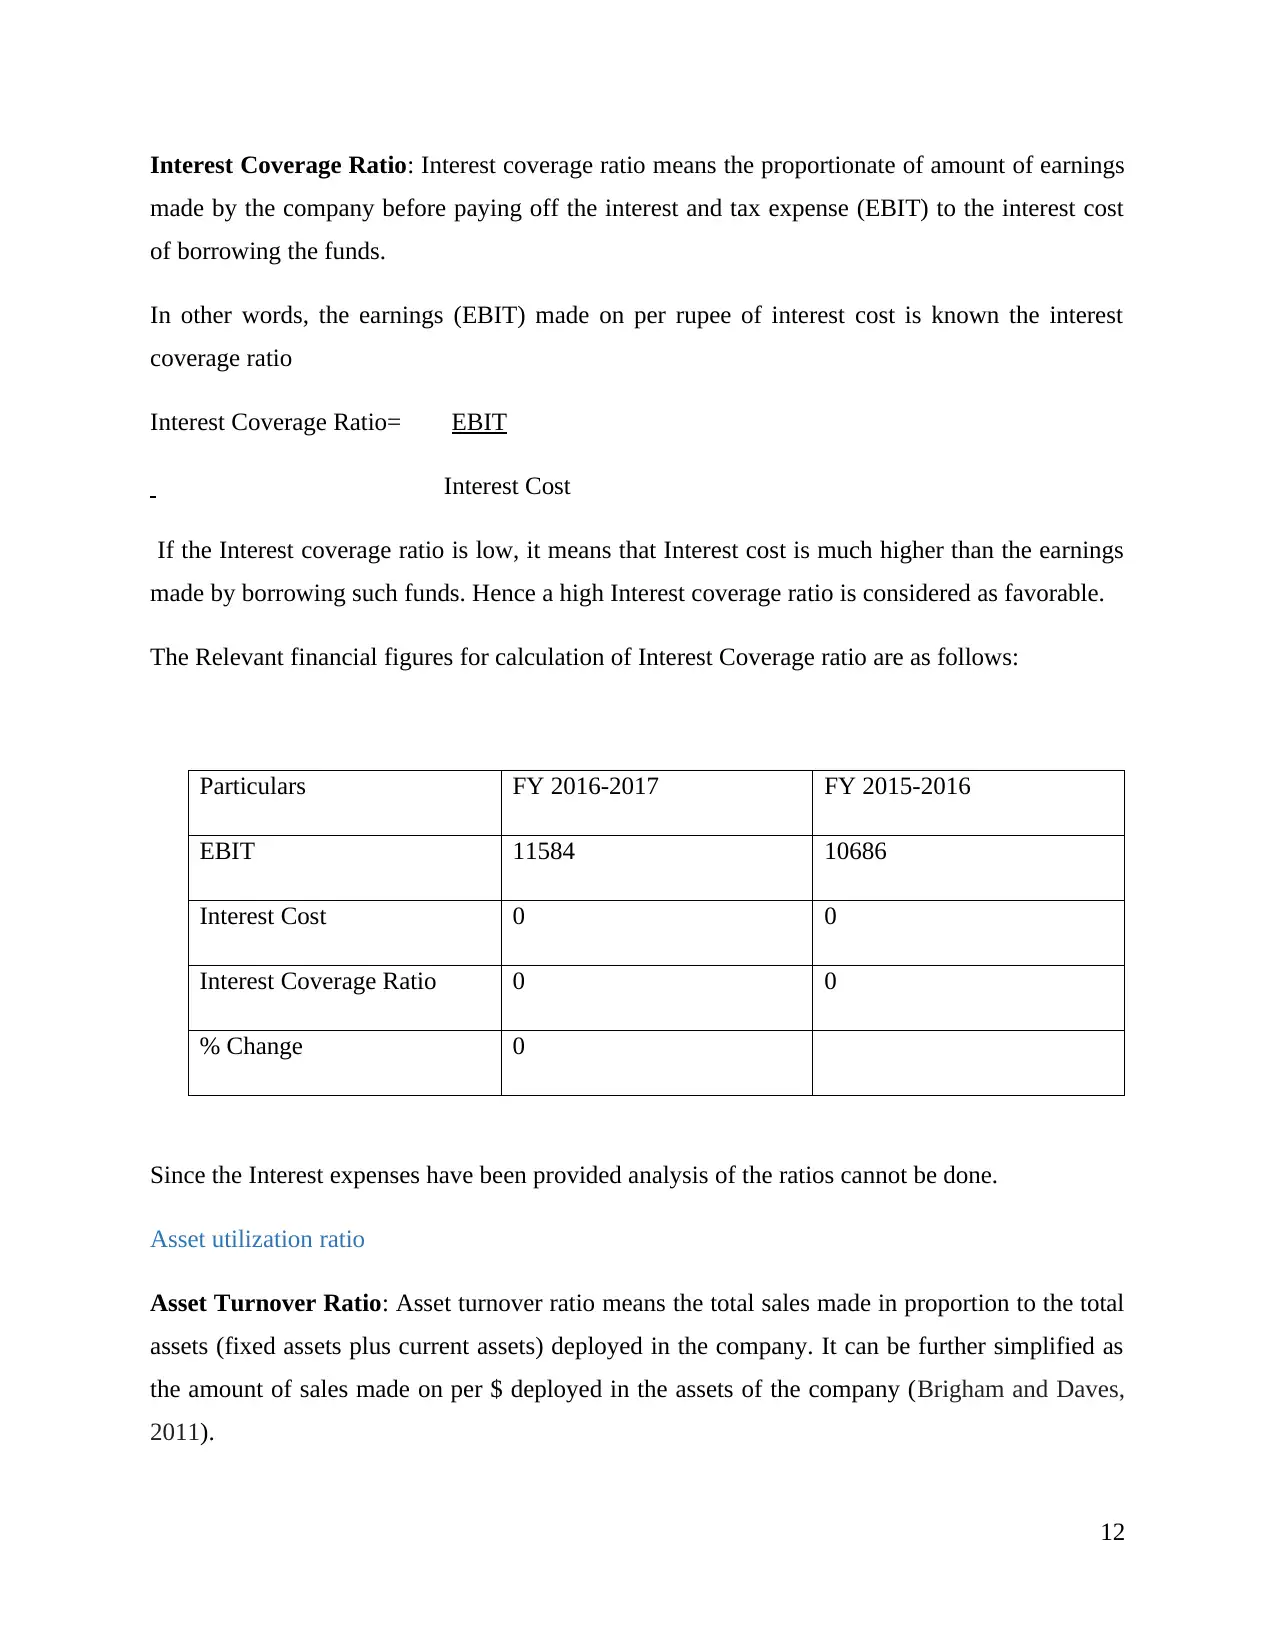
The Relevant financial figures for calculation of Interest Coverage ratio are as follows:
Particulars FY 2016-2017 FY 2015-2016
EBIT 11584 10686
Interest Cost 0 0
Interest Coverage Ratio 0 0
% Change 0
Since the Interest expenses have been provided analysis of the ratios cannot be done.
Asset utilization ratio
Asset Turnover Ratio: Asset turnover ratio means the total sales made in proportion to the total
assets (fixed assets plus current assets) deployed in the company. It can be further simplified as
the amount of sales made on per $ deployed in the assets of the company (Brigham and Daves,
2011).
12
made by the company before paying off the interest and tax expense (EBIT) to the interest cost
of borrowing the funds.
In other words, the earnings (EBIT) made on per rupee of interest cost is known the interest
coverage ratio
Interest Coverage Ratio= EBIT
Interest Cost
If the Interest coverage ratio is low, it means that Interest cost is much higher than the earnings
made by borrowing such funds. Hence a high Interest coverage ratio is considered as favorable.
The Relevant financial figures for calculation of Interest Coverage ratio are as follows:
Particulars FY 2016-2017 FY 2015-2016
EBIT 11584 10686
Interest Cost 0 0
Interest Coverage Ratio 0 0
% Change 0
Since the Interest expenses have been provided analysis of the ratios cannot be done.
Asset utilization ratio
Asset Turnover Ratio: Asset turnover ratio means the total sales made in proportion to the total
assets (fixed assets plus current assets) deployed in the company. It can be further simplified as
the amount of sales made on per $ deployed in the assets of the company (Brigham and Daves,
2011).
12
⊘ This is a preview!⊘
Do you want full access?
Subscribe today to unlock all pages.
Trusted by 1+ million students worldwide
1 out of 20
Related Documents


Your All-in-One AI-Powered Toolkit for Academic Success.
+13062052269
info@desklib.com
Available 24*7 on WhatsApp / Email
![[object Object]](/_next/static/media/star-bottom.7253800d.svg)
Unlock your academic potential
Copyright © 2020–2026 A2Z Services. All Rights Reserved. Developed and managed by ZUCOL.