Ratio Analysis, Budgeting & Financial Decision Making: A Report
VerifiedAdded on 2023/06/10
|19
|3811
|467
Report
AI Summary
This report provides a comprehensive analysis of accounting and finance principles, focusing on financial ratio analysis, budgeting, and capital budgeting techniques. It begins by calculating and interpreting various financial ratios for Trust PLC, including profitability, efficiency, liquidity, investment, and financial structure ratios, to assess the company's financial health and performance. The report then analyzes the objectives of budgeting for Manor Ltd and differentiates between management and financial accounting. Furthermore, it evaluates two projects, A and B, using the Net Present Value (NPV) and payback period methods, ultimately recommending project A based on its superior financial metrics. The analysis aims to provide insights for strategic decision-making and highlights the importance of sound financial management in achieving organizational objectives. This document is available on Desklib, a platform offering a wide range of study tools and solved assignments for students.

INTRODUCTION TO
ACCOUNTING &
FINANCE
1
ACCOUNTING &
FINANCE
1
Paraphrase This Document
Need a fresh take? Get an instant paraphrase of this document with our AI Paraphraser

2
Abstract
Accounting and finance is crucial for making the strategic decision. Financial
ratio is considered to be the metrics that allow the investors and other stakeholders to
analyse the financial performance of the organisation. Budgeting is a very important
factor for any organization to be able to plan the financial activities. The different
between the management accounting and financial accounting is that management
accounting is helpful for the organisation and its competitors for the analysation of
trends and performance whereas, financial accounting is requirement of the
organisation for meeting the corporate governance. The current study has involved
calculation of project A & B by involving NPV and payback period method of capital
budgeting which is depicting that project A is beneficial.
3
⊘ This is a preview!⊘
Do you want full access?
Subscribe today to unlock all pages.
Trusted by 1+ million students worldwide
TABLE OF CONTENTS
INTRODUCTION..........................................................................................................................4
MAIN BODY..................................................................................................................................4
SECTION A...................................................................................................................................4
Profitability Ratios................................................................................................................4
Efficiency ratios.....................................................................................................................6
Liquidity Ratios......................................................................................................................8
Investment ratios...............................................................................................................10
Financial Structure ratios................................................................................................11
SECTION B.................................................................................................................................13
Analysing objectives of budgeting for Manor Ltd...................................................13
Differences between financial and management accounting...........................13
3................................................................................................................................................14
a) Payback Period for the projects A & B..................................................................14
b) calculating the Net Present Value for the projects A & B..............................15
c) Explaining reason for selecting the project.........................................................16
CONCLUSION............................................................................................................................17
REFERENCES............................................................................................................................18
4
Paraphrase This Document
Need a fresh take? Get an instant paraphrase of this document with our AI Paraphraser
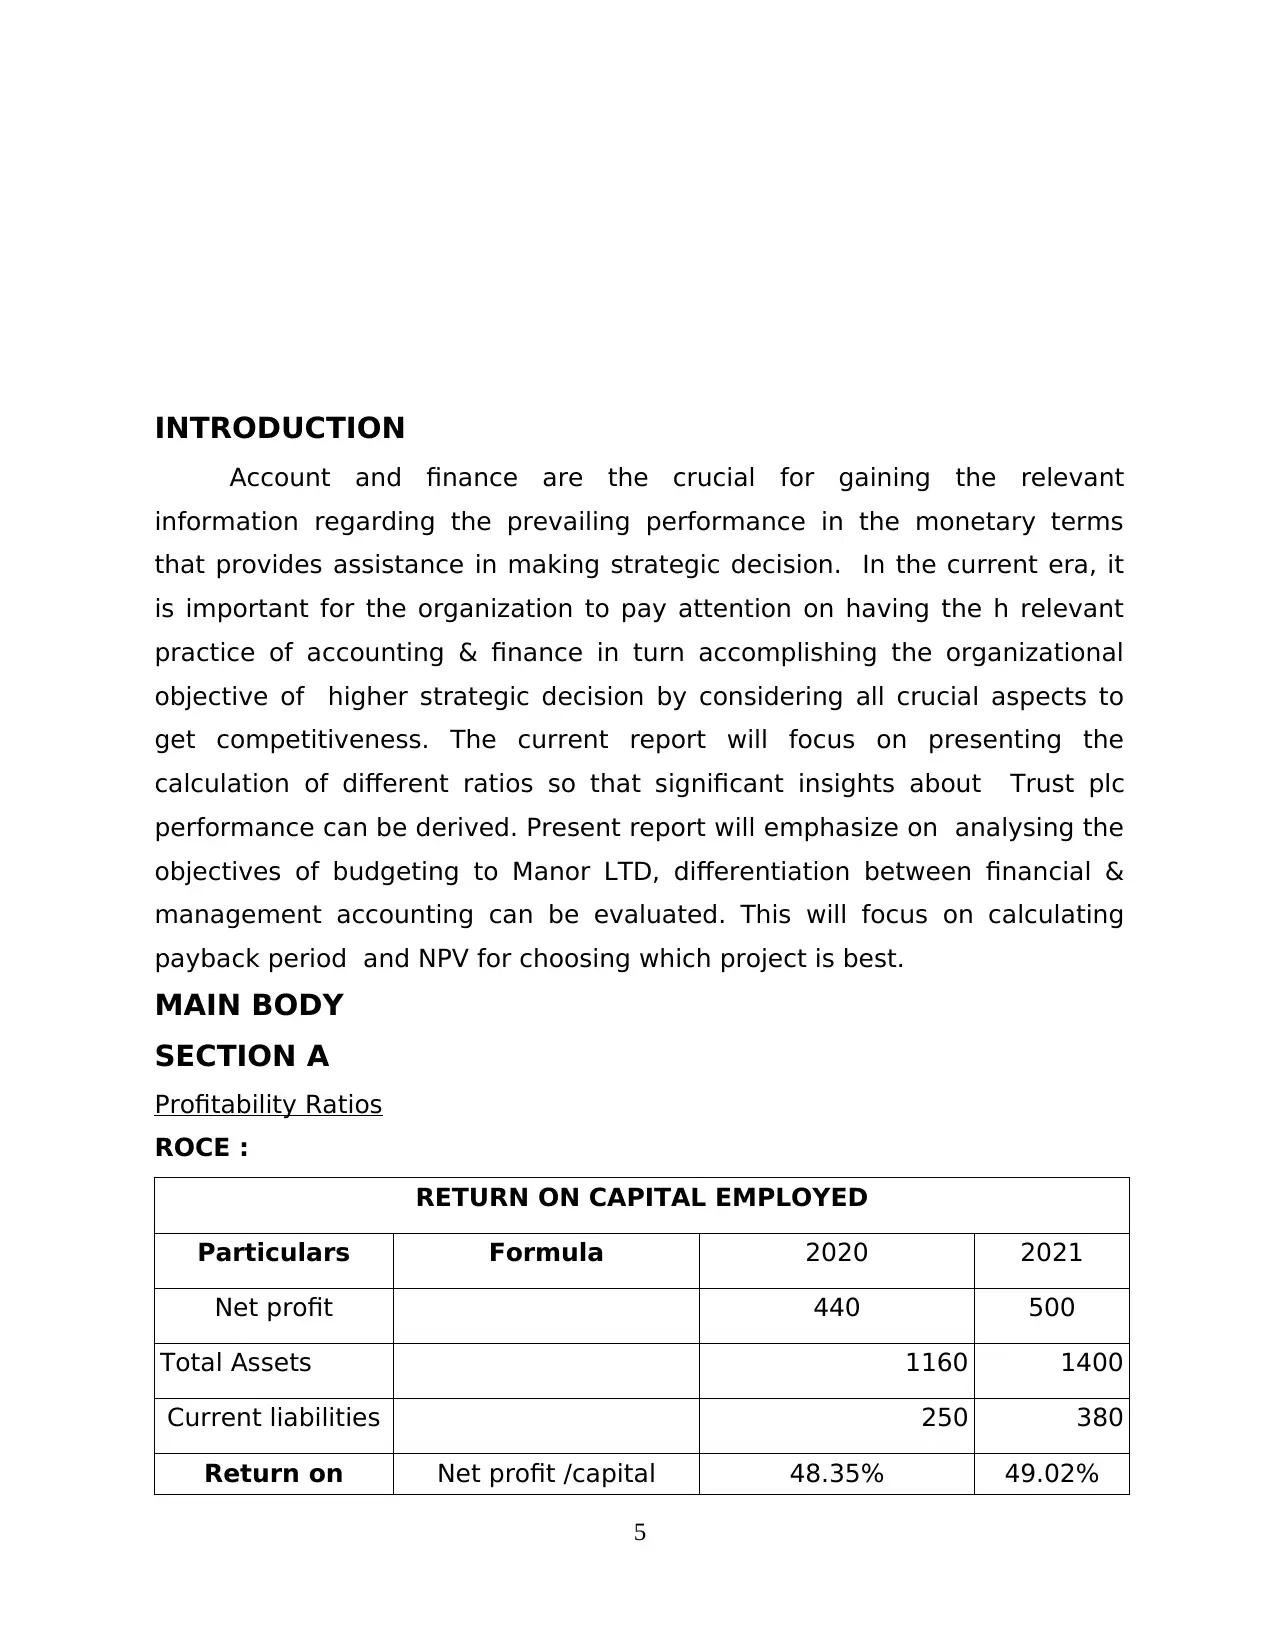
INTRODUCTION
Account and finance are the crucial for gaining the relevant
information regarding the prevailing performance in the monetary terms
that provides assistance in making strategic decision. In the current era, it
is important for the organization to pay attention on having the h relevant
practice of accounting & finance in turn accomplishing the organizational
objective of higher strategic decision by considering all crucial aspects to
get competitiveness. The current report will focus on presenting the
calculation of different ratios so that significant insights about Trust plc
performance can be derived. Present report will emphasize on analysing the
objectives of budgeting to Manor LTD, differentiation between financial &
management accounting can be evaluated. This will focus on calculating
payback period and NPV for choosing which project is best.
MAIN BODY
SECTION A
Profitability Ratios
ROCE :
RETURN ON CAPITAL EMPLOYED
Particulars Formula 2020 2021
Net profit 440 500
Total Assets 1160 1400
Current liabilities 250 380
Return on Net profit /capital 48.35% 49.02%
5
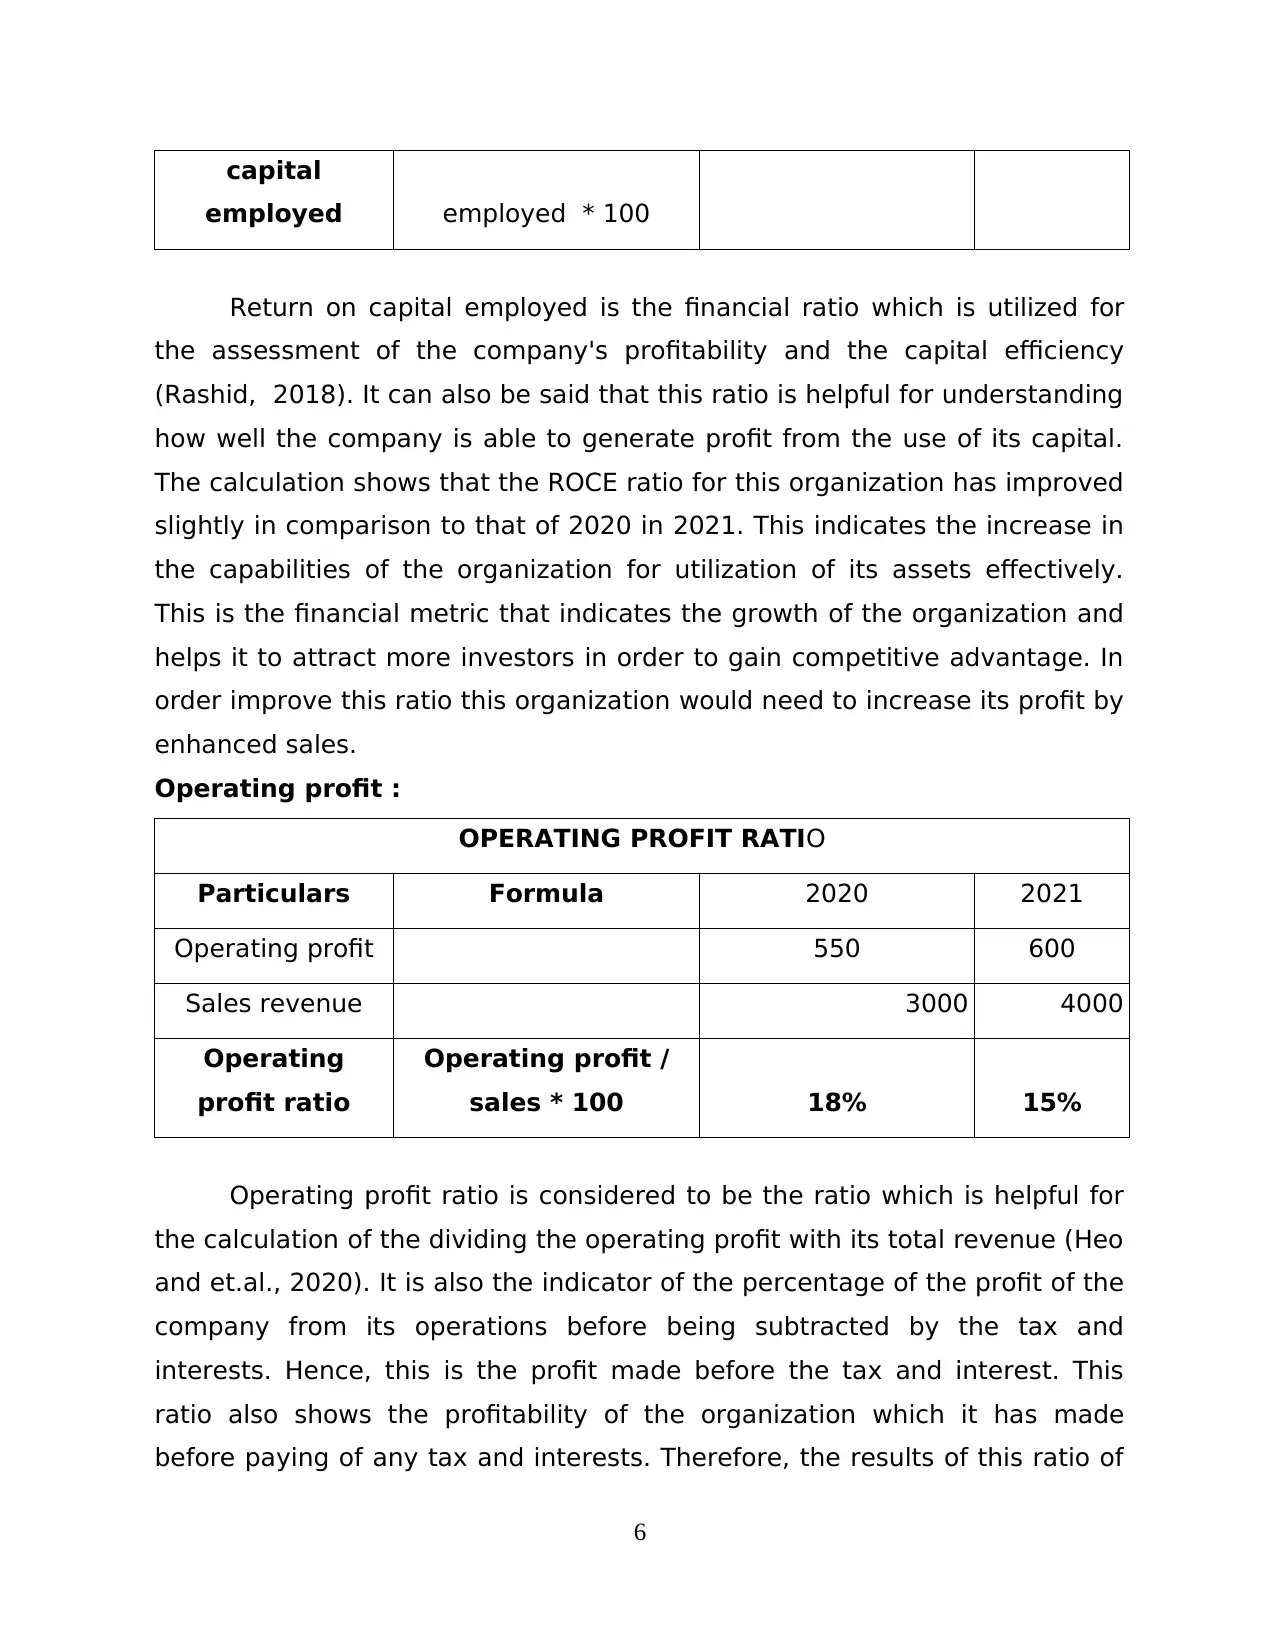
capital
employed employed * 100
Return on capital employed is the financial ratio which is utilized for
the assessment of the company's profitability and the capital efficiency
(Rashid, 2018). It can also be said that this ratio is helpful for understanding
how well the company is able to generate profit from the use of its capital.
The calculation shows that the ROCE ratio for this organization has improved
slightly in comparison to that of 2020 in 2021. This indicates the increase in
the capabilities of the organization for utilization of its assets effectively.
This is the financial metric that indicates the growth of the organization and
helps it to attract more investors in order to gain competitive advantage. In
order improve this ratio this organization would need to increase its profit by
enhanced sales.
Operating profit :
OPERATING PROFIT RATIO
Particulars Formula 2020 2021
Operating profit 550 600
Sales revenue 3000 4000
Operating
profit ratio
Operating profit /
sales * 100 18% 15%
Operating profit ratio is considered to be the ratio which is helpful for
the calculation of the dividing the operating profit with its total revenue (Heo
and et.al., 2020). It is also the indicator of the percentage of the profit of the
company from its operations before being subtracted by the tax and
interests. Hence, this is the profit made before the tax and interest. This
ratio also shows the profitability of the organization which it has made
before paying of any tax and interests. Therefore, the results of this ratio of
6
⊘ This is a preview!⊘
Do you want full access?
Subscribe today to unlock all pages.
Trusted by 1+ million students worldwide
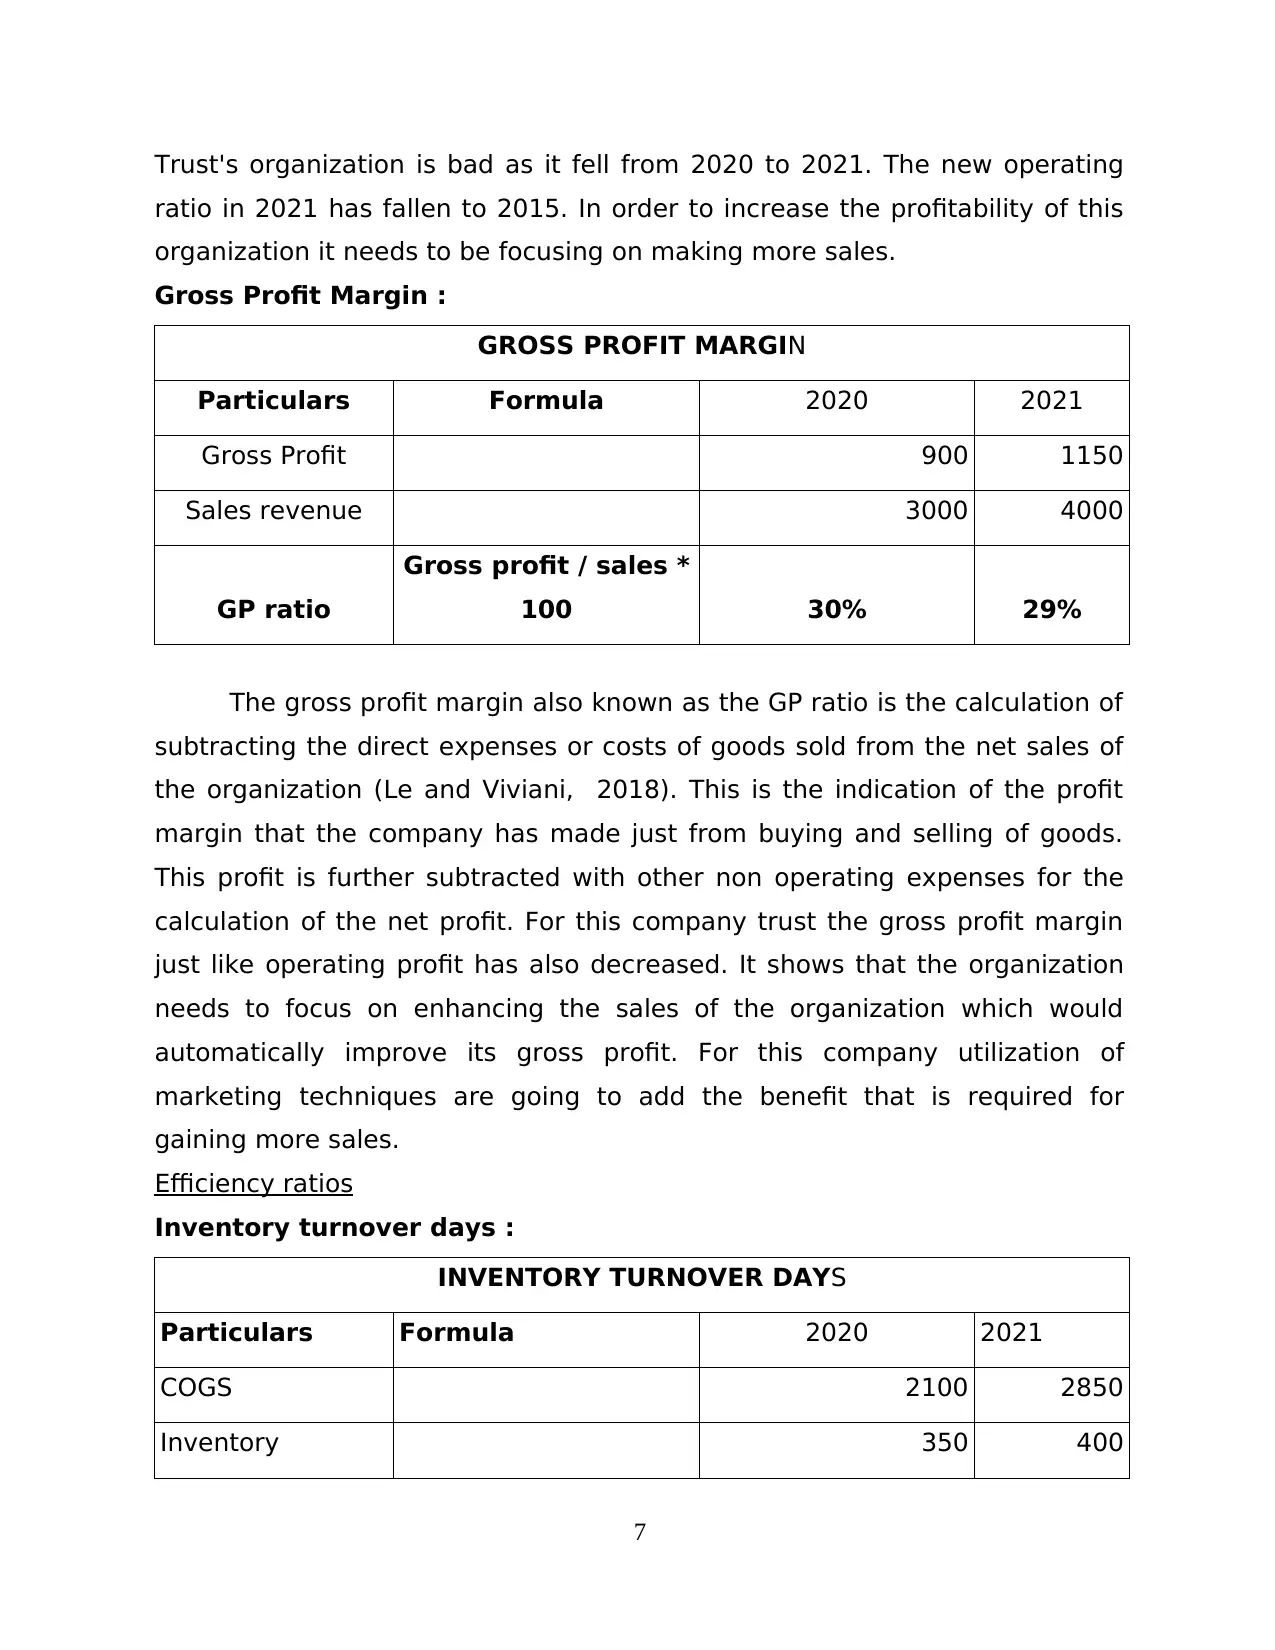
Trust's organization is bad as it fell from 2020 to 2021. The new operating
ratio in 2021 has fallen to 2015. In order to increase the profitability of this
organization it needs to be focusing on making more sales.
Gross Profit Margin :
GROSS PROFIT MARGIN
Particulars Formula 2020 2021
Gross Profit 900 1150
Sales revenue 3000 4000
GP ratio
Gross profit / sales *
100 30% 29%
The gross profit margin also known as the GP ratio is the calculation of
subtracting the direct expenses or costs of goods sold from the net sales of
the organization (Le and Viviani, 2018). This is the indication of the profit
margin that the company has made just from buying and selling of goods.
This profit is further subtracted with other non operating expenses for the
calculation of the net profit. For this company trust the gross profit margin
just like operating profit has also decreased. It shows that the organization
needs to focus on enhancing the sales of the organization which would
automatically improve its gross profit. For this company utilization of
marketing techniques are going to add the benefit that is required for
gaining more sales.
Efficiency ratios
Inventory turnover days :
INVENTORY TURNOVER DAYS
Particulars Formula 2020 2021
COGS 2100 2850
Inventory 350 400
7
Paraphrase This Document
Need a fresh take? Get an instant paraphrase of this document with our AI Paraphraser
Inventory
Turnover Days COGS/Inventory 61 51
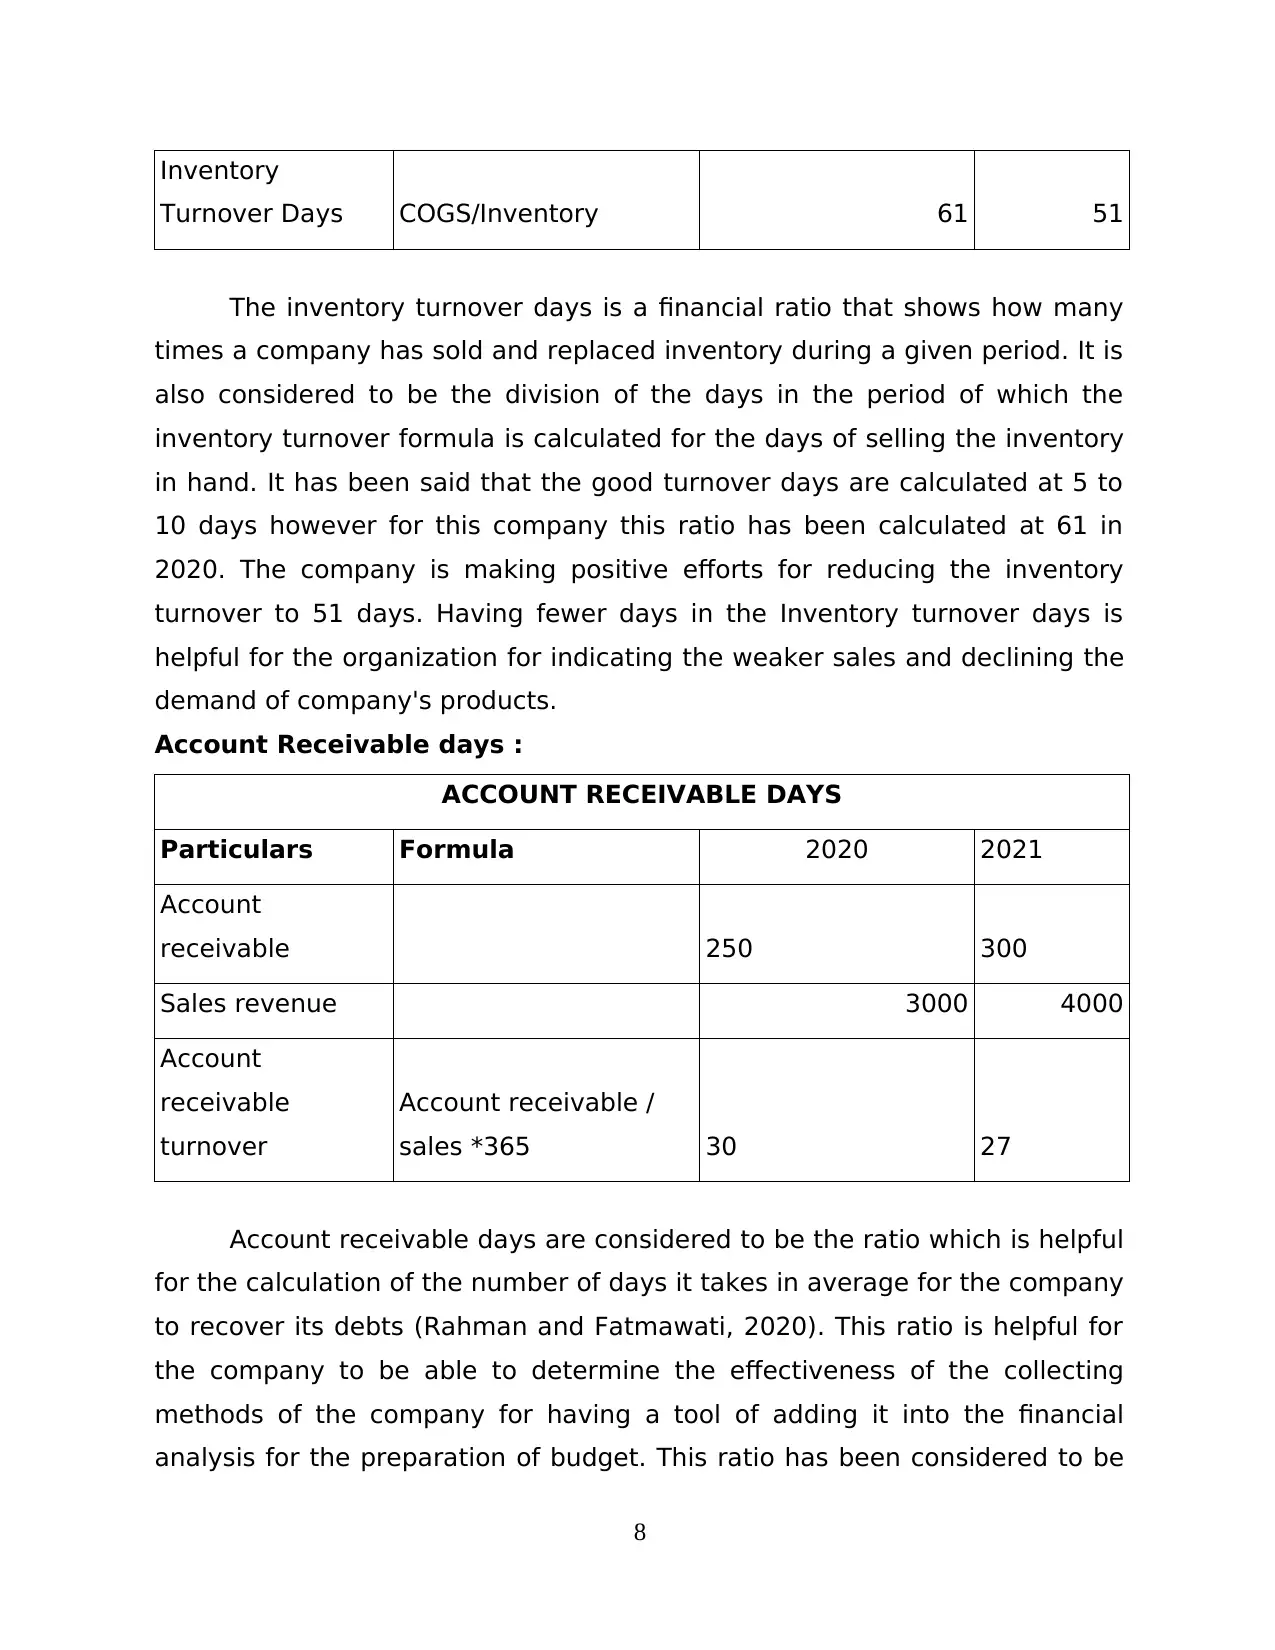
The inventory turnover days is a financial ratio that shows how many
times a company has sold and replaced inventory during a given period. It is
also considered to be the division of the days in the period of which the
inventory turnover formula is calculated for the days of selling the inventory
in hand. It has been said that the good turnover days are calculated at 5 to
10 days however for this company this ratio has been calculated at 61 in
2020. The company is making positive efforts for reducing the inventory
turnover to 51 days. Having fewer days in the Inventory turnover days is
helpful for the organization for indicating the weaker sales and declining the
demand of company's products.
Account Receivable days :
ACCOUNT RECEIVABLE DAYS
Particulars Formula 2020 2021
Account
receivable 250 300
Sales revenue 3000 4000
Account
receivable
turnover
Account receivable /
sales *365 30 27
Account receivable days are considered to be the ratio which is helpful
for the calculation of the number of days it takes in average for the company
to recover its debts (Rahman and Fatmawati, 2020). This ratio is helpful for
the company to be able to determine the effectiveness of the collecting
methods of the company for having a tool of adding it into the financial
analysis for the preparation of budget. This ratio has been considered to be
8
Turnover Days COGS/Inventory 61 51
The inventory turnover days is a financial ratio that shows how many
times a company has sold and replaced inventory during a given period. It is
also considered to be the division of the days in the period of which the
inventory turnover formula is calculated for the days of selling the inventory
in hand. It has been said that the good turnover days are calculated at 5 to
10 days however for this company this ratio has been calculated at 61 in
2020. The company is making positive efforts for reducing the inventory
turnover to 51 days. Having fewer days in the Inventory turnover days is
helpful for the organization for indicating the weaker sales and declining the
demand of company's products.
Account Receivable days :
ACCOUNT RECEIVABLE DAYS
Particulars Formula 2020 2021
Account
receivable 250 300
Sales revenue 3000 4000
Account
receivable
turnover
Account receivable /
sales *365 30 27
Account receivable days are considered to be the ratio which is helpful
for the calculation of the number of days it takes in average for the company
to recover its debts (Rahman and Fatmawati, 2020). This ratio is helpful for
the company to be able to determine the effectiveness of the collecting
methods of the company for having a tool of adding it into the financial
analysis for the preparation of budget. This ratio has been considered to be
8
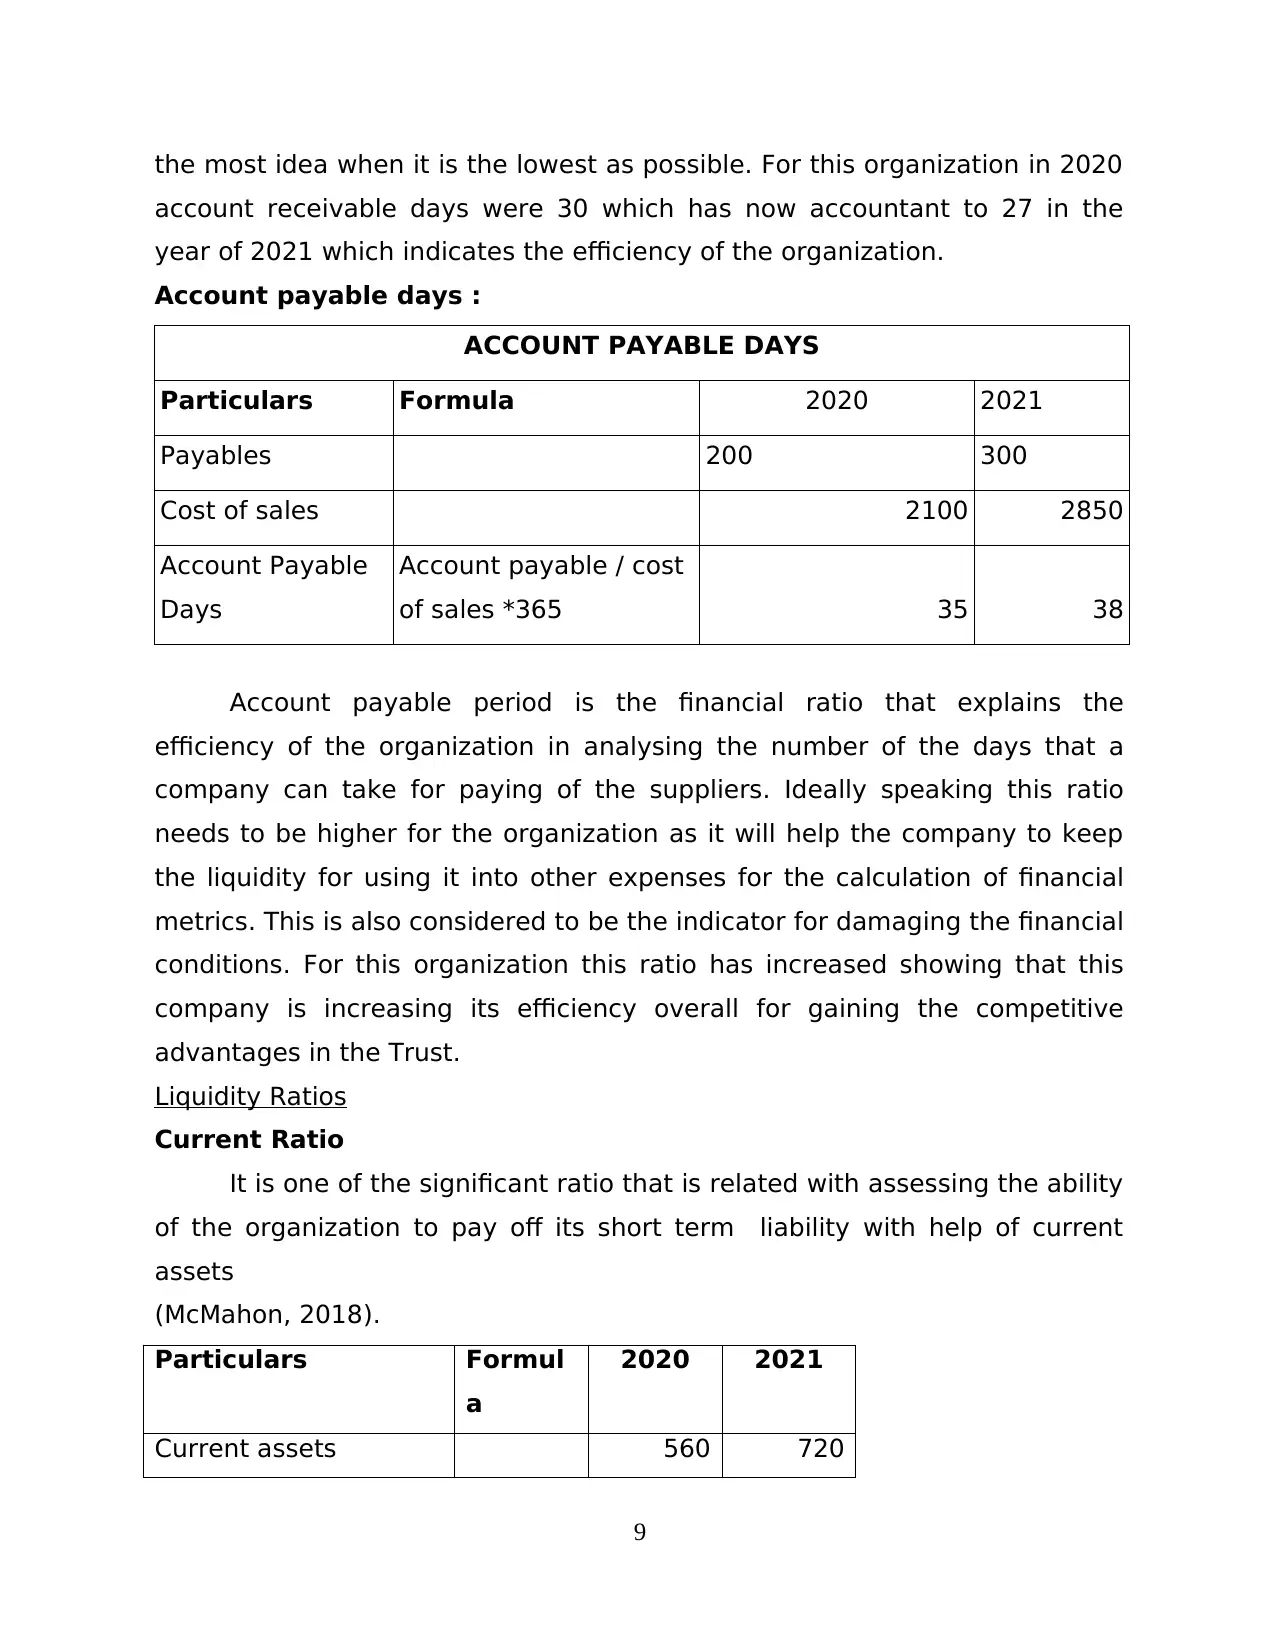
the most idea when it is the lowest as possible. For this organization in 2020
account receivable days were 30 which has now accountant to 27 in the
year of 2021 which indicates the efficiency of the organization.
Account payable days :
ACCOUNT PAYABLE DAYS
Particulars Formula 2020 2021
Payables 200 300
Cost of sales 2100 2850
Account Payable
Days
Account payable / cost
of sales *365 35 38
Account payable period is the financial ratio that explains the
efficiency of the organization in analysing the number of the days that a
company can take for paying of the suppliers. Ideally speaking this ratio
needs to be higher for the organization as it will help the company to keep
the liquidity for using it into other expenses for the calculation of financial
metrics. This is also considered to be the indicator for damaging the financial
conditions. For this organization this ratio has increased showing that this
company is increasing its efficiency overall for gaining the competitive
advantages in the Trust.
Liquidity Ratios
Current Ratio
It is one of the significant ratio that is related with assessing the ability
of the organization to pay off its short term liability with help of current
assets
(McMahon, 2018).
Particulars Formul
a
2020 2021
Current assets 560 720
9
⊘ This is a preview!⊘
Do you want full access?
Subscribe today to unlock all pages.
Trusted by 1+ million students worldwide
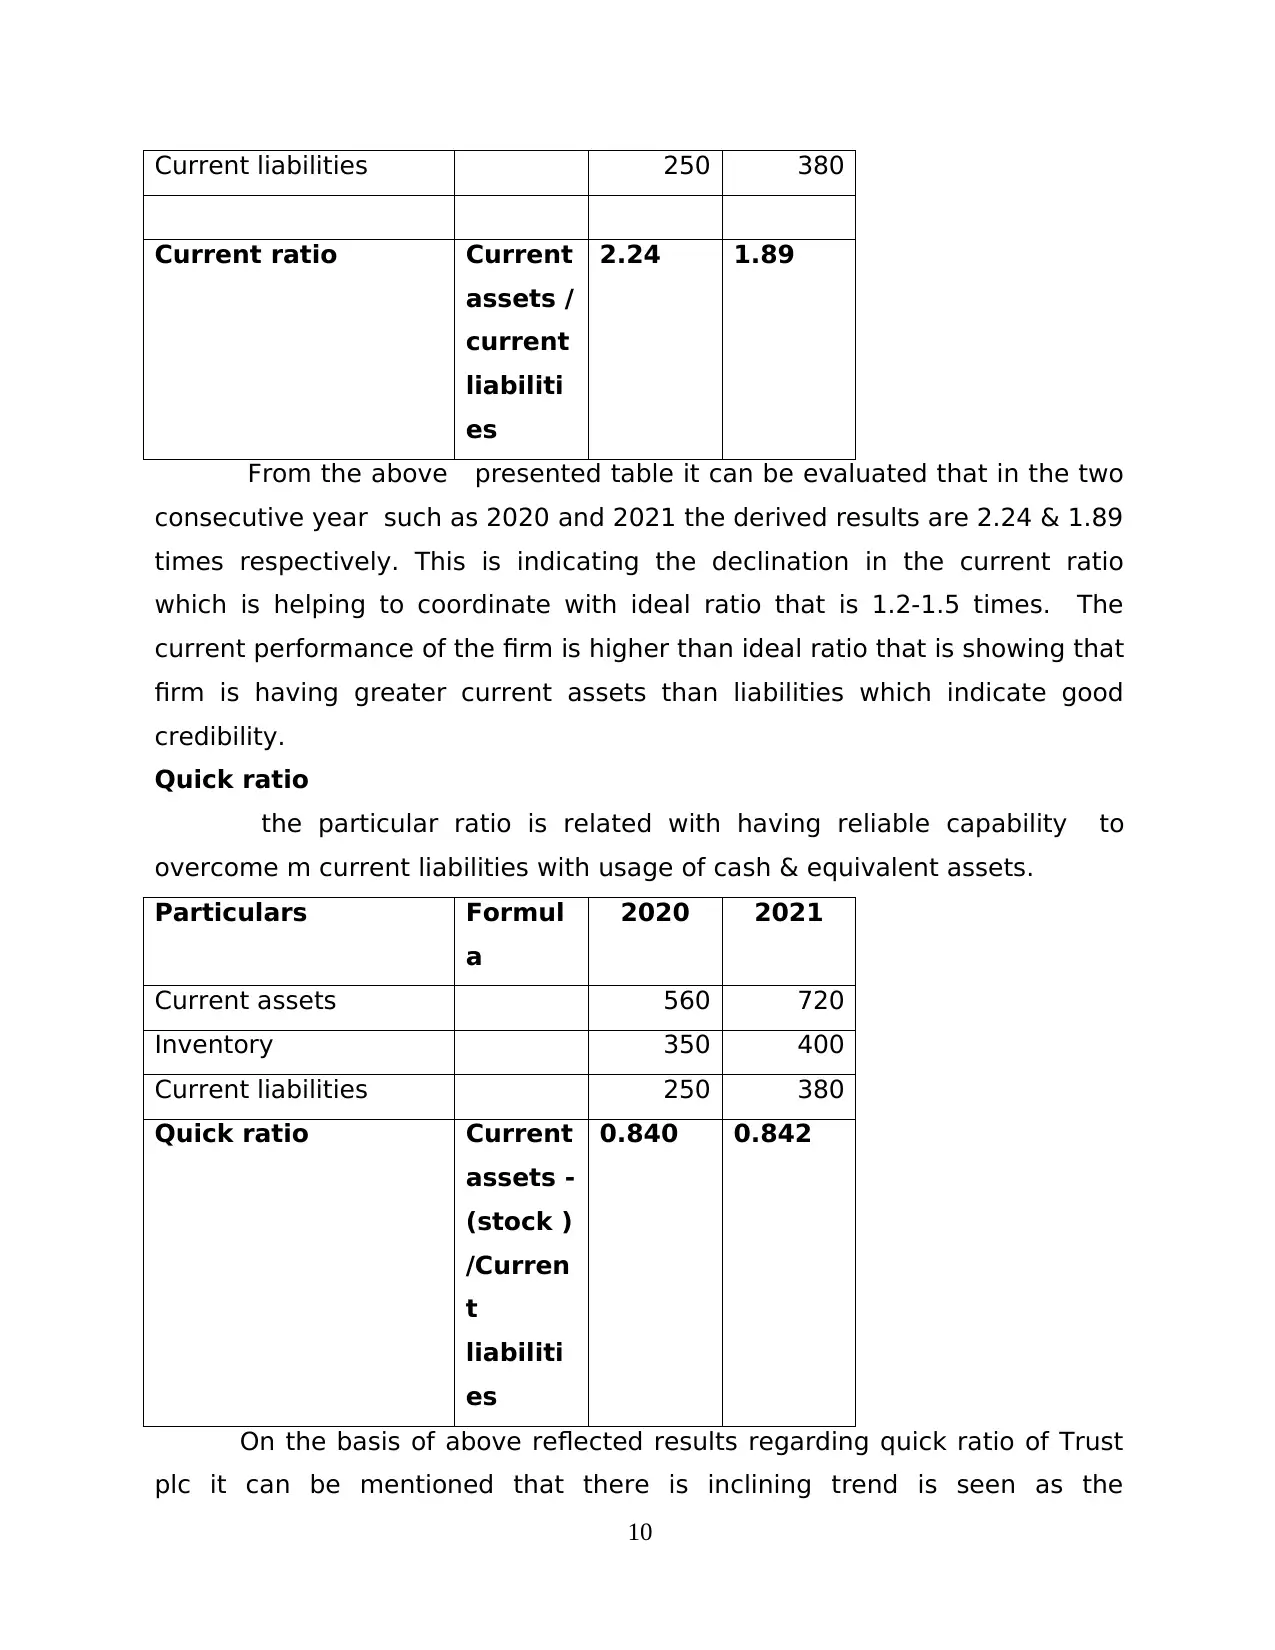
Current liabilities 250 380
Current ratio Current
assets /
current
liabiliti
es
2.24 1.89
From the above presented table it can be evaluated that in the two
consecutive year such as 2020 and 2021 the derived results are 2.24 & 1.89
times respectively. This is indicating the declination in the current ratio
which is helping to coordinate with ideal ratio that is 1.2-1.5 times. The
current performance of the firm is higher than ideal ratio that is showing that
firm is having greater current assets than liabilities which indicate good
credibility.
Quick ratio
the particular ratio is related with having reliable capability to
overcome m current liabilities with usage of cash & equivalent assets.
Particulars Formul
a
2020 2021
Current assets 560 720
Inventory 350 400
Current liabilities 250 380
Quick ratio Current
assets -
(stock )
/Curren
t
liabiliti
es
0.840 0.842
On the basis of above reflected results regarding quick ratio of Trust
plc it can be mentioned that there is inclining trend is seen as the
10
Paraphrase This Document
Need a fresh take? Get an instant paraphrase of this document with our AI Paraphraser
performance in the year 2021 has reached 0.842 from 0.840 times. In the
current year firm ha improved its performance as compared to year 2020
but lower than ideal ratio that is 1 times. This reflects poor performance of
the company that is required be improved. The firm should pay attention on
taking actions like better strategic planning, inclined sales & inventory
turnover so that improve outcomes can be derived. There are different
types of the stakeholders such as lenders, e creditors, etc that pay attention
on this ratio for making decision so making modification can help in
achieving significant outcome.
Investment ratios
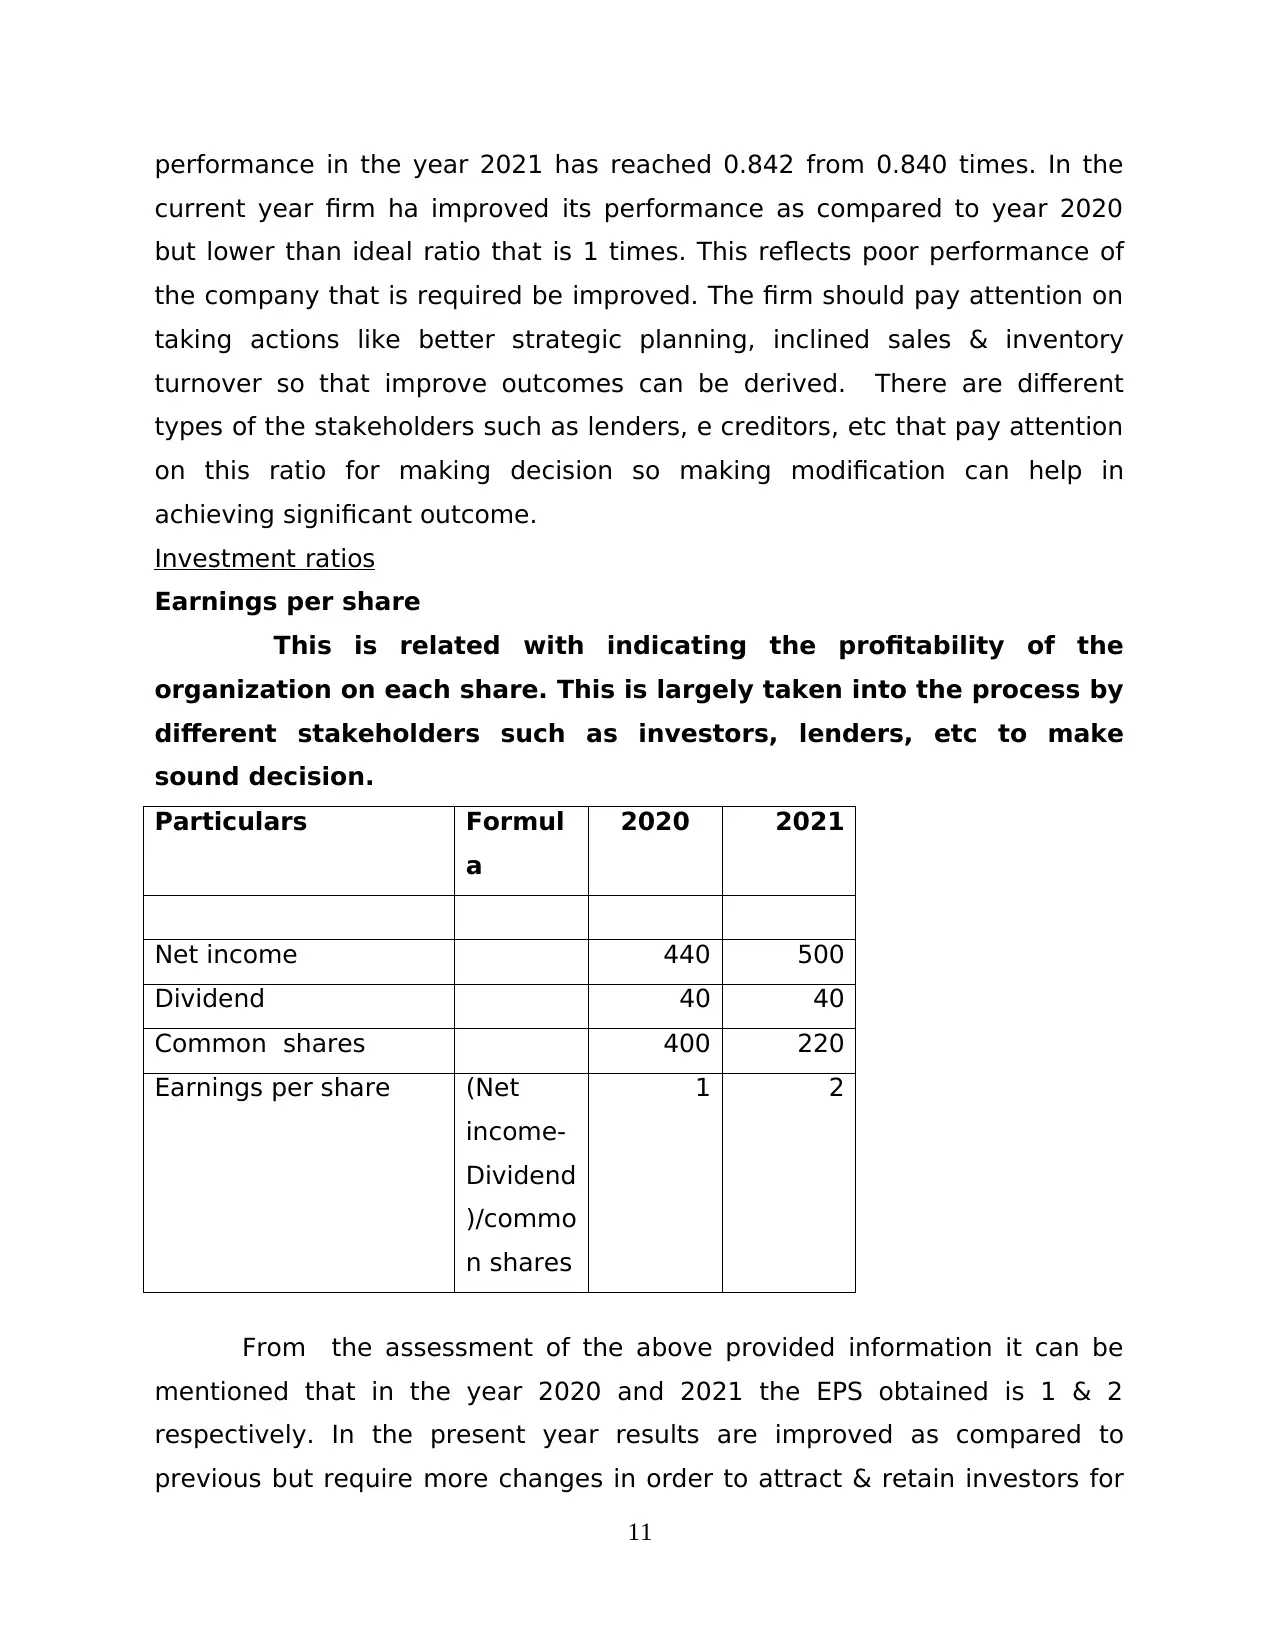
Earnings per share
This is related with indicating the profitability of the
organization on each share. This is largely taken into the process by
different stakeholders such as investors, lenders, etc to make
sound decision.
Particulars Formul
a
2020 2021
Net income 440 500
Dividend 40 40
Common shares 400 220
Earnings per share (Net
income-
Dividend
)/commo
n shares
1 2
From the assessment of the above provided information it can be
mentioned that in the year 2020 and 2021 the EPS obtained is 1 & 2
respectively. In the present year results are improved as compared to
previous but require more changes in order to attract & retain investors for
11
current year firm ha improved its performance as compared to year 2020
but lower than ideal ratio that is 1 times. This reflects poor performance of
the company that is required be improved. The firm should pay attention on
taking actions like better strategic planning, inclined sales & inventory
turnover so that improve outcomes can be derived. There are different
types of the stakeholders such as lenders, e creditors, etc that pay attention
on this ratio for making decision so making modification can help in
achieving significant outcome.
Investment ratios
Earnings per share
This is related with indicating the profitability of the
organization on each share. This is largely taken into the process by
different stakeholders such as investors, lenders, etc to make
sound decision.
Particulars Formul
a
2020 2021
Net income 440 500
Dividend 40 40
Common shares 400 220
Earnings per share (Net
income-
Dividend
)/commo
n shares
1 2
From the assessment of the above provided information it can be
mentioned that in the year 2020 and 2021 the EPS obtained is 1 & 2
respectively. In the present year results are improved as compared to
previous but require more changes in order to attract & retain investors for
11
the longer duration. On the basis of the provided information it can be
mentioned that higher earning per share is helpful in gaining the reliable
outcomes so that achieving stable position in sector for maintaining
competitiveness can be derived.
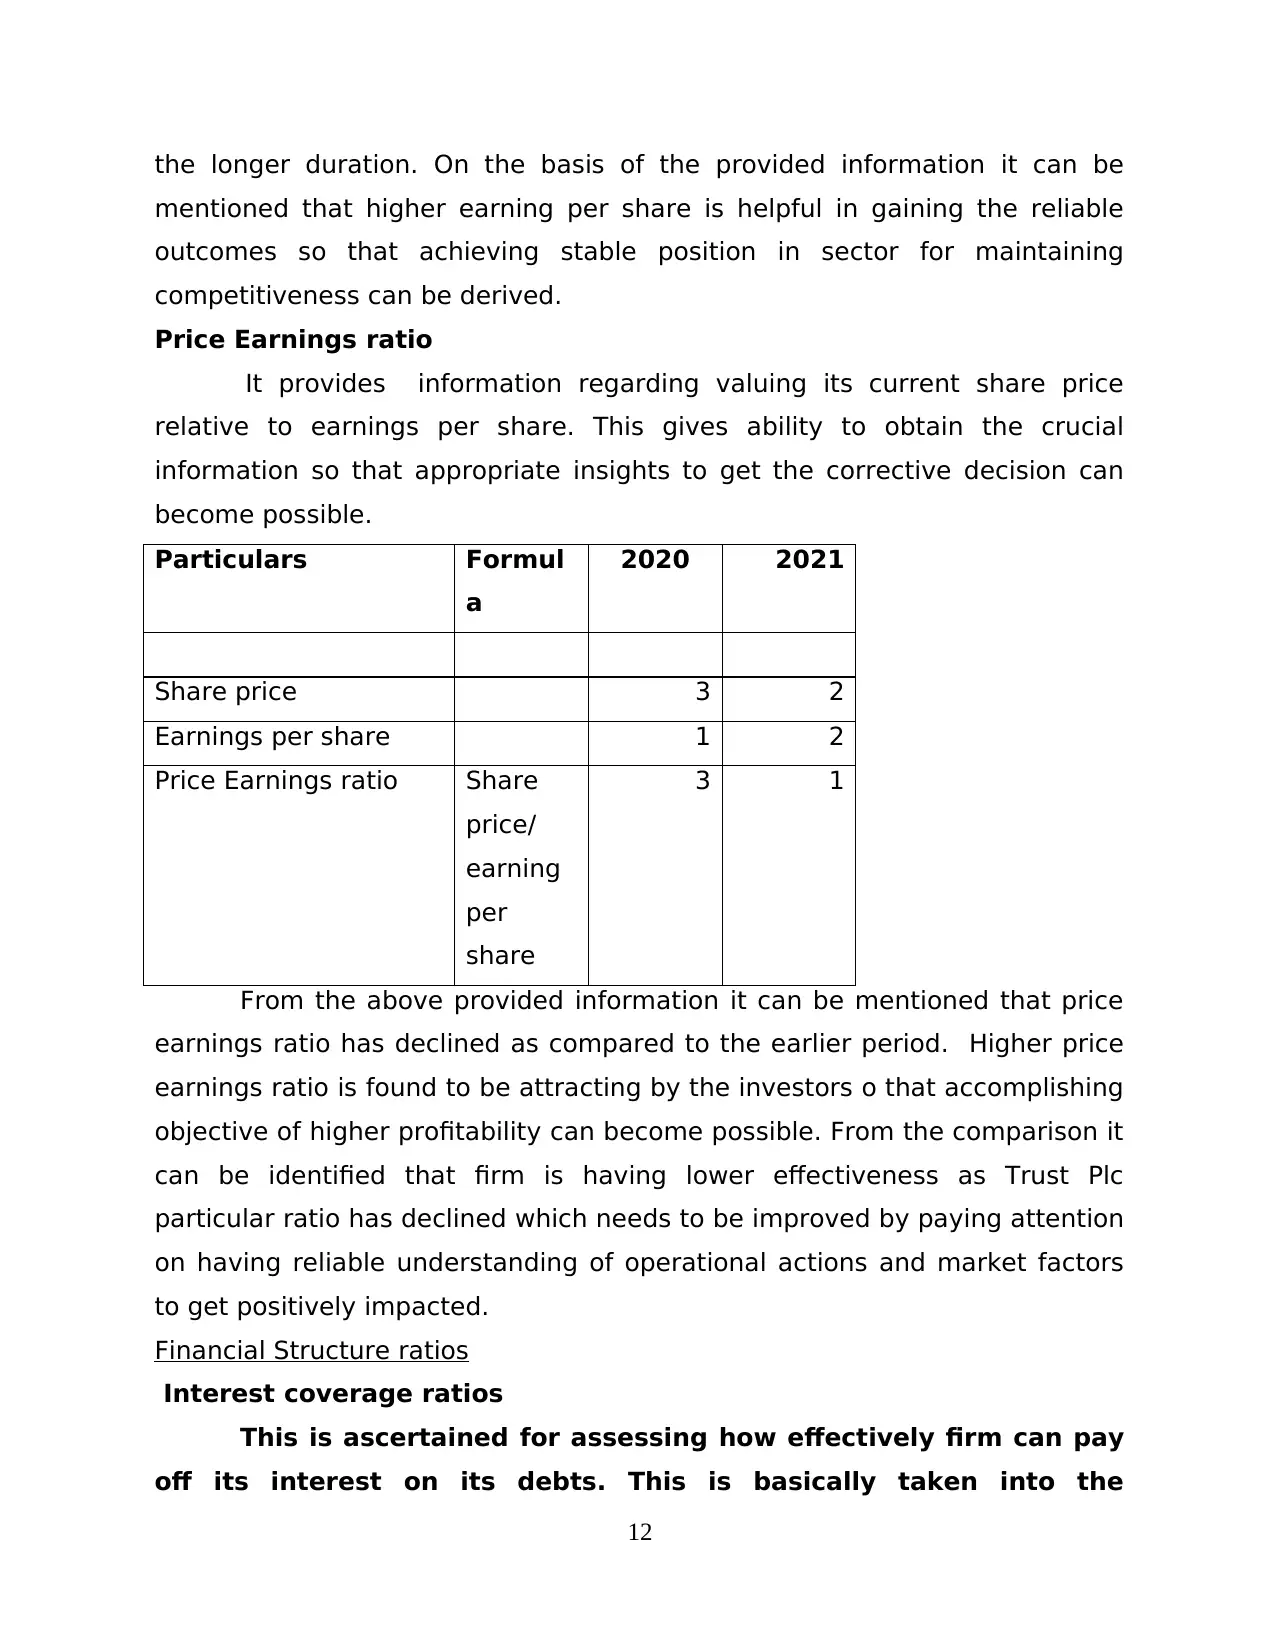
Price Earnings ratio
It provides information regarding valuing its current share price
relative to earnings per share. This gives ability to obtain the crucial
information so that appropriate insights to get the corrective decision can
become possible.
Particulars Formul
a
2020 2021
Share price 3 2
Earnings per share 1 2
Price Earnings ratio Share
price/
earning
per
share
3 1
From the above provided information it can be mentioned that price
earnings ratio has declined as compared to the earlier period. Higher price
earnings ratio is found to be attracting by the investors o that accomplishing
objective of higher profitability can become possible. From the comparison it
can be identified that firm is having lower effectiveness as Trust Plc
particular ratio has declined which needs to be improved by paying attention
on having reliable understanding of operational actions and market factors
to get positively impacted.
Financial Structure ratios
Interest coverage ratios
This is ascertained for assessing how effectively firm can pay
off its interest on its debts. This is basically taken into the
12
mentioned that higher earning per share is helpful in gaining the reliable
outcomes so that achieving stable position in sector for maintaining
competitiveness can be derived.
Price Earnings ratio
It provides information regarding valuing its current share price
relative to earnings per share. This gives ability to obtain the crucial
information so that appropriate insights to get the corrective decision can
become possible.
Particulars Formul
a
2020 2021
Share price 3 2
Earnings per share 1 2
Price Earnings ratio Share
price/
earning
per
share
3 1
From the above provided information it can be mentioned that price
earnings ratio has declined as compared to the earlier period. Higher price
earnings ratio is found to be attracting by the investors o that accomplishing
objective of higher profitability can become possible. From the comparison it
can be identified that firm is having lower effectiveness as Trust Plc
particular ratio has declined which needs to be improved by paying attention
on having reliable understanding of operational actions and market factors
to get positively impacted.
Financial Structure ratios
Interest coverage ratios
This is ascertained for assessing how effectively firm can pay
off its interest on its debts. This is basically taken into the
12
⊘ This is a preview!⊘
Do you want full access?
Subscribe today to unlock all pages.
Trusted by 1+ million students worldwide
1 out of 19
Related Documents


Your All-in-One AI-Powered Toolkit for Academic Success.
+13062052269
info@desklib.com
Available 24*7 on WhatsApp / Email
![[object Object]](/_next/static/media/star-bottom.7253800d.svg)
Unlock your academic potential
Copyright © 2020–2026 A2Z Services. All Rights Reserved. Developed and managed by ZUCOL.