Research Project: Effectiveness of Ratio Analysis in TESCO
VerifiedAdded on 2019/12/03
|31
|9080
|409
Report
AI Summary
This research project investigates the effectiveness of ratio analysis in the business decision-making process, using Tesco PLC as a case study. The report begins with an introduction to the background of the research, the organization (Tesco), the statement of the problem, aims and objectives, and the importance of the study. A comprehensive literature review follows, covering financial statement analysis, users of financial information, the importance and limitations of ratio analysis, and different types of ratios. The methodology section outlines the research approaches and methods employed. The data findings section presents ratio calculations and analysis, along with findings from a questionnaire. The results and discussion section interprets the data, followed by a discussion of the research's limitations and areas for further consideration. The research aims to determine how ratio analysis can aid shareholders, investors, suppliers, creditors, employees, managers, and other stakeholders in making informed decisions about a company's past performance, present condition, and future potential. The report emphasizes the role of financial ratios in assessing profitability, solvency, and overall financial health, providing insights into how these tools contribute to strategic decision-making within a major retail organization like Tesco.
Research Project
Effectiveness of Ratio Analysis
in business decision making
process: Study on TESCO
Effectiveness of Ratio Analysis
in business decision making
process: Study on TESCO
Secure Best Marks with AI Grader
Need help grading? Try our AI Grader for instant feedback on your assignments.
TABLE OF CONTENTS
1 INTRODUCTION........................................................................................................................1
1.1 Background of the research...................................................................................................1
1.2 Background of the organization.............................................................................................2
1.3 Statement of problem.............................................................................................................2
1.4 Aims & Objectives of the research........................................................................................3
1.5 Importance of the study.........................................................................................................3
2 LITERATURE REVIEW.............................................................................................................3
2.1 Introduction............................................................................................................................3
2.2 Financial statement analysis..................................................................................................4
2.3 Users of the financial information.........................................................................................4
2.4 IMPORTANCE RATIO ANALYSIS.....................................................................................5
2.5 Limitations of ratio analysis..................................................................................................6
2.6 Different types of ratios in ratio analysis...............................................................................7
3 RESEARCH APPROACHES & METHODS............................................................................11
3.1 Introduction..........................................................................................................................11
3.2 Research approaches............................................................................................................11
4 DATA FINDINGS......................................................................................................................15
4.1 Introduction..........................................................................................................................15
4.2 Ratio Calculation.................................................................................................................15
4.3 Ratio Analysis......................................................................................................................16
4.4 Findings from the questionnaire..........................................................................................19
RESULTS AND DISCUSSION....................................................................................................23
LIMITATIONS OF THE RESEARCH & AREAS OF FURTHER CONSIDERATION............24
CONCLUSION..............................................................................................................................24

REFERENCES..............................................................................................................................26
1 INTRODUCTION
1.1 Background of the research
Every kind of business whether it is small or big makes efforts to attain profitability and
solvency. Profitability is the situation which describes the ability of the company to make profits.
On the other side, solvency is the potential of the business to pay its debts as they come due
(Palepu and Healy, 2007). However it is not easy to attain these objectives. It requires efficient
management of business resources through forecasting, budgeting, planning, control and
decision making. Further there is a need to identify strength and weakness of the company and
then take corrective actions. Accounting offers that information which facilitates the above
functions (Ahrendsen and Katchova, 2012). Generally the accounting records and evaluates
economic information which is required for decision making. The information is derived from
three financial `statement produced by a company. These include balance sheet, income
statement and cash flow statement. The income statement reflects the profitability and
operational performance of the business and the balance sheet discloses the solvency position
(Argouslidis, 2008).
In order to judge the financial performance, profits related to various items in statements
are used as the basis. It helps in obtaining meaningful and useful information for decision
making. It is to be noted that due to the summarized nature of these documents, a lot of facts are
still undiscovered (Bennouna and Marchant, 2010). Hence for that purpose they are analyzed and
interpreted through the technique of ratio analysis. It enables the users to understand the meaning
of absolute amounts and to make informed business decisions. The business statements are
enclosed with lots of financial details which are hidden in the figures (Bourne, franco, and
Wilkes, 2006). These figures become more useful when they are related to each other or to some
other relevant financial data. Hence the users need to go further in order to establish relationship
among the data in the statements.
Ratio analysis is a tool which measures the company’s performance and contributes
towards making of many important business decisions. Ratios play an important role in the
business world (Cole, Branson and Breesch, 2012). It can be defined as a proportion or fraction
or percentage which expresses the relationship between different items in the financial statement.
The ratios are the most powerful tool which is used in evaluation and interpretation of
statements.
1
Secure Best Marks with AI Grader
Need help grading? Try our AI Grader for instant feedback on your assignments.
According to Ittelson, (2009), decision making is a conscious process of making choices
out of one or more alternatives with the purpose of moving towards some desired state of affairs.
The choices are related to the allocation and it ensures use of business resources to achieve
objectives. It is to be noted that decision making requires appropriate information (Siano,
Kitchen and Confetto, 2010). Managers require appropriate data so that they can make out
something meaningful and productive. Proper use of the data has to be ensured so that sound
decisions can be made. Decisions related to investment or disinvestment, make or buy, expansion
or contraction, etc. cannot be made without the use of financial ratios (Tracy, 2012). It gives an
idea about the financial strengths and weaknesses of a particular business and also highlights the
aspects which need further investigation.
This research study is being performed to reflect how tool of ratio analysis can help
shareholders, investors, suppliers, creditors, employees, managers and other stakeholder in
making their respective decisions. The decisions are taken about the past performance, present
condition and future potential of the company.
1.2 Background of the organization
Tesco PLC is a British Multinational grocery and general merchandise retailer. It is
headquartered in Cheshnut, Hertforshire in England. It is the third largest retailer across the
world in terms of profits. It holds the largest share in the retail market (Moyer, McGuigan and
Rao, 2011). It is greatest in terms of number of employees and number of stores. It is a leading
brand in the retail sector and that is the reason every investor keeps an eye on the share prices of
the company. Change in the share prices of Tesco affects investing decisions of several investors.
This research report identifies how technique of ratio analysis can be useful in taking of different
types of decisions. It will calculate the financial ratios for the Tesco and evaluates its business
performance. For this research, Tesco has been selected because it will be interesting to know
how decisions can be made within such big organization on the basis of ratio analysis. Further it
can be identified that, this tool is a good reflector of financial performance or not.
1.3 Statement of problem
Hence it is clear now that financial information offered in the statements is very useful in
taking business decisions. They act as a mean to achieve end and not an end in themselves. It is
2
evident that information is presented in summarized statements, so it needs to be interpreted by
using a suitable technique. It enables the management and stakeholder to understand and to make
well informed decisions. Further many users of these documents are not intellectual about the
accounting ratios and also do not know how they are applied. Despite of several advantages,
there are also many limitations associated with the use of ratio analysis. Hence this research is
undertaken to ensure that how this tool can be used in appropriate manner.
1.4 Aims & Objectives of the research
The major aim of the study is to identify the effectiveness of Ratio Analysis in business
decision making process. Following objectives have been framed:
To discover the importance of Ratio Analysis in decision making process
To identify the drawbacks of the Ratio Analysis for the business
To provide suggestions for improvements
Research question
Why business managers should rely on financial ratios for decision making?
1.5 Importance of the study
Every research has its own significance. This research will be carried out in order to find
out whether ratio analysis is an effective tool for decision making or not. The management of an
organization depends on the accounting information for taking various types of strategic
decisions (Palepu and Healy, 2007). This information is generated by analyzing and interpreting
the financial statements. A sustainable company like Tesco needs effective planning and good
financial management. This research will compute the accounting ratios for Tesco and then show
how decisions are made. Along with that it will also talk about the benefits and drawbacks of
using ratio analysis for decision making.
2 LITERATURE REVIEW
2.1 Introduction
Recording and summarising of the financial data are essential part of the accounting
information system. The financial statements are required to be analyzed and interpreted so that
3
truths hidden behind the information can be unveiled. Interestingly such analysis can be done on
the basis of ratio analysis and comparisons. Literature Review will reveal the theories and
concepts related to the analysis.
2.2 Financial statement analysis
According to Sabău, (2013), financial statement analysis consists of application of
analysis tools and technique so that meaningful information can be derived. The main purpose is
to establish relationship between various items contained in the statements. In this way various
conclusions are drawn about the past performance, existing position and future potential of the
company (Evans, and Porter, 2010). The analysis is done find out where the business is lacking
and how the improvements can be done. Most importantly it identifies the strengths and
weaknesses of the firm.
Business decision making is a difficult process as it requires consideration of different
types of factors. The decisions are taken after making some evaluations. It is considered as the
most important element in management of all the activities (Ainsworth and Deines, 2008).
Financial performance of the company is measured in order to find out how the business is
performing. There are different types of techniques for measuring the performance and ratio
analysis is one of them. Ratio Analysis is a quantitative analysis of information which is
contained in the company’s financial statements. It records the performance of the business in
terms of liquidity, profitability, solvency etc (Broadbent and Cullen, 2012). It applies different
types of ratios for the comparison of similar variables. It manipulates the figures in systematic
manner in order to produce information which is used in investment decision making process.
The trend of these ratios over time is studied in order to check whether they are improving or
deteriorating (Cadle and et.al., 2010). The analysis is regarded as the cornerstone of fundamental
analysis. This research is about investigating the effectiveness of ratio analysis in the business
decision making process within the context of Tesco.
2.3 Users of the financial information
The users of the financial information can be divided into two categories that is internal
users and external users (Ainsworth, and Deines, 2008). Their need can be described in the
following manner:
4
Paraphrase This Document
Need a fresh take? Get an instant paraphrase of this document with our AI Paraphraser
Management and Employees – The data helps the management and employees in
identifying the financial position, operating results and future potential of the company.
Employees can take decisions related to their career and growth opportunities (Broadbent
and Cullen, 2012)
Shareholders - It helps the shareholder to know about the return on their investments.
They can also ascertain the profitability of the company (Cadle, and et.all., 2010)
Investors & Creditors – Investors are interested in knowing the return on investments
within the business of the company. Creditors want to have a check on the payment
making ability of the organization (Dey, 2002). Financial information helps the creditors
to know about the liquidity of the firm to pay its debts when they fall due.
Debenture holders – The people who lend the money to the company would be interested
in knowing whether it is capable of repaying the both the interests and the principal on
maturity charged on the loan (Giacomello, 2008)
Financial analysts – These people need financial information so that they can offer
professional advice to the clients regarding the investments.
Tax authorities – These bodies makes sure that company fulfils the legal and regulatory
requirements related to the business (Harrison, and Horngren 2007). They want to make
sure that business is paying it taxes in timely manner.
Government – Government keeps an eye watch on the business practices of the firm.
Government expects that it does not indulge into wrong practices and activities.
2.4 IMPORTANCE RATIO ANALYSIS
Following are the advantages derived from the technique of ratio analysis:
Analysing the Financial Statements – The ratios are very useful in understanding the
financial position of the business. Different types of stakeholders such as management,
bankers, creditors etc make use of ratio analysis in order to fulfil their respective financial
objectives (Moyer, McGuigan and Rao, 2011).
Judging efficiency – It is a very effective tool in judging the efficiency of the
organization in terms of operations and management. It shows the ability of the business
related to utilization of assets and earning of profits (Palepu and Healy, 2007).
5
Identifying the weakness – It is also very effective in locating any kind of weakness or
errors within the business. By identifying the weakness, company can pay attention on
adopting remedial measures to remove the weakness
Formulating plans – Apart from evaluating the existing financial performance, ratios can
also be used to formulate future plans related to growth and development. It decides the
path of progress for the company (Ahrendsen and Katchova, 2012)
Comparing performance - It is very imperative for the organization to analyze how well it
is performing as compared to the other companies in the similar industry.
Trend analysis: By undertaking trend analysis organization can predict its performers that
whether it is increasing or decreasing over the coming years (Sinclair, Northcott and
Hooper, 2014). Through this, company is able to frame suitable strategies which help it in
taking advantage over others.
2.5 Limitations of ratio analysis
There are several limitations are prevailed in the ratio analysis which affects its
importance are enumerated below: Lack of standard: There is the lack universal standard regarding ratio analysis so it is
very difficult for the company to comment on the basis of the results of ratio analysis
(Cole, Branson and Breesch, 2012). Moreover, different company may use different
methods to assess its financial and liquidity position. It is one of the main aspects which
impact the utility of ratio analysis. Inflationary effects: Firm cannot undertake inflationary aspects or measures while
calculating the financial ratios (Ross, Westerfield and Jordan, 2015). Therefore, outcomes
of the ratio analysis will unable to give ideas in relation to the changes in price level. Not a substitute of financial statements: Techniques of ratio analysis can never be taken
as a substitute of the financial statements. It only summarizes the various aspects of
financial statements in the form of percentage (Moyer, McGuigan and Rao, 2011).
Only a Quantitative measure: It is only a quantitative measure of the organizational
performance. It exclusively states the liquidity, solvency and efficiency of the business
operations and activities. Nevertheless, it does not indicate the cause behind the poor
performance of the organization (Siano, Kitchen and Confetto, 2010). In addition to this,
6
ratio analysis techniques do not entails the effective measures which company needs to be
taken to improve the business operations. Window dressing: Different ratio are calculated with the help of the values financial
statements to assess the financial health and performance of the company. Nevertheless,
one can easily manipulate the values of the financial statements or misrepresents the fact.
It also negatively affects the utility of ratio analysis technique (Bennouna and Marchant
2010).
Changes in the accounting methods: Accounting methods which are used by the company
make impact upon the results of the ratio analysis. In this case, enterprise is not able to
compare its present performance with the past performance or results. For instance:
Corporation undertakes LIFO method to assess the value of the inventory in the current
financial year (Wahlen, Baginski and Bradshaw, 2014). Whereas it uses FIFO method in
the previous year for the same purpose then the value of stock and stock turnover ratio
deviates due to changes in the accounting methods.
2.6 Different types of ratios in ratio analysis
There are various types of ratios are prevailed in the techniques of ratio analysis. It
provides more assistance in making assessment of financial health and performance of the
organization which are enumerated below:
Profitability ratios
It indicates the efficiency and effectiveness of the business in making use of
organizational resources in order to earn more profit. This entails success or the failure of the
firm during a predetermined time period (Bourne, franco and Wilkes, 2006). Sound profitability
condition ensures and attracts more existing and potential stakeholders to make investment in the
organization.
Gross profit ratio (GP): It is the profitability measure which states the comparison of the
gross margin or cost of goods sold to net sales. It indicates efficiency and effectiveness of
the company in the selling of its goods or services (Cole, Branson and Breesch, 2012).
Through this, company can easily assess the effectiveness of its own strategies and
policies in achieving success. It also enables enterprise to compare its current
performance with the past where price fluctuations take place more frequently. GP
margin also provides deeper insight to company regarding the sales pattern (Nobes,
7
Secure Best Marks with AI Grader
Need help grading? Try our AI Grader for instant feedback on your assignments.
2014). On the basis this, firm can easily estimate the inventory level and manage cost
more effectively. To calculate GP ration firm can use the following formula to assess its
efficiency level such as follows:
Gross profit ratio: Gross profit/Net sales*100
Net profit ratio (NP): It is also known as NP ratio which states relationship between the
net profit after tax and sales of the company. One can calculate net profit by subtracting
company's expenses such as operating expenses, material and other costs from the total
revenue of the company (Sinclair, Northcott and Hooper, 2014). It is the strategic way
through company assess the level of expenditure and make control upon it. This measure
proves to be more beneficial for the company which helps it in increase profitability
margin. company can assess its net profit margin by undertaking the following formula:
Net profit ratio: Net profit/Net Sales*100 (Siano, Kitchen and Confetto ,2010)
Operating profit ratio: Operating profit ratio is also known as operating profit margin. It
states the percentage of revenue which left over with the company after the payment of
all the operating expenses. This ratio plays a significant from the investors or
shareholders point of views (Evans and Porter 2010). Operating profit margin indicates
the soundness of company's operation. Through this, company is able to attract more
investors because every person wants to invest in the organization whose business
operations are very sound and profitable (Freeman and et.al., 2014). It also assists
various stakeholders in determining the company's ability in running the smooth business
operations and functions. Operating profit or margin is calculated by deduction the
operating expenses, interest expenses, depreciation and tax from gross income or revue.
Formula to calculate the operating profit margin are given below:
Operating profit margin/ratio: Operating profit/Net sales*100
Liquidity ratios
Liquidity ratio defines the organizational abilities to meet or cover its short term
obligations which are due to the company. It helps enterprise in making effective decision in
relation to cash related activities such as investment etc. Further, this ratio also provides deeper
insight to the corporation about the assets which can be easily controverter into cash (Minnis and
Sutherland, 2014).
8
Current ratio: It is the financial measure which assesses the financial health and
performance of the company (Broadbent and Cullen, 2012). It states the firm's ability or
condition that whether or not it has the enough amount of fund to meet its current
obligation over the current assets of the company. It is also knows as working capital
ratio which helps enterprise in framing competent strategies (Sun, Roth and Black, 2014).
Through this, organization or other stakeholders can identify the financial capability and
soundness of the firm.
The ideal current ratio of the company is 2:1. It represents that to survive in the
competitive business environment firm needs to have 2 current assets to meet its 1 current
obligations (Bourne, franco and Wilkes, 2006). If company is very near to this ratio then it is
recognized as financially sound and strong. It plays a significant role in building and maintaining
faith of the stakeholders in the functions and operations of business organization. Formula of the
current ratio is as follows:
Current ratio: Current assets/Current liabilities
Quick ratio: It is also called as acid test ratio which are used by the organization to gauge
its financial performance. This ratio will help company in assessing the the cash and cash
equivalents which can be easily converted into cash. Nevertheless, current and which
ratio differs significantly (Pal, Mehra and Pal, 2015). As company excluded inventory
while calculating the quick ratio because inventory might not turn into cash quickly.
Quick ratio considers marketable securities and account receivable which can be change
into a liquid from within the 90 days. One can calculate the quick ratio of the company by
using the following formula:
Quick ratio: Cash and cash equivalents + marketable securities+ accounts receivable
/Current liabilities (Siano, Kitchen and Confetto, 2010)
Efficiency ratios
This ratio states the firm's ability that how successfully the firms use its asset and there
by improves profitability. Besides this, it also shows the firm's ability in managing its liabilities.
In order to cope up with the dynamic business environment each and every requires to take
effective use of its assets to attain high level of profitability (Templeton and et.al., 2014). It
enables company to take competitive advantage over others and there by fulfilling organizational
aims and objectives.
9
Total asset turnover ratio: It is the measure which enables company to assess its
effectiveness in making use of the long term and short assets. This ratio will help
manager in assessing the success or failure of the assets (Evan and Porter, 2010). Total
asset turnover ratio provides idea to the manager about the isolation of plant and
machinery. It helps company in making right decision about the sales of the asset at the
right time and thereby improving the sales revenue.
Asset turnover ratio: Net sales / Total assets
Inventory turnover ratio: It helps in determining the capability of the company in
managing its inventory level. If it is too low then it indicates that firm fails to manage its
inventory and faces difficulties in pushing sales to customers (Burt and Amin, 2014). In
contrary to this, if inventory turnover ratio of the company is high then it shows that
inventory policy of the company is sound and it should follow the existing strategy to
manage its inventory level. It can measured as: (Cole, Branson and Breesch, 2012)
Inventory turnover ratio: Cost of goods sold / Average inventory
Gearing or Solvency ratios
Solvency ratio defines the cash position of the firm which encompasses that it is able to
meet its short term and long term liabilities.
Debt-equity ratio: This ratio shows the relative proportion of shareholders and debt which
are used by the corporation to finance the assets. To become a sound and well organized
firm, enterprise needs to make efforts so they come to near ideal debt equity ratio which
is .5:1 It represents that organization needs to raise more finance through equity shares
rather than debt (Siano, Kitchen and Confetto, 2010). Moreover, when company raise
finance through debt then it has to pay interest to the debt holders whether firm make
profit or not. In case of shares, company have no compulsion in relation to the payment
of dividend and there by reduces the financial burden (Erasmus and et.al., 2015). But
organization requires paying dividend to shareholders whenever it makes profit to
maintain faith of the investors in business operations.
Debt-equity ratio: Debt / Equity
Times interest ratio: time interest ratio is also known as time coverage ratio which
measures the proportionate income which company can use in meeting its interest
expenses (Bennouna and Marchant, 2010). It states firm ability to make debt interest
10
Paraphrase This Document
Need a fresh take? Get an instant paraphrase of this document with our AI Paraphraser
payment on time. It helps company in raising fund through debt instruments.
Organization can assess time interest ratio with the help of following formula such as:
Times interest ratio: Net income/ Interest expenses
Accounts receivable turnover: It entails that how many times company is able collect its
receivables from the debtors. It is the measure which enables company to identify the
period during which it is able to generate cash (Togashi and et.al., 2014). It also helps
company in making further investment and other cash related decisions.
Accounts receivable turnover: Net credit sales / Net receivables
Payment turnover ratio: It states the ability of the firm in relation to the payment of credit
purchase within a period (Perini and et.al., 2014). If company fails to make payment to
the supplier within a short period then it states that financial condition of the firm is too
weak. Through this, company is able to take corrective measure on time and take benefit
from it.
Payment turnover ratio: Net credit purchase / Average accounts payable (Siano, Kitchen,
and Confetto, 2010)
3 RESEARCH APPROACHES & METHODS
3.1 Introduction
It includes the methodology section of the research. It consists of research tools and
techniques which help in the data collection for the study. These tools help in achieving the
stated goals and objectives of the research. This section is very important from the research point
of view (Arthur, and et.al., 2012). It is the background against which the researcher evaluates the
findings and the conclusions.
3.2 Research approaches
Research Design
Research design is the blue print of the research. The study has used the survey design to
find out the effectiveness of the ratio analysis in making business decisions. It is appropriate for
the research because the study is descriptive and analytical in nature (Bruce and Martin 2012). It
is expected that this design will achieve the goals and objectives of the study.
Data Collection
11
There are two main source of data collection which can be described as follows:
Primary Sources – It is the first hand information which is collected by the researcher
himself. It is very raw and fresh in nature. It is available through techniques such as
questionnaire, interview, focus group, direct observation (Chilisa, 2012). For this study
primary data has been collected through questionnaire approach. It is appropriate because
it helps in gathering large volume of data.
Secondary sources – It is the data available from published sources such as books,
journals, magazines, newspapers, articles etc. For this research secondary information has
been collected from company’s website, annual reports, journals, books etc (Dr. Lazar,
Dr. Feng and Dr. Hochheiser 2010).
Sampling
Sampling is done to identify the representative sample for the research from which the
valuable information can be obtained. This activity makes the data collection work easier and
simpler. For this research, purposive sampling has been applied. It is suitable because it helps in
selecting the sample on the basis of preference. The data has been collected from 10 managers of
Tesco. This sample size is appropriate according to the size and scale of the study.
Instrument for data collection
Data Collection is the most important part of the research. Secondary data is the
something that is available from published sources. It is available for use by anyone. For this
study, data will be collected from secondary sources such as books, journals, newspapers,
internet, annual reports of Tesco, etc (Giacomello, 2008). Questionnaire has been designed for
the data collection and analysis. The questionnaire used for the research is made up of 10
questions. It is constructed in a manner that alternative answers were produced for the
respondents (Kallio and Kallio, 2014). Questionnaires were distributed on random basis. It was
appropriate for the study because this tool helps in collecting large volume of data.
Data Analysis
For the purpose of data evaluation, technique of ratio analysis will be used. This tool will
judge the financial performance of Tesco on the basis of liquidity, solvency and turnover ratios.
This data analysis plan is appropriate because it fulfils the purpose of the study (Dey, 2002).
12
Along with that data collected from the questionnaire process has been presented in form of
graphs, tables and pie charts.
Ethical consideration
There are some ethical considerations associated with the research. Data has been
collected from valid and authentic sources. Further no manipulation has been done with the
information and it is presented in the same manner as it was derived (Kothari, 2004). During the
questionnaire process, complete freedom and liberty has been given to the participants. Before
commencing the process, goals and objectives were communicated to them in proper manner. No
data has been obtained directly from any source (Kotzab and et.al., 2006). Proper referencing and
citation has been done.
Research Limitations
Following limitations were encountered while the course of the research:
Lack of time
Lack of data
Convincing the participants
Pressure of quality (Walliman, 2011)
13
Secure Best Marks with AI Grader
Need help grading? Try our AI Grader for instant feedback on your assignments.
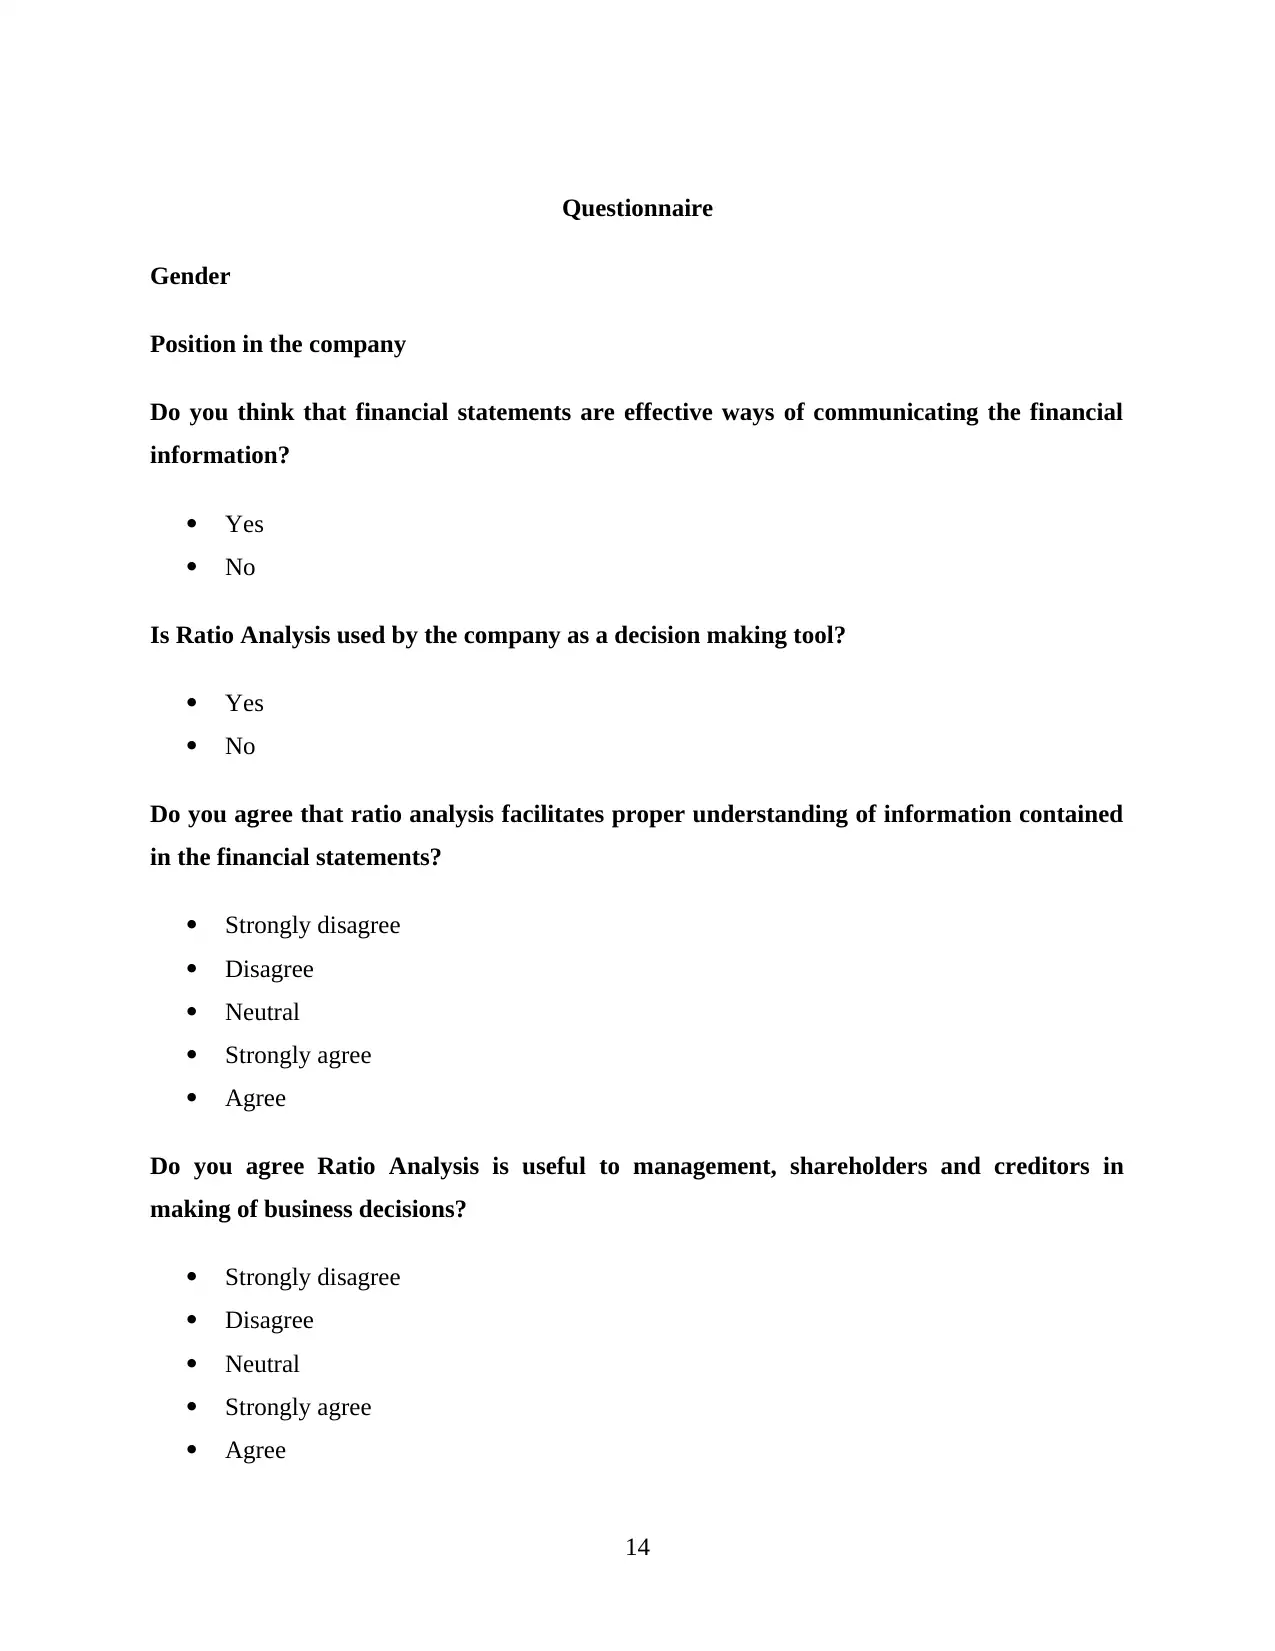
Questionnaire
Gender
Position in the company
Do you think that financial statements are effective ways of communicating the financial
information?
Yes
No
Is Ratio Analysis used by the company as a decision making tool?
Yes
No
Do you agree that ratio analysis facilitates proper understanding of information contained
in the financial statements?
Strongly disagree
Disagree
Neutral
Strongly agree
Agree
Do you agree Ratio Analysis is useful to management, shareholders and creditors in
making of business decisions?
Strongly disagree
Disagree
Neutral
Strongly agree
Agree
14
Do you think that financial ratios are useful in evaluating the performance of a business?
Yes
No
Do you think obstacles arise in the use of ratio analysis in taking of business decisions?
Yes
No
Does financial ratios are very effective in revealing the hidden truth within the financial
statements?
Yes
No
4 DATA FINDINGS
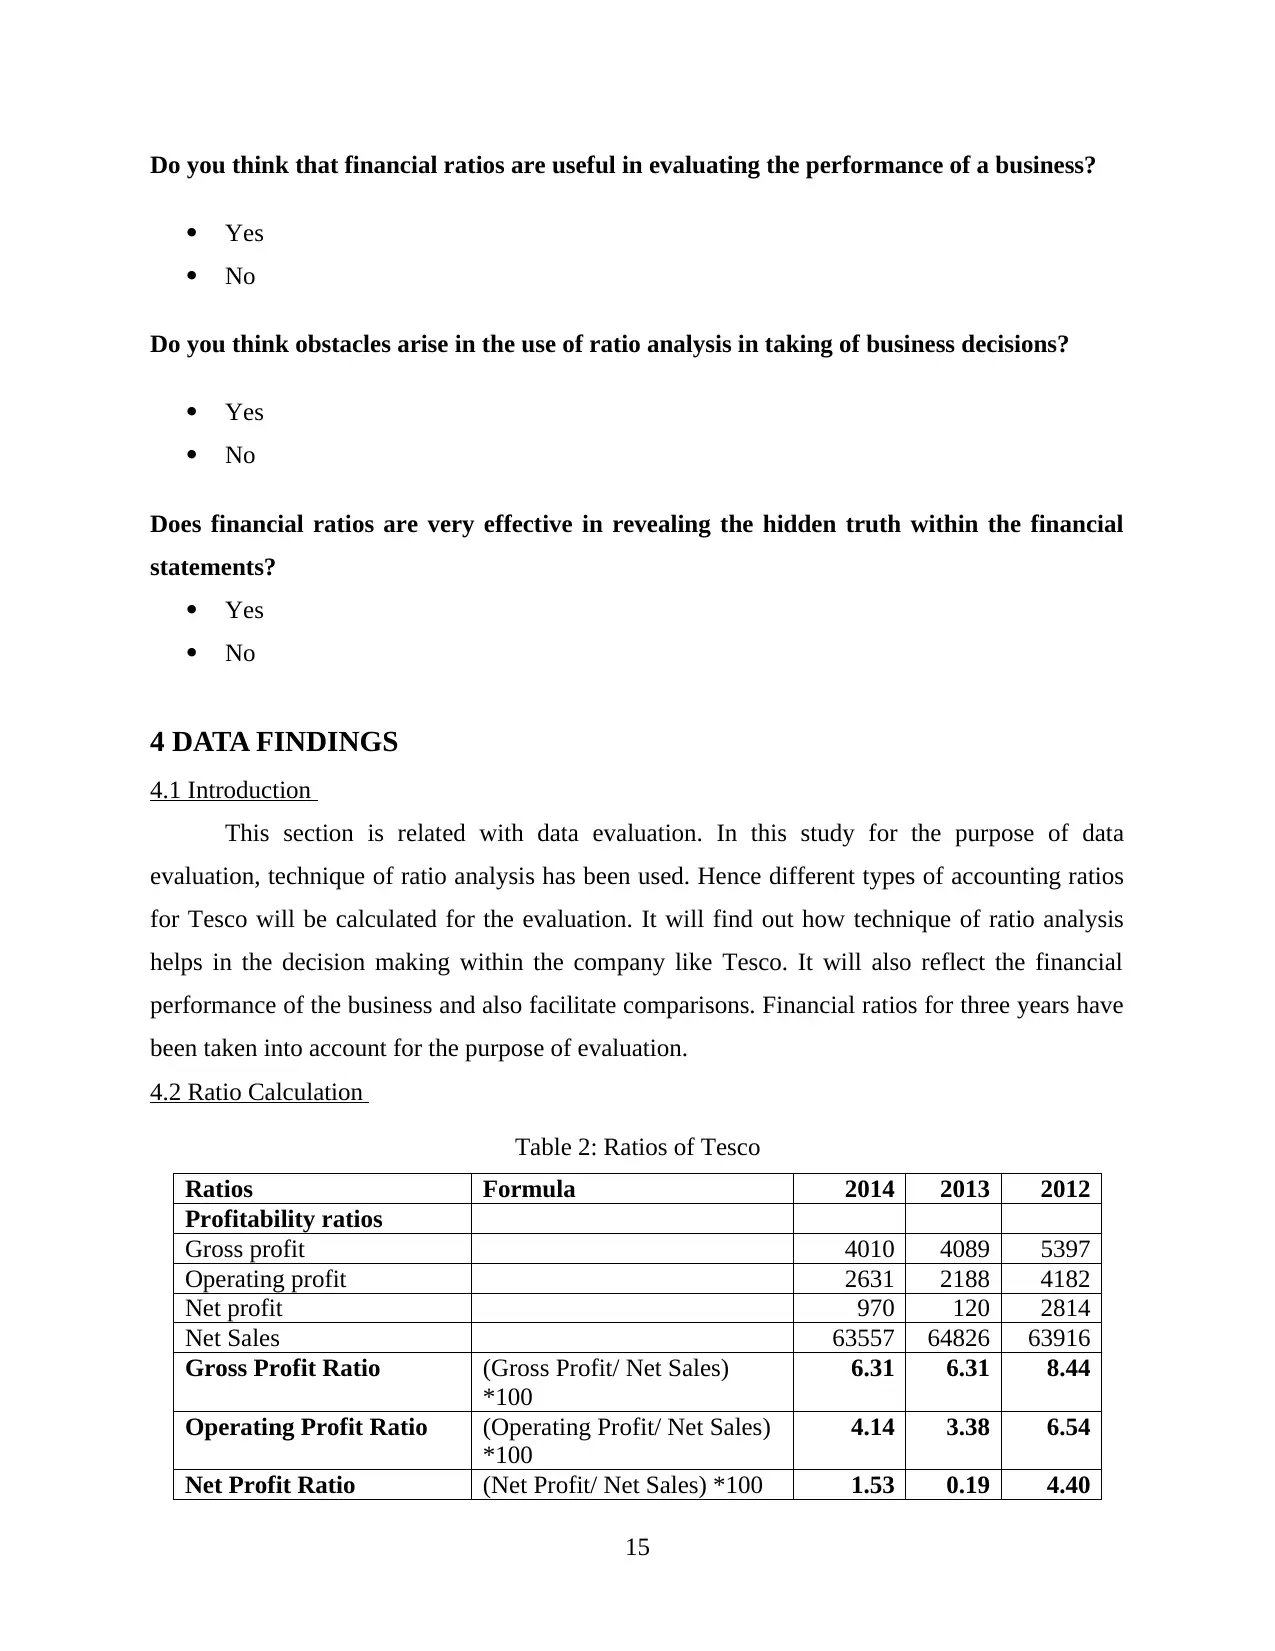
4.1 Introduction
This section is related with data evaluation. In this study for the purpose of data
evaluation, technique of ratio analysis has been used. Hence different types of accounting ratios
for Tesco will be calculated for the evaluation. It will find out how technique of ratio analysis
helps in the decision making within the company like Tesco. It will also reflect the financial
performance of the business and also facilitate comparisons. Financial ratios for three years have
been taken into account for the purpose of evaluation.
4.2 Ratio Calculation
Table 2: Ratios of Tesco
Ratios Formula 2014 2013 2012
Profitability ratios
Gross profit 4010 4089 5397
Operating profit 2631 2188 4182
Net profit 970 120 2814
Net Sales 63557 64826 63916
Gross Profit Ratio (Gross Profit/ Net Sales)
*100
6.31 6.31 8.44
Operating Profit Ratio (Operating Profit/ Net Sales)
*100
4.14 3.38 6.54
Net Profit Ratio (Net Profit/ Net Sales) *100 1.53 0.19 4.40
15
Yes
No
Do you think obstacles arise in the use of ratio analysis in taking of business decisions?
Yes
No
Does financial ratios are very effective in revealing the hidden truth within the financial
statements?
Yes
No
4 DATA FINDINGS
4.1 Introduction
This section is related with data evaluation. In this study for the purpose of data
evaluation, technique of ratio analysis has been used. Hence different types of accounting ratios
for Tesco will be calculated for the evaluation. It will find out how technique of ratio analysis
helps in the decision making within the company like Tesco. It will also reflect the financial
performance of the business and also facilitate comparisons. Financial ratios for three years have
been taken into account for the purpose of evaluation.
4.2 Ratio Calculation
Table 2: Ratios of Tesco
Ratios Formula 2014 2013 2012
Profitability ratios
Gross profit 4010 4089 5397
Operating profit 2631 2188 4182
Net profit 970 120 2814
Net Sales 63557 64826 63916
Gross Profit Ratio (Gross Profit/ Net Sales)
*100
6.31 6.31 8.44
Operating Profit Ratio (Operating Profit/ Net Sales)
*100
4.14 3.38 6.54
Net Profit Ratio (Net Profit/ Net Sales) *100 1.53 0.19 4.40
15
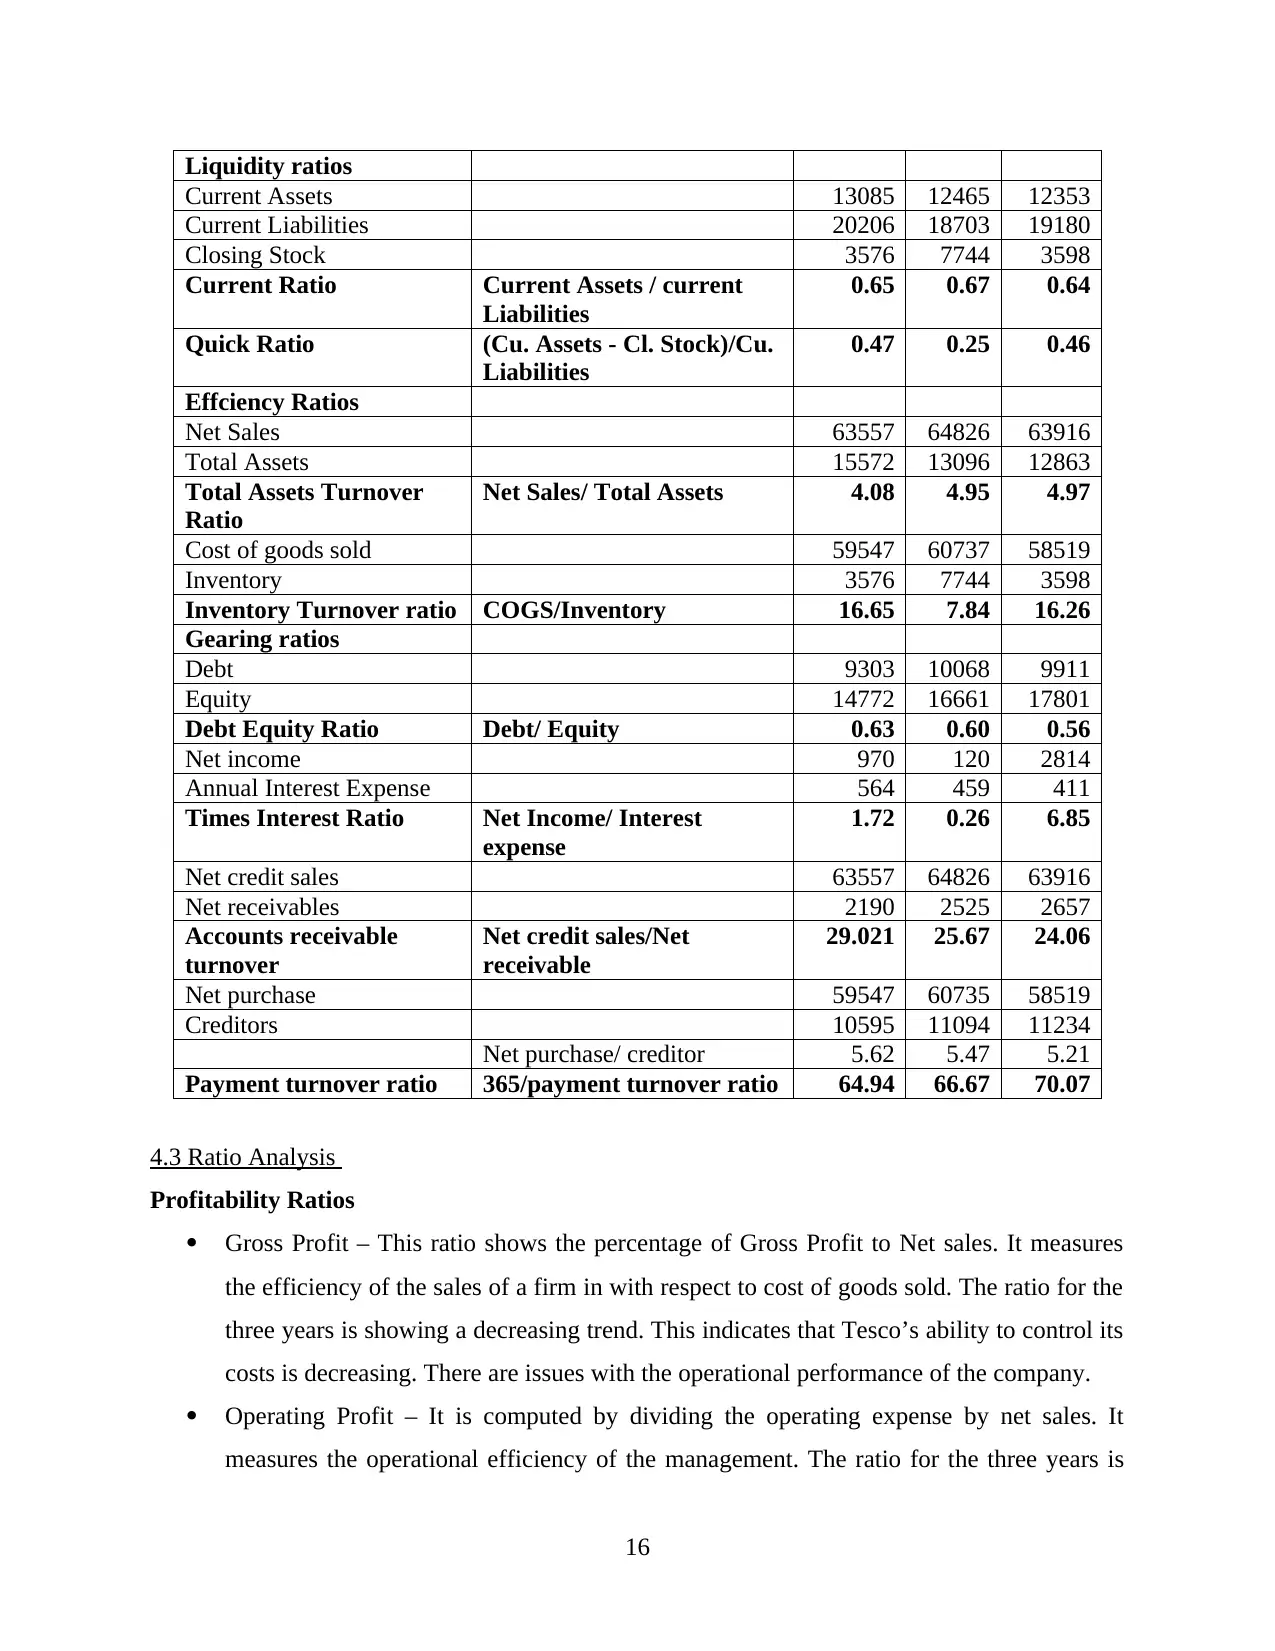
Liquidity ratios
Current Assets 13085 12465 12353
Current Liabilities 20206 18703 19180
Closing Stock 3576 7744 3598
Current Ratio Current Assets / current
Liabilities
0.65 0.67 0.64
Quick Ratio (Cu. Assets - Cl. Stock)/Cu.
Liabilities
0.47 0.25 0.46
Effciency Ratios
Net Sales 63557 64826 63916
Total Assets 15572 13096 12863
Total Assets Turnover
Ratio
Net Sales/ Total Assets 4.08 4.95 4.97
Cost of goods sold 59547 60737 58519
Inventory 3576 7744 3598
Inventory Turnover ratio COGS/Inventory 16.65 7.84 16.26
Gearing ratios
Debt 9303 10068 9911
Equity 14772 16661 17801
Debt Equity Ratio Debt/ Equity 0.63 0.60 0.56
Net income 970 120 2814
Annual Interest Expense 564 459 411
Times Interest Ratio Net Income/ Interest
expense
1.72 0.26 6.85
Net credit sales 63557 64826 63916
Net receivables 2190 2525 2657
Accounts receivable
turnover
Net credit sales/Net
receivable
29.021 25.67 24.06
Net purchase 59547 60735 58519
Creditors 10595 11094 11234
Net purchase/ creditor 5.62 5.47 5.21
Payment turnover ratio 365/payment turnover ratio 64.94 66.67 70.07
4.3 Ratio Analysis
Profitability Ratios
Gross Profit – This ratio shows the percentage of Gross Profit to Net sales. It measures
the efficiency of the sales of a firm in with respect to cost of goods sold. The ratio for the
three years is showing a decreasing trend. This indicates that Tesco’s ability to control its
costs is decreasing. There are issues with the operational performance of the company.
Operating Profit – It is computed by dividing the operating expense by net sales. It
measures the operational efficiency of the management. The ratio for the three years is
16
Paraphrase This Document
Need a fresh take? Get an instant paraphrase of this document with our AI Paraphraser
showing a fluctuating trend which means Tesco must concentrate on improving its
operational performance. The ratio needs to be stagnant.
Net Profit Ratio – It shows the ability of the company to control operating and non-
operating expenses. Decrease in the net profit ratio can be noticed. It shows that Tesco is
finding difficult to control its operating and non-operating expenses.
Liquidity Ratio
Current Ratio – It evaluates the short term solvency position of the company. The ratio
for the three years is showing a very consistent trend but it is very low from business
point of view. It shows that Tesco is finding issues in fulfilling its short term obligations.
Quick ratio - It examines the potential of the company in paying its short term debts. It
measures the relationship between liquid assets and current liabilities. The ratio appears
to be less than 1 which indicates that company is having fast moving inventories.
Efficiency Ratios
Total Assets Turnover Ratio – It measure the efficiency of the assets within the company.
Tesco has able to maintain a very successful assets turnover ratio in the last three years. It
means every dollar invested in the assets of Tesco produces 4.50% of the sales. It means
company is using its assets in best manner.
Inventory turnover ratio – It evaluate the liquidity of inventories of an organization. It
shows how many times the inventory has been replaced and sold during a certain period
of time. This ratio for the three years is showing a very fluctuating trend. Tesco takes 28
days to sell its average inventory. It shows that there is a very effective management of
stocks and it is possible through effective supply chain management.
Gearing Ratios
Debt to Equity ratio – This ratio reflects the soundness of the long term financial
policies of the company. The ratio for the three years is maintained around less than 0.
A less than 1 ratio indicates that portion of assets contributed by the stockholders is
higher than the portion of assets contributed by creditors. However Tesco has the
potential to maintain a high debt to equity ratio because it is a global brand and having
presence in several countries.
Times Interest Ratio – This ratio indicates how many times the annual interest expenses
are covered through net operating income of the business. It is a long term solvency
17
ratio which highlights the potential of a firm to pay it interest charges as they become
due. The ratio is reflecting a downward trend and it is not a good sign. It is a weak
position and Tesco may have to face difficulties in raising funds for the operations.
Account Receivable Turnover – It measures how many times the business has collected
the receivable during a particular period. The ratio for the three years is showing an
increasing trend. It indicates that receivables are more liquid and are being collected
very promptly within Tesco.
Payment Turnover ratio – It shows the average time taken by the company in making its
payments to the creditors. The ratio is showing a decreasing trend and this is a sign of
prompt payments to the creditors. The creditworthiness of the Tesco is very good in the
market.
18
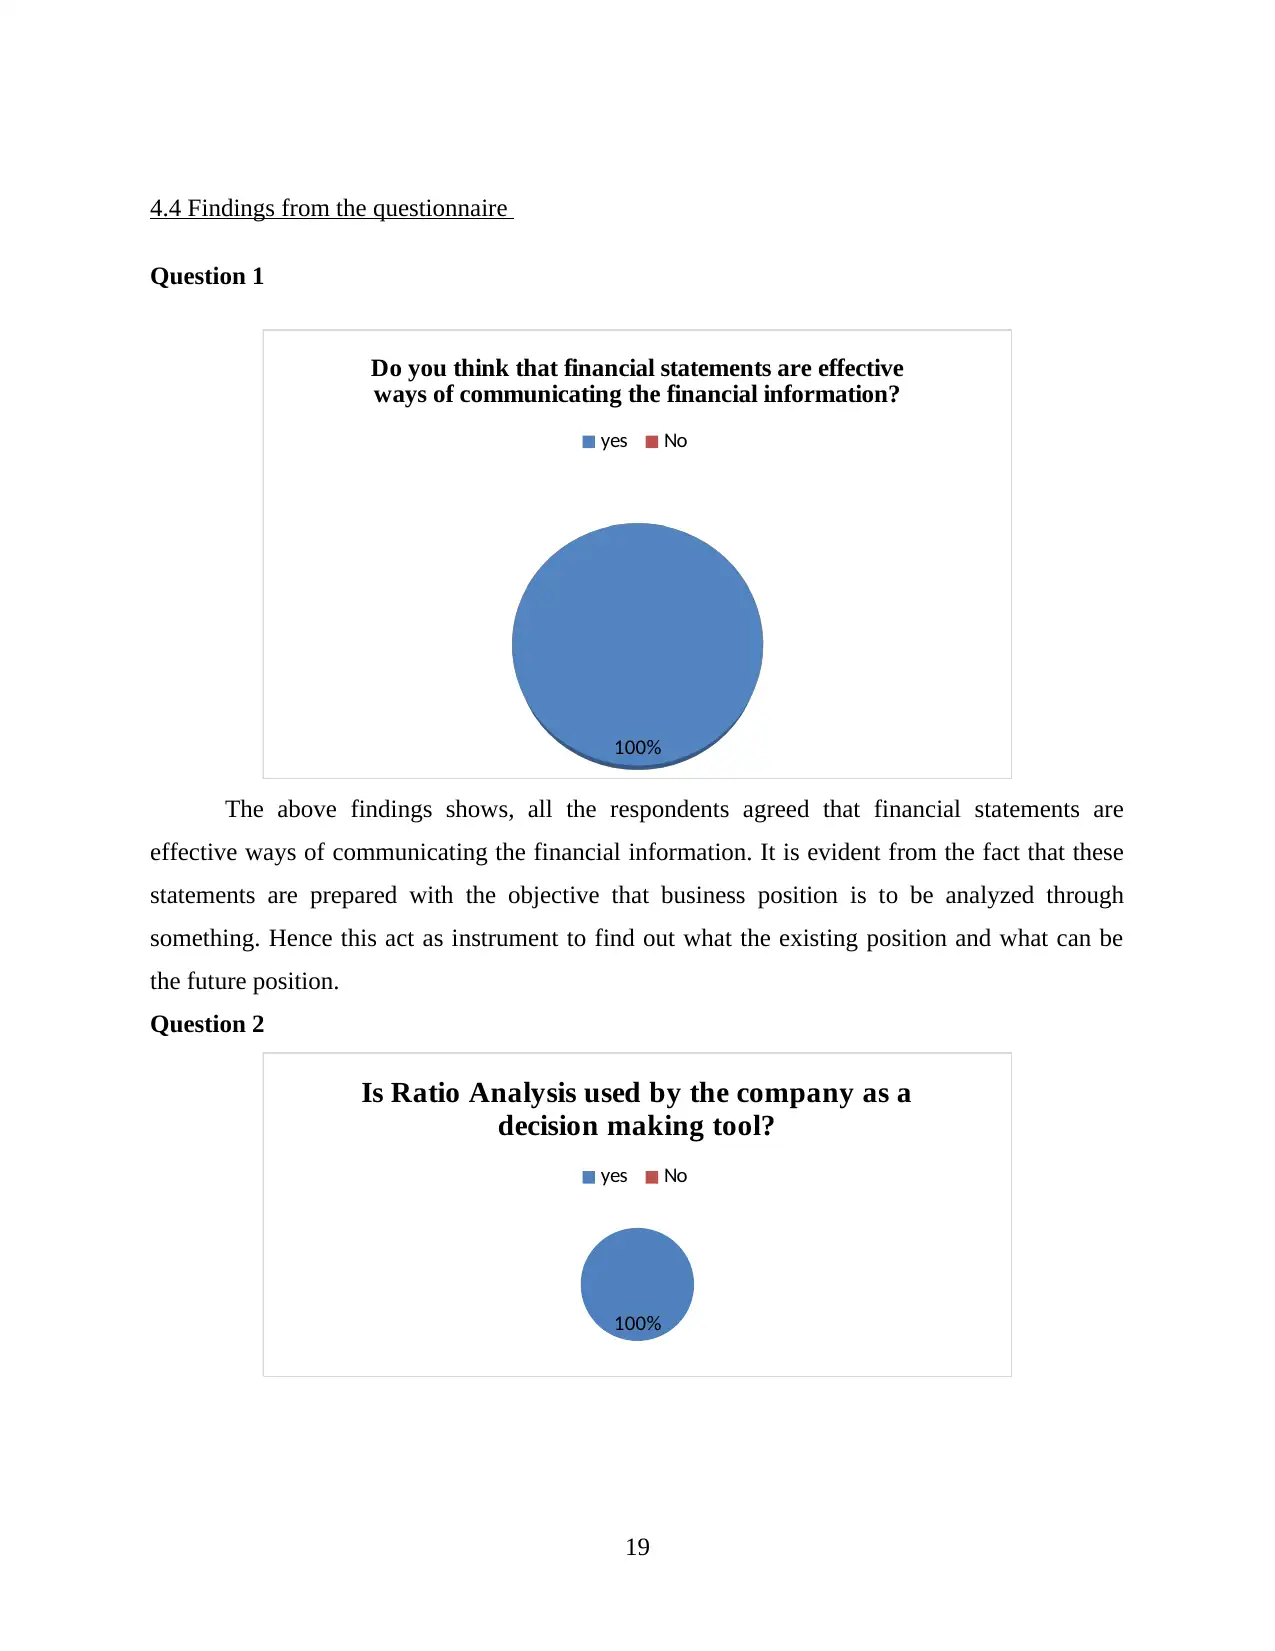
4.4 Findings from the questionnaire
Question 1
100%
Do you think that financial statements are effective
ways of communicating the financial information?
yes No
The above findings shows, all the respondents agreed that financial statements are
effective ways of communicating the financial information. It is evident from the fact that these
statements are prepared with the objective that business position is to be analyzed through
something. Hence this act as instrument to find out what the existing position and what can be
the future position.
Question 2
100%
Is Ratio Analysis used by the company as a
decision making tool?
yes No
19
Secure Best Marks with AI Grader
Need help grading? Try our AI Grader for instant feedback on your assignments.
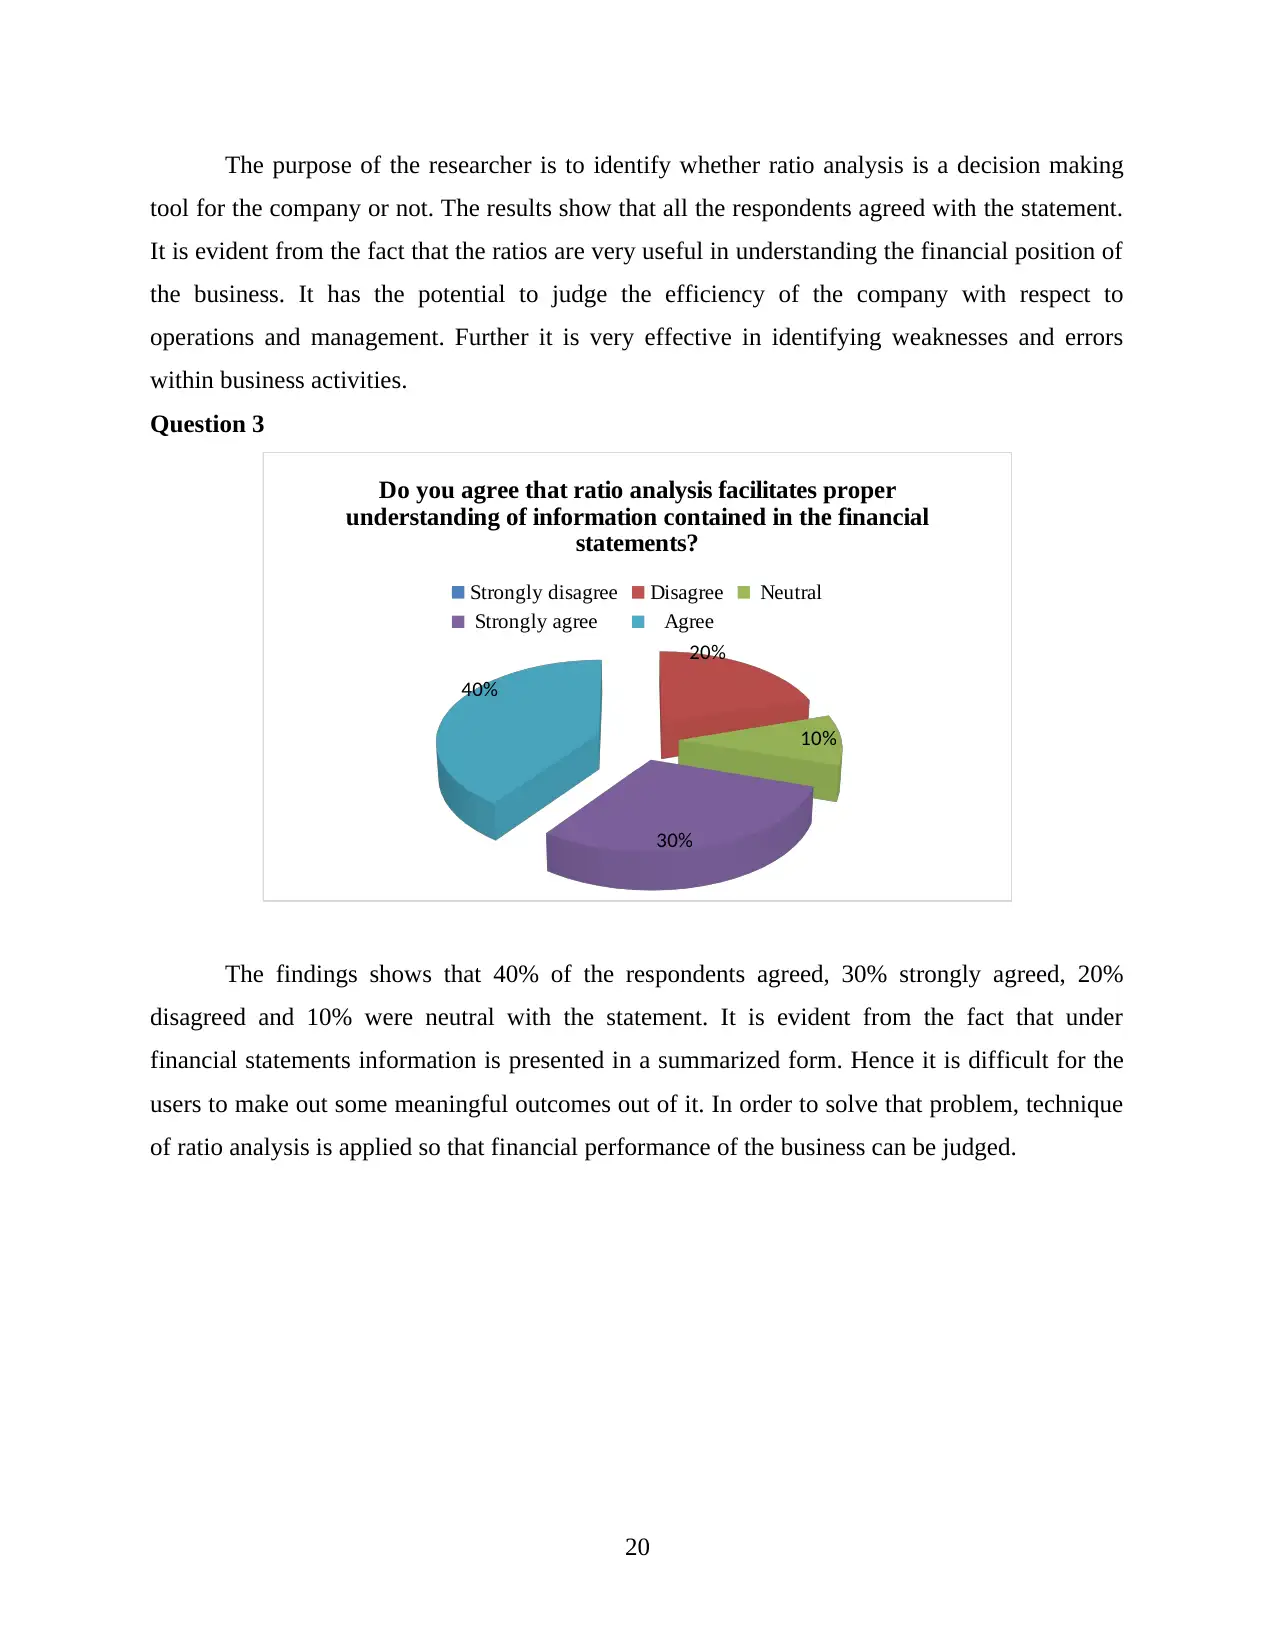
The purpose of the researcher is to identify whether ratio analysis is a decision making
tool for the company or not. The results show that all the respondents agreed with the statement.
It is evident from the fact that the ratios are very useful in understanding the financial position of
the business. It has the potential to judge the efficiency of the company with respect to
operations and management. Further it is very effective in identifying weaknesses and errors
within business activities.
Question 3
20%
10%
30%
40%
Do you agree that ratio analysis facilitates proper
understanding of information contained in the financial
statements?
Strongly disagree Disagree Neutral
Strongly agree Agree
The findings shows that 40% of the respondents agreed, 30% strongly agreed, 20%
disagreed and 10% were neutral with the statement. It is evident from the fact that under
financial statements information is presented in a summarized form. Hence it is difficult for the
users to make out some meaningful outcomes out of it. In order to solve that problem, technique
of ratio analysis is applied so that financial performance of the business can be judged.
20
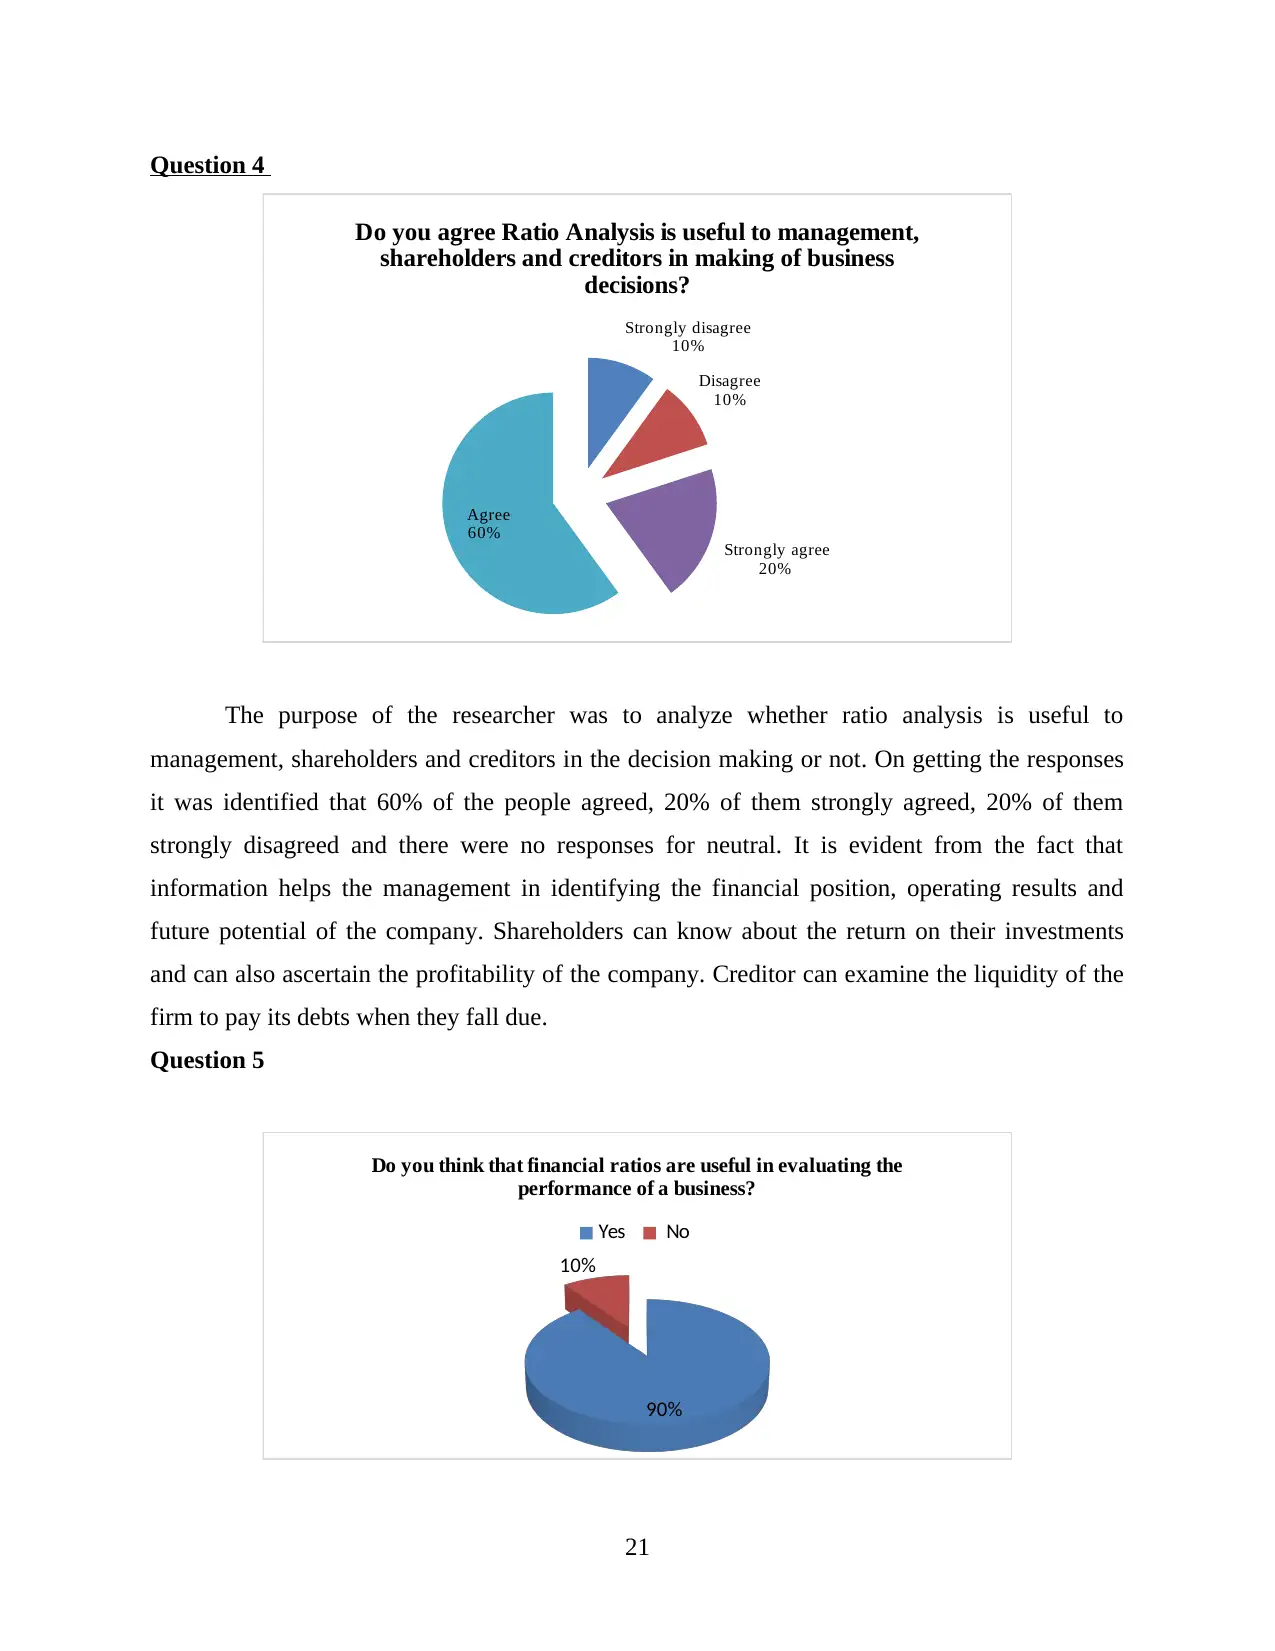
Question 4
Strongly disagree
10%
Disagree
10%
Strongly agree
20%
Agree
60%
Do you agree Ratio Analysis is useful to management,
shareholders and creditors in making of business
decisions?
The purpose of the researcher was to analyze whether ratio analysis is useful to
management, shareholders and creditors in the decision making or not. On getting the responses
it was identified that 60% of the people agreed, 20% of them strongly agreed, 20% of them
strongly disagreed and there were no responses for neutral. It is evident from the fact that
information helps the management in identifying the financial position, operating results and
future potential of the company. Shareholders can know about the return on their investments
and can also ascertain the profitability of the company. Creditor can examine the liquidity of the
firm to pay its debts when they fall due.
Question 5
90%
10%
Do you think that financial ratios are useful in evaluating the
performance of a business?
Yes No
21
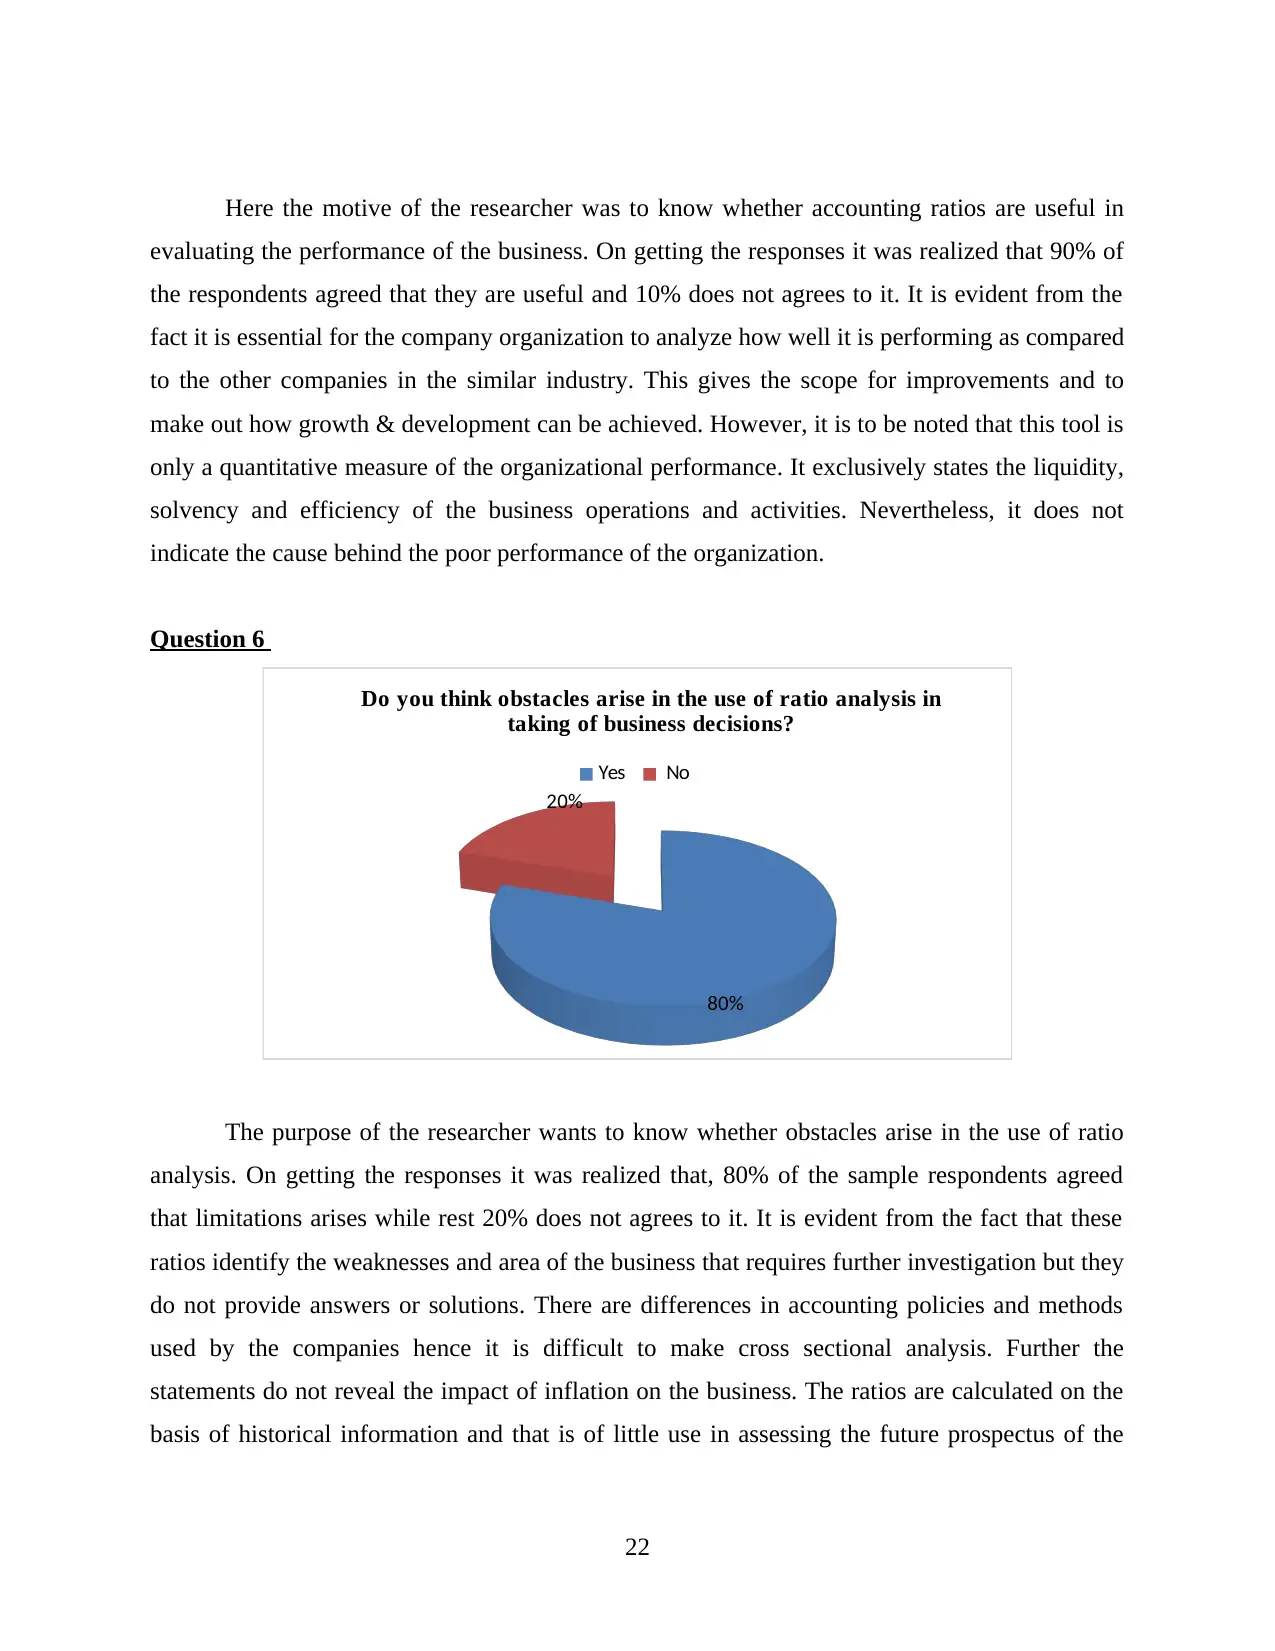
Here the motive of the researcher was to know whether accounting ratios are useful in
evaluating the performance of the business. On getting the responses it was realized that 90% of
the respondents agreed that they are useful and 10% does not agrees to it. It is evident from the
fact it is essential for the company organization to analyze how well it is performing as compared
to the other companies in the similar industry. This gives the scope for improvements and to
make out how growth & development can be achieved. However, it is to be noted that this tool is
only a quantitative measure of the organizational performance. It exclusively states the liquidity,
solvency and efficiency of the business operations and activities. Nevertheless, it does not
indicate the cause behind the poor performance of the organization.
Question 6
80%
20%
Do you think obstacles arise in the use of ratio analysis in
taking of business decisions?
Yes No
The purpose of the researcher wants to know whether obstacles arise in the use of ratio
analysis. On getting the responses it was realized that, 80% of the sample respondents agreed
that limitations arises while rest 20% does not agrees to it. It is evident from the fact that these
ratios identify the weaknesses and area of the business that requires further investigation but they
do not provide answers or solutions. There are differences in accounting policies and methods
used by the companies hence it is difficult to make cross sectional analysis. Further the
statements do not reveal the impact of inflation on the business. The ratios are calculated on the
basis of historical information and that is of little use in assessing the future prospectus of the
22
Paraphrase This Document
Need a fresh take? Get an instant paraphrase of this document with our AI Paraphraser
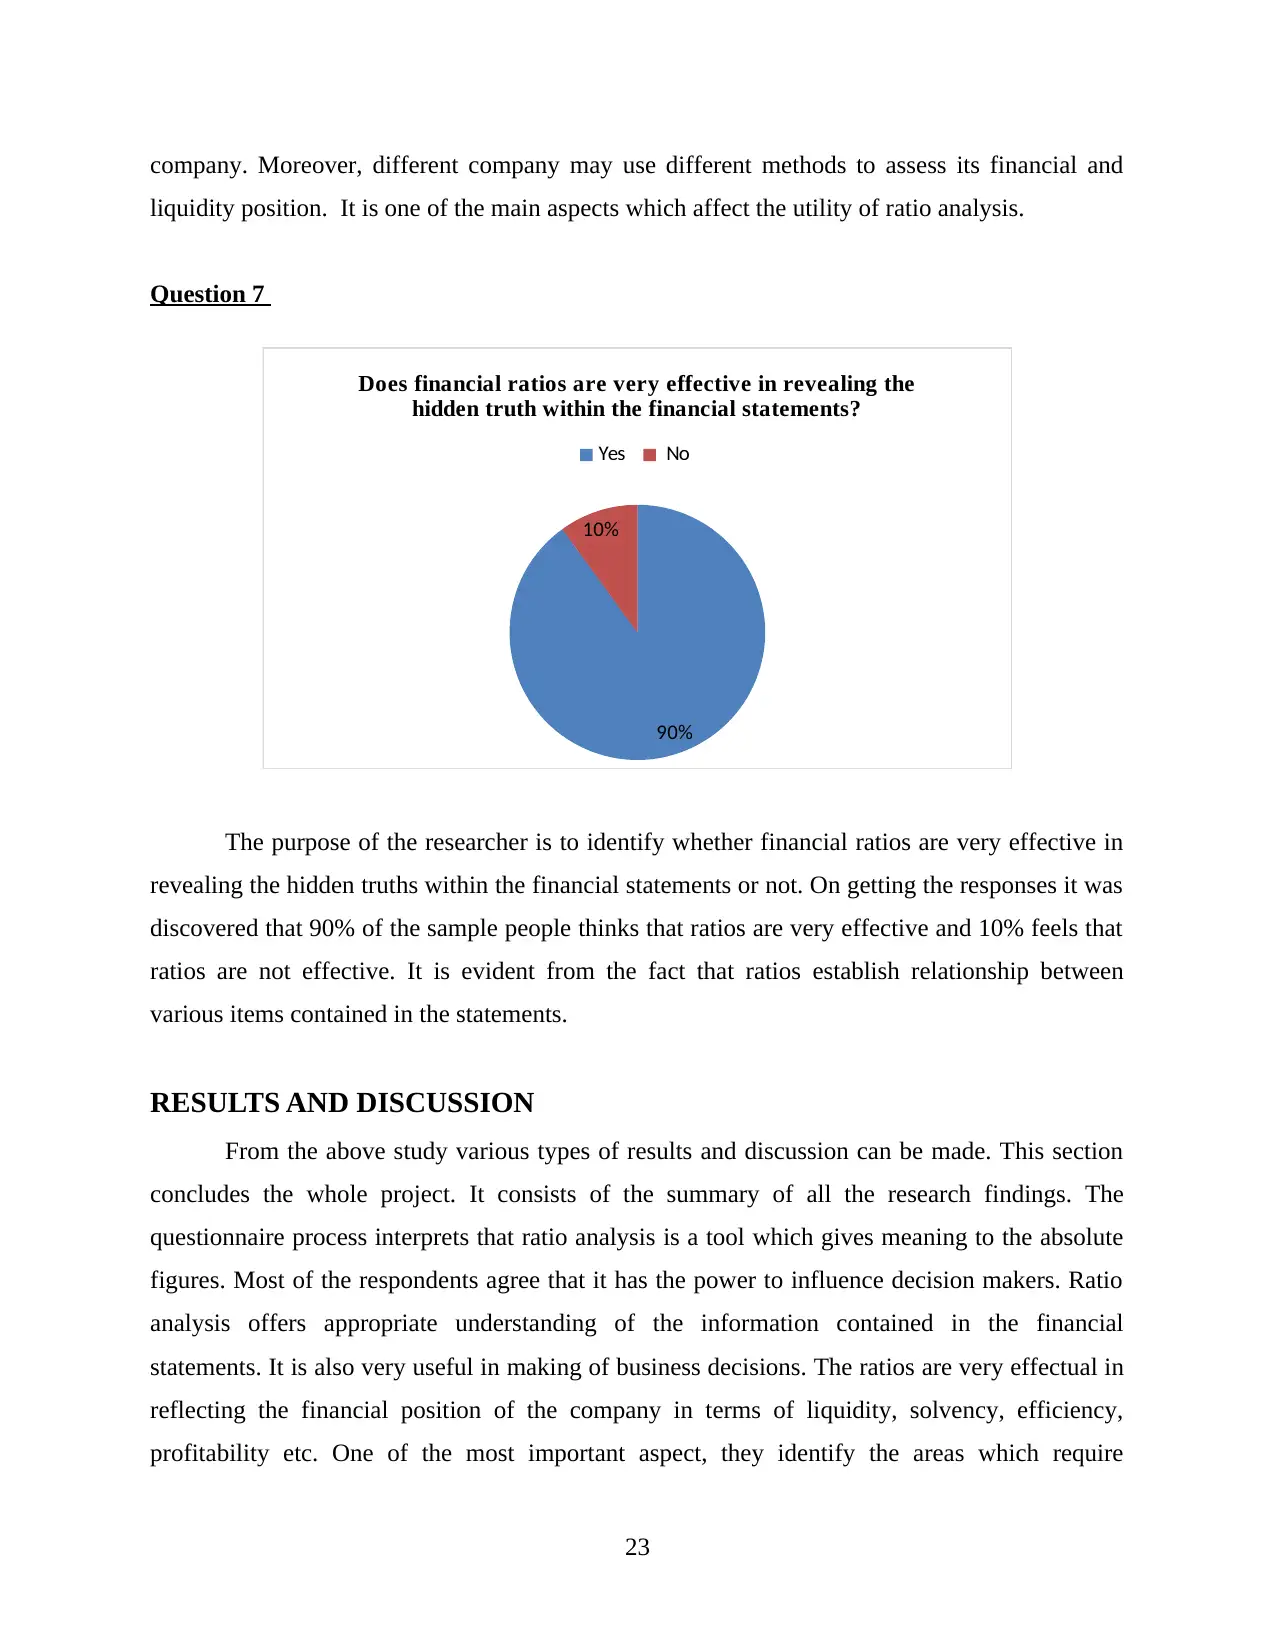
company. Moreover, different company may use different methods to assess its financial and
liquidity position. It is one of the main aspects which affect the utility of ratio analysis.
Question 7
90%
10%
Does financial ratios are very effective in revealing the
hidden truth within the financial statements?
Yes No
The purpose of the researcher is to identify whether financial ratios are very effective in
revealing the hidden truths within the financial statements or not. On getting the responses it was
discovered that 90% of the sample people thinks that ratios are very effective and 10% feels that
ratios are not effective. It is evident from the fact that ratios establish relationship between
various items contained in the statements.
RESULTS AND DISCUSSION
From the above study various types of results and discussion can be made. This section
concludes the whole project. It consists of the summary of all the research findings. The
questionnaire process interprets that ratio analysis is a tool which gives meaning to the absolute
figures. Most of the respondents agree that it has the power to influence decision makers. Ratio
analysis offers appropriate understanding of the information contained in the financial
statements. It is also very useful in making of business decisions. The ratios are very effectual in
reflecting the financial position of the company in terms of liquidity, solvency, efficiency,
profitability etc. One of the most important aspect, they identify the areas which require
23
improvements. Different types of individuals such as creditors, shareholders, suppliers,
customers etc are interested in the financial information generated from the financial statements.
They have their own purposes. They all want to know how well the company is performing. The
analysis also facilitates comparison between the financial performances of two organizations.
Hence it can be concluded that ratio analysis is used by companies on wide level. Despite of
having so many benefits the technique suffers from certain limitations. Financial analysis
depends heavily on informed judgement. Percentages and ratios ensures comparison and also
useful in uncovering the strengths and weaknesses of the company. Although there is a need to
identify the basis causes behind and established trends.
LIMITATIONS OF THE RESEARCH & AREAS OF FURTHER
CONSIDERATION
Following limitations were associated with the research.
Lack of time – Time allotted for the research was not adequate enough for completion.
Such kind of subjects requires proper concentration and focus. Delay in one action can
cause delay in other actions also. Calculation of ratios was the difficult part because it
needs very careful analysis of numbers.
Convincing the participants – It was little difficult to convince the participants for filing
the questionnaires. Every individual has its own mood and mentality.
CONCLUSION
Financial statements consist of information which is in summarized form. They do not
offer adequate information regarding the viability of the reporting company. Hence for that
purpose, the information is needed to be analyzed through means of ratios. It reveals the hidden
truth behind the data and helps in decision making. The ratio analysis helps in disclosing,
comparing and interpreting the salient features of the statements. It figure outs the significant
aspects of the business position and operational results of a company which needs further
investigation. It aims to identify the strengths and weaknesses. It can be concluded that the tool is
effective but have some drawbacks. Lack of standard, Inflationary effects, Quantitative measure,
Window dressing etc is some of the limitations of the tool. Despite of that also, it has the
potential to evaluate the past, present and future prospects of a company.
24
Recommendations
Following recommendations can be made with the reference to this study|:
The users of the financial statements are required to have fair knowledge of accounting in
order to derive more better results
The prospective investors must properly analyze the financial position of the company
before making any investment in it
Users of the financial statements who do not possess the adequate knowledge regarding
how to analyze and understand the information contained in them. They should seek the
services of the qualified financial analysts, stockbrokers, accountants, bankers etc.
It is important that financial statements are to be analyzed in an unbiased manner, without
involving any kind of errors and misrepresentation
The ratios are to be used with careful examination and proper understanding of the data.
Things like wrong judgements, conclusions and decisions are to be avoided
The ratios are to be used in judicial manner by the different stakeholders of the company.
It is also recommended that future researchers can perform research on this subject with
reference to another industry. This study will be a source of inspiration for other scholars
and inspire them to deal with these kind of subjects.
25
Secure Best Marks with AI Grader
Need help grading? Try our AI Grader for instant feedback on your assignments.
REFERENCES
Books and Journals
Ahrendsen, B.L. and Katchova, A.L. 2012. Financial ratio analysis using ARMS data.
Agricultural Finance Review. 72(2). pp.262–272.
Ainsworth, P. and Deines, D, 2008. Introduction to Accounting: An Integrated Approach. 5th ed.
McGraw-Hill Higher Education.
Argouslidis, C. P., 2008. Determinants of the speed of elimination decision making in financial
services. Journal of Services Marketing. 22(3). pp.237 – 254.
Arthur, J. and et.al., 2012. Research Methods and Methodologies in Education. SAGE.Yin, K.
R., 2011. Qualitative research from start to finish. Guilford Press.
Bennouna, K. and Marchant,T., 2010. Improved capital budgeting decision making: evidence
from Canada. Management Decision. 48(2). pp.225–247.
Bourne, M., franco, M., and Wilkes, J., 2006. Corporate performance management. Measuring
business excellence. 7(3). Pp. 150-255.
Broadbent, M. and Cullen, J., 2012. Managing Financial Resources. Routledge
Bruce, H. and Martin, B. 2012. Universal Methods of Design: 100 Ways to Research Complex
Problems, Develop Innovative Ideas, and Design Effective Solutions. Rockport Publishers.
Burt, N. M. and Amin, M., 2014. A mini me?: Exploring early childhood diet with stable isotope
ratio analysis using primary teeth dentin. Archives of oral biology. 59(11). pp. 1226-1232.
Cadle, J. and et.all., 2010. Business Analysis Techniques: 72 Essential Tools for Success BCS,
The Chartered Institute
Chilisa, B., 2012. Indigenous Research Methodologies. SAGE.
Cole, V., Branson, J. and Breesch, D., 2012. The uniformity-flexibility dilemma when
comparing financial statements: Views of auditors, analysts and other users.
International Journal of Accounting and Information Management. 20(20). pp.114 – 141.
Dey, C., 2002. Methodological issues: The use of critical ethnography as an active research
methodology. Accounting, Auditing & Accountability Journal. 15(1). pp.106 – 121.
Dr. Lazar, j., Dr. Feng, H.J. and Dr. Hochheiser, H. 2010. Research Methods in Human-
Computer Interaction. John Wiley & Sons
Erasmus, S. W. and et.al., 2015. Stable isotope ratio analysis: A potential analytical tool for the
authentication of South African lamb meat. Food chemistry. 192. pp. 997-1005.
Freeman, R. J. and et.al., 2014. Governmental and nonprofit accounting: theory and practice.
26
JPAEJOURNAL OF PUBLIC AFFAIRS EDUCATION VOLUME 20 NUMBER. 3. pp.
441.
Giacomello, B., 2008. Exchange ratios in a merger with stochastic capital reserves: fair valuation
and embedded options. Managerial Finance. 34 (4). pp.239 – 251.
Harrison, W. T. and Horngren C. T, 2007. Financial Accounting. 7th ed. Prentice Hall
Ittelson, R. T., 2009. Financial Statements: A Step-by-Step Guide to Understanding and
Creating Financial Reports. Career Press.
Kallio, K. M. and Kallio, T. J. 2014. Management-by-results and performance measurement in
universities–implications for work motivation. Studies in Higher Education. 39(4). pp.574-
589.
Kothari, R. C., 2004. Research Methodology: Methods and Techniques. New age international.
Kotzab, H. and et.al., 2006. Research Methodologies in Supply Chain Management. Springer.
Minnis, M. and Sutherland, A. G., 2014. Financial statements as monitoring mechanisms:
Evidence from small commercial loans. Chicago Booth Research Paper. pp. 13-75.
Moyer, C, McGuigan, J and Rao, R., 2011. Contemporary Financial Management, USA, South-
Western Cengage Learning.
Nobes, C., 2014. International Classification of Financial Reporting 3e. Routledge.
Pal, G. P., Mehra, R. and Pal, S., 2015. Performance Analysis of Constant Current Source for
Different Aspect Ratio. In Computational Intelligence & Communication Technology
(CICT), 2015 IEEE International Conference. pp. 579-582.
Palepu, K. and Healy, P., 2007. Business Analysis and Valuation: Using Financial Statements.
4th ed. Cengage Learning
Perini, M. and et.al., 2014. Using stable isotope ratio analysis to verify the authenticity of"
Passito" wine. In X National congress of food chemistry. pp. 39.
Ross, S. A., Westerfield, R. and Jordan, B. D., 2016. Fundamentals of corporate finance. Irwin.
Sapsford, R. and Jupp, V., 2006. Data collection and analysis. SAGE.
Siano, A., Kitchen, J. P. and Confetto, G. M., 2010. Financial resources and corporate reputation:
Toward common management principles for managing corporate reputation. Corporate
Communications: An International Journal. 15(1). pp.68 – 82.
Sinclair, R., Northcott, D. and Hooper, K., 2014. Can sector-specific standards enhance the
comparability of Third sector organisations' financial statements?. Third Sector Review.
20(2). pp. 27.
27
Sun, D., Roth, S. and Black, M. J., 2014. A quantitative analysis of current practices in optical
flow estimation and the principles behind them. International Journal of Computer
Vision. 106(2). pp. 115-137.
Templeton, A. J. and et.al., 2014. Prognostic role of neutrophil-to-lymphocyte ratio in solid
tumors: a systematic review and meta-analysis. Journal of the National Cancer Institute.
106(6). pp. 124.
Togashi, H. and et.al., 2014. Moisture availability constraints on the leaf area to sapwood area
ratio: analysis of measurements on Australian evergreen angiosperm trees. In EGU
General Assembly Conference Abstracts. 16, pp. 4614.
Togashi, H. F. and et.al., 2015. Morphological and moisture availability controls of the leaf area‐
to‐sapwood area ratio: analysis of measurements on Australian trees. Ecology and
evolution. 5(6) .pp. 1263-1270.
Tracy, A., 2012. Ratio Analysis Fundamentals: How 17 Financial Ratios Can Allow You to
Analyse Any Business on the Planet. RatioAnalysis.net
Wahlen, J., Baginski, S. and Bradshaw, M., 2014. Financial reporting, financial statement
analysis and valuation. Cengage Learning.
Walliman, N. S., 2011. Research Methods: The Basics: The Basics. Taylor & Francis.
Online
Sabău,L.,2013. Information needs of financial statements users - between harmony and conflict.
[Pdf]. Available through:<http://fse.tibiscus.ro/anale/Lucrari2013/Lucrari_vol_
XIX_2013_104.pdf >. [Accessed on 15october 2015].
28
1 out of 31
Related Documents


Your All-in-One AI-Powered Toolkit for Academic Success.
+13062052269
info@desklib.com
Available 24*7 on WhatsApp / Email
![[object Object]](/_next/static/media/star-bottom.7253800d.svg)
Unlock your academic potential
© 2024 | Zucol Services PVT LTD | All rights reserved.