Analyzing Carnival Corporation & Plc's Financial Health Using Ratios
VerifiedAdded on 2023/04/20
|20
|2397
|116
Report
AI Summary
This report presents a comprehensive financial analysis of Carnival Corporation and Plc using ratio analysis for the years 2013-2016. It begins with an introduction to the company, highlighting its position as a leading British-American cruise operator and the world's largest travel leisure company. The report then discusses the advantages and disadvantages of ratio analysis as a financial tool. The core of the analysis involves the calculation and interpretation of various financial ratios, including profitability ratios (gross profit margin, operating profit margin, and return on capital employed), liquidity ratios (current ratio and acid test ratio), and gearing ratios (gearing ratio and interest cover ratio). The profitability analysis reveals an increasing trend in Carnival's profitability, driven by revenue growth and efficient cost management. However, the liquidity analysis indicates a weak liquidity position due to insufficient current and liquid assets to cover short-term liabilities. The gearing analysis shows that Carnival is primarily financed by equity, reducing its risk profile. The report concludes that Carnival exhibits a mixed financial condition, with strong profitability but a need to improve its liquidity.

Running head: ACCOUNTING AND FINANCE
Accounting and Finance
Name of the Student
Name of the University
Author’s Note
Accounting and Finance
Name of the Student
Name of the University
Author’s Note
Paraphrase This Document
Need a fresh take? Get an instant paraphrase of this document with our AI Paraphraser

1ACCOUNTING AND FINANCE
Executive Summary
The main aim of this report is the analysis of the performance of Carnival Corporation and
Plc with the help of ratio analysis for the years 2013, 2014, 2015 and 2016. This report
provides information about the company. This report also discusses about the advantages and
disadvantages of Ratio Analysis. The next part involves in calculation as well as
interpretation of the ratios of the company.
2ACCOUNTING AND FINANCE
Table of Contents
Introduction of the Company.....................................................................................................3
Ratio Analysis............................................................................................................................3
Literature Review...................................................................................................................3
What is Ratio Analysis.......................................................................................................3
Advantages of Ratio Analysis............................................................................................3
Disadvantages of Ratio Analysis.......................................................................................4
Calculation and Interpretation................................................................................................4
Profitability ratios...............................................................................................................4
Liquidity Ratios..................................................................................................................5
Gearing Ratios....................................................................................................................6
Conclusion..................................................................................................................................7
References and Bibliography.....................................................................................................9
Appendix..................................................................................................................................11
⊘ This is a preview!⊘
Do you want full access?
Subscribe today to unlock all pages.
Trusted by 1+ million students worldwide
3ACCOUNTING AND FINANCE
Introduction of the Company
Carnival Corporation and Plc (Carnival) is one of the leading British-American cruise
operator. In the recent years, Carnival is considered as the world’s largest travel leisure
company as the company has a combined fleet of over hundred vessels across ten cruise line
brands including Princess, famously known as the line of the Love Boat along with Cunard,
Queen Mary and others (carnivalcorp.com 2018). It needs to be mentioned that Carnival
services worldwide basis and the company operates in the hospitality as well as tourism
industry. Carnival was founded in the year of 1972 and it is headquartered at Miami, Florida,
United States. The company has an employee base of 120,000 employees worldwide and it
serves more than 11.5 million passengers on yearly basis. In the year 2017, Carnival had a
revenue of $17.510 billion along with an operating income of $2.809 billion in the same year.
The net income of the company for the same year was $2.606 billion. In Carnival, on a
distinctive seven-day cruise, the company collects 9,300 pounds of recyclables so that they
can be processed. At the same time, it needs to be mentioned that the business activities of
Carnival generated 373,738 jobs along with paying $19.4 billion in wages to the American
workers (phx.corporate-ir.net 2018). Thus, based on the business of Carnival in terms of
financial figures and others, it can be said that the company has a great chance to expand their
business in the future years.
Ratio Analysis
Literature Review
What is Ratio Analysis
Ratio Analysis can be considered as the process to examine and compare financial
information of the companies through the calculation of their financial statements’ figures. It
helps in comparing the relationship between the accounts of the financial statements. It
implies that it help in comparing one company’s balance sheet and income statement to the
same of another company. The following discussion shows the advantages as well as
disadvantages of the ratio analysis (Delen, Kuzey and Uyar 2013).
Advantages of Ratio Analysis
Ratio analysis assists in validating or disproving the financial investment and
operating decision of the companies. It helps in summarizing the financial statements into
comparative figures that assists the managements in comparing as well as evaluating the
financial position of the companies (Gitman, Juchau and Flanagan 2015). In addition, it
Paraphrase This Document
Need a fresh take? Get an instant paraphrase of this document with our AI Paraphraser
4ACCOUNTING AND FINANCE
streamlines compound accounting statements along with financial data into simple ratios of
profitability, operating, efficiency, solvency and others. For this reason, it plays a crucial part
in the identification of problem areas with the aim to bring the attention of the managements
in these areas. Moreover, it provides scope to the managements of the companies in
comparing their financial performance with their competitors for gaining better understanding
about their financial position (Carraher and Van Auken 2013).
Disadvantages of Ratio Analysis
The main disadvantage of ratio analysis is that it does not consider the changes in
price level due to inflation (Weil, Schipper and Francis 2013). The calculation of many ratios
is done by considering the historical cost and they oversee the price level change in this
process and failing to reflect the correct financial situation of them. In addition, ratio analysis
completely overlook the qualitative aspect of the companies as they only consider the
monetary aspect. In the absence of any standard definition, companies can use any formula
for the analysis of ratios. These are the major disadvantages of ratio analysis (Vernimmen et
al. 2014).
Calculation and Interpretation
Profitability ratios
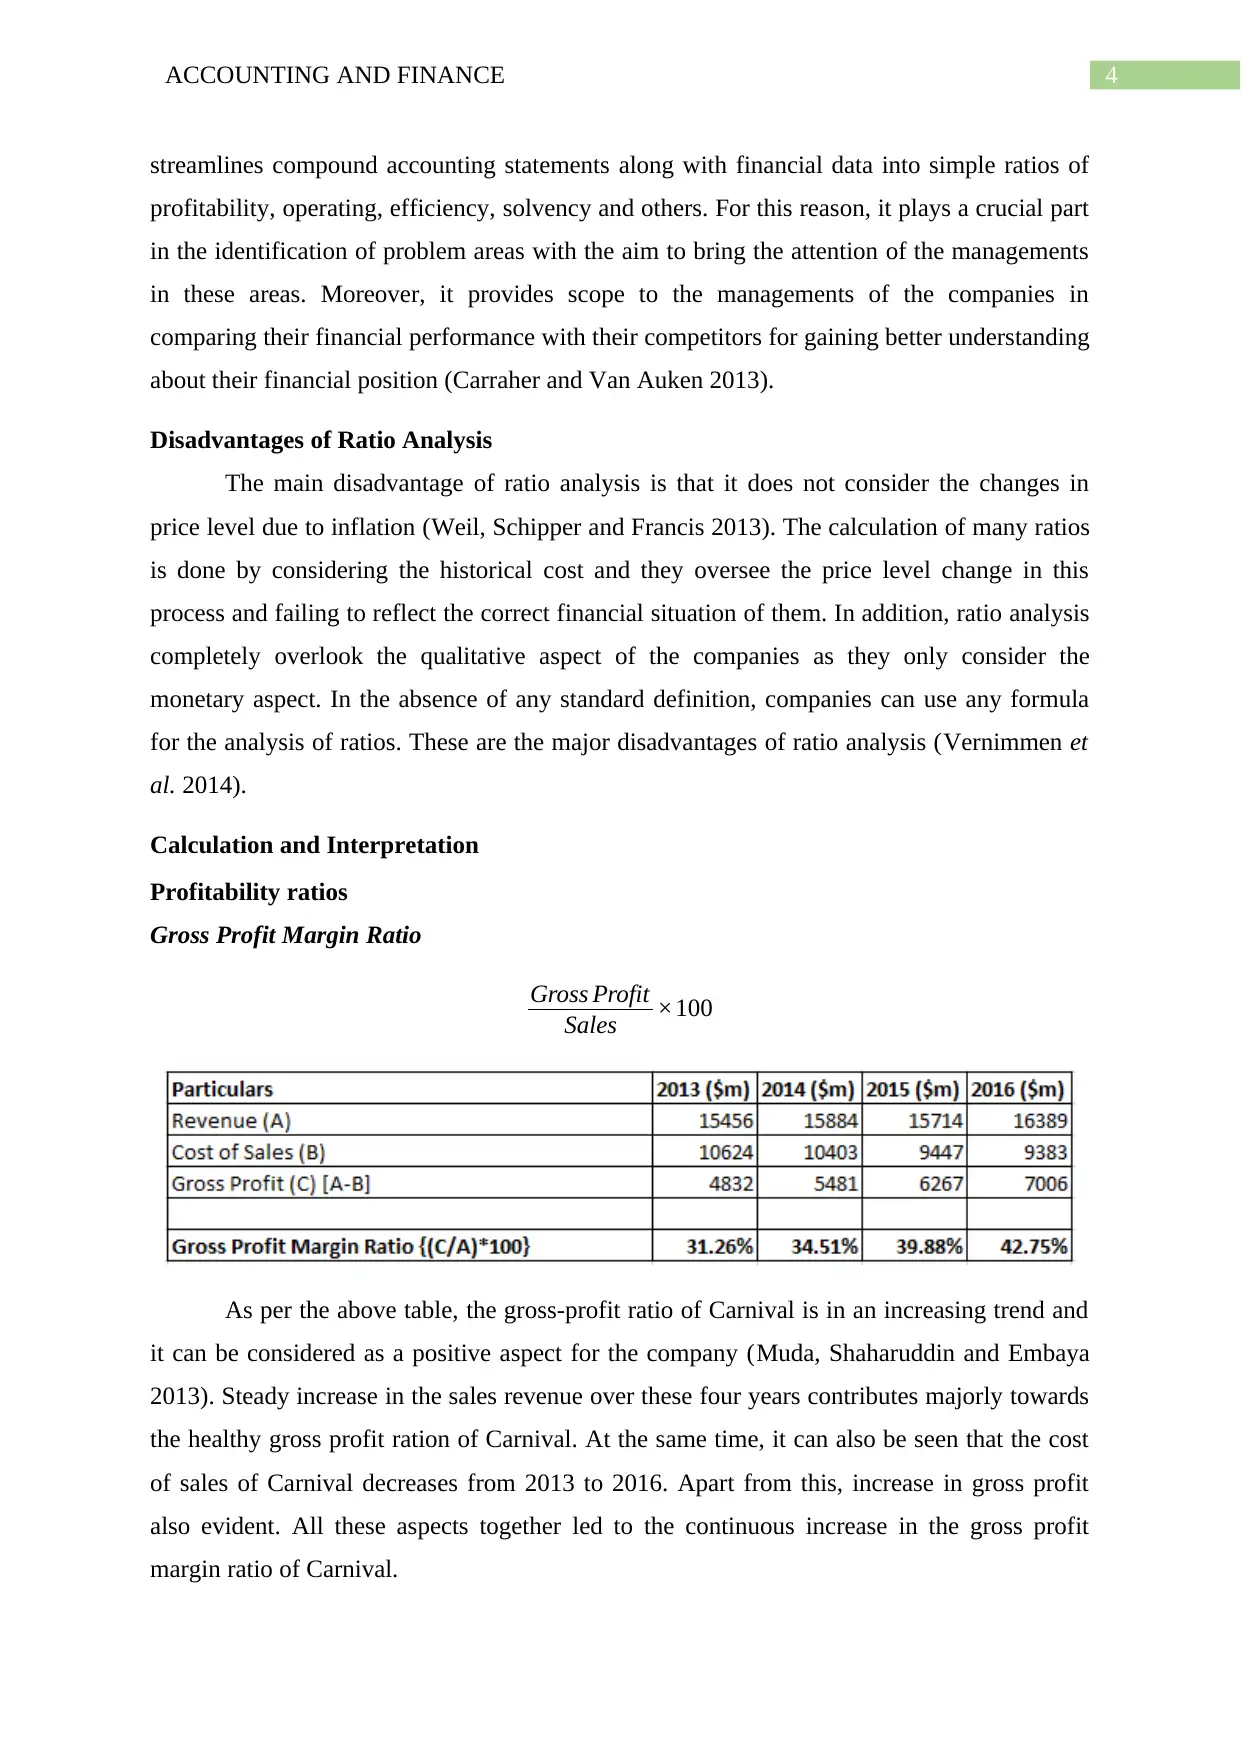
Gross Profit Margin Ratio
Gross Profit
Sales ×100
As per the above table, the gross-profit ratio of Carnival is in an increasing trend and
it can be considered as a positive aspect for the company (Muda, Shaharuddin and Embaya
2013). Steady increase in the sales revenue over these four years contributes majorly towards
the healthy gross profit ration of Carnival. At the same time, it can also be seen that the cost
of sales of Carnival decreases from 2013 to 2016. Apart from this, increase in gross profit
also evident. All these aspects together led to the continuous increase in the gross profit
margin ratio of Carnival.
streamlines compound accounting statements along with financial data into simple ratios of
profitability, operating, efficiency, solvency and others. For this reason, it plays a crucial part
in the identification of problem areas with the aim to bring the attention of the managements
in these areas. Moreover, it provides scope to the managements of the companies in
comparing their financial performance with their competitors for gaining better understanding
about their financial position (Carraher and Van Auken 2013).
Disadvantages of Ratio Analysis
The main disadvantage of ratio analysis is that it does not consider the changes in
price level due to inflation (Weil, Schipper and Francis 2013). The calculation of many ratios
is done by considering the historical cost and they oversee the price level change in this
process and failing to reflect the correct financial situation of them. In addition, ratio analysis
completely overlook the qualitative aspect of the companies as they only consider the
monetary aspect. In the absence of any standard definition, companies can use any formula
for the analysis of ratios. These are the major disadvantages of ratio analysis (Vernimmen et
al. 2014).
Calculation and Interpretation
Profitability ratios
Gross Profit Margin Ratio
Gross Profit
Sales ×100
As per the above table, the gross-profit ratio of Carnival is in an increasing trend and
it can be considered as a positive aspect for the company (Muda, Shaharuddin and Embaya
2013). Steady increase in the sales revenue over these four years contributes majorly towards
the healthy gross profit ration of Carnival. At the same time, it can also be seen that the cost
of sales of Carnival decreases from 2013 to 2016. Apart from this, increase in gross profit
also evident. All these aspects together led to the continuous increase in the gross profit
margin ratio of Carnival.
5ACCOUNTING AND FINANCE
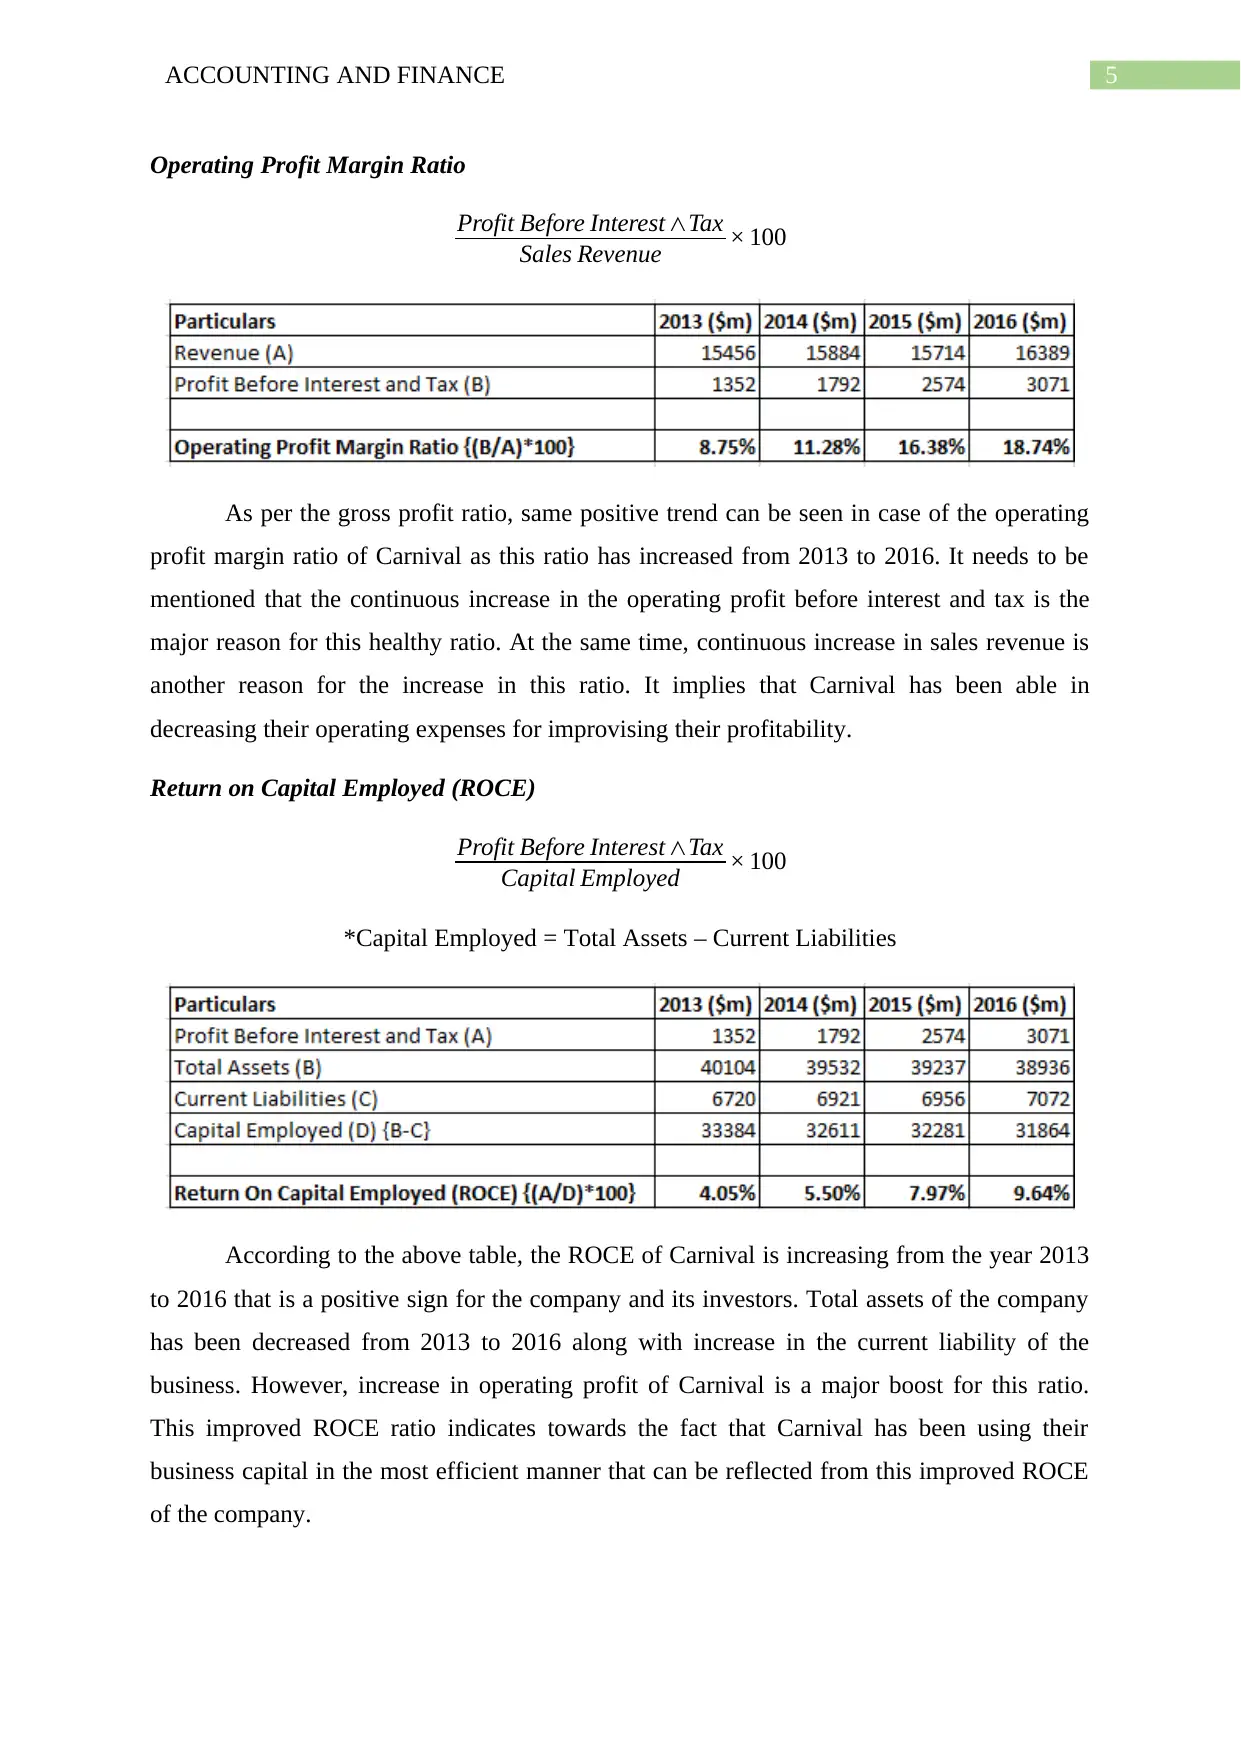
Operating Profit Margin Ratio
Profit Before Interest ∧Tax
Sales Revenue × 100
As per the gross profit ratio, same positive trend can be seen in case of the operating
profit margin ratio of Carnival as this ratio has increased from 2013 to 2016. It needs to be
mentioned that the continuous increase in the operating profit before interest and tax is the
major reason for this healthy ratio. At the same time, continuous increase in sales revenue is
another reason for the increase in this ratio. It implies that Carnival has been able in
decreasing their operating expenses for improvising their profitability.
Return on Capital Employed (ROCE)
Profit Before Interest ∧Tax
Capital Employed × 100
*Capital Employed = Total Assets – Current Liabilities
According to the above table, the ROCE of Carnival is increasing from the year 2013
to 2016 that is a positive sign for the company and its investors. Total assets of the company
has been decreased from 2013 to 2016 along with increase in the current liability of the
business. However, increase in operating profit of Carnival is a major boost for this ratio.
This improved ROCE ratio indicates towards the fact that Carnival has been using their
business capital in the most efficient manner that can be reflected from this improved ROCE
of the company.
⊘ This is a preview!⊘
Do you want full access?
Subscribe today to unlock all pages.
Trusted by 1+ million students worldwide
6ACCOUNTING AND FINANCE
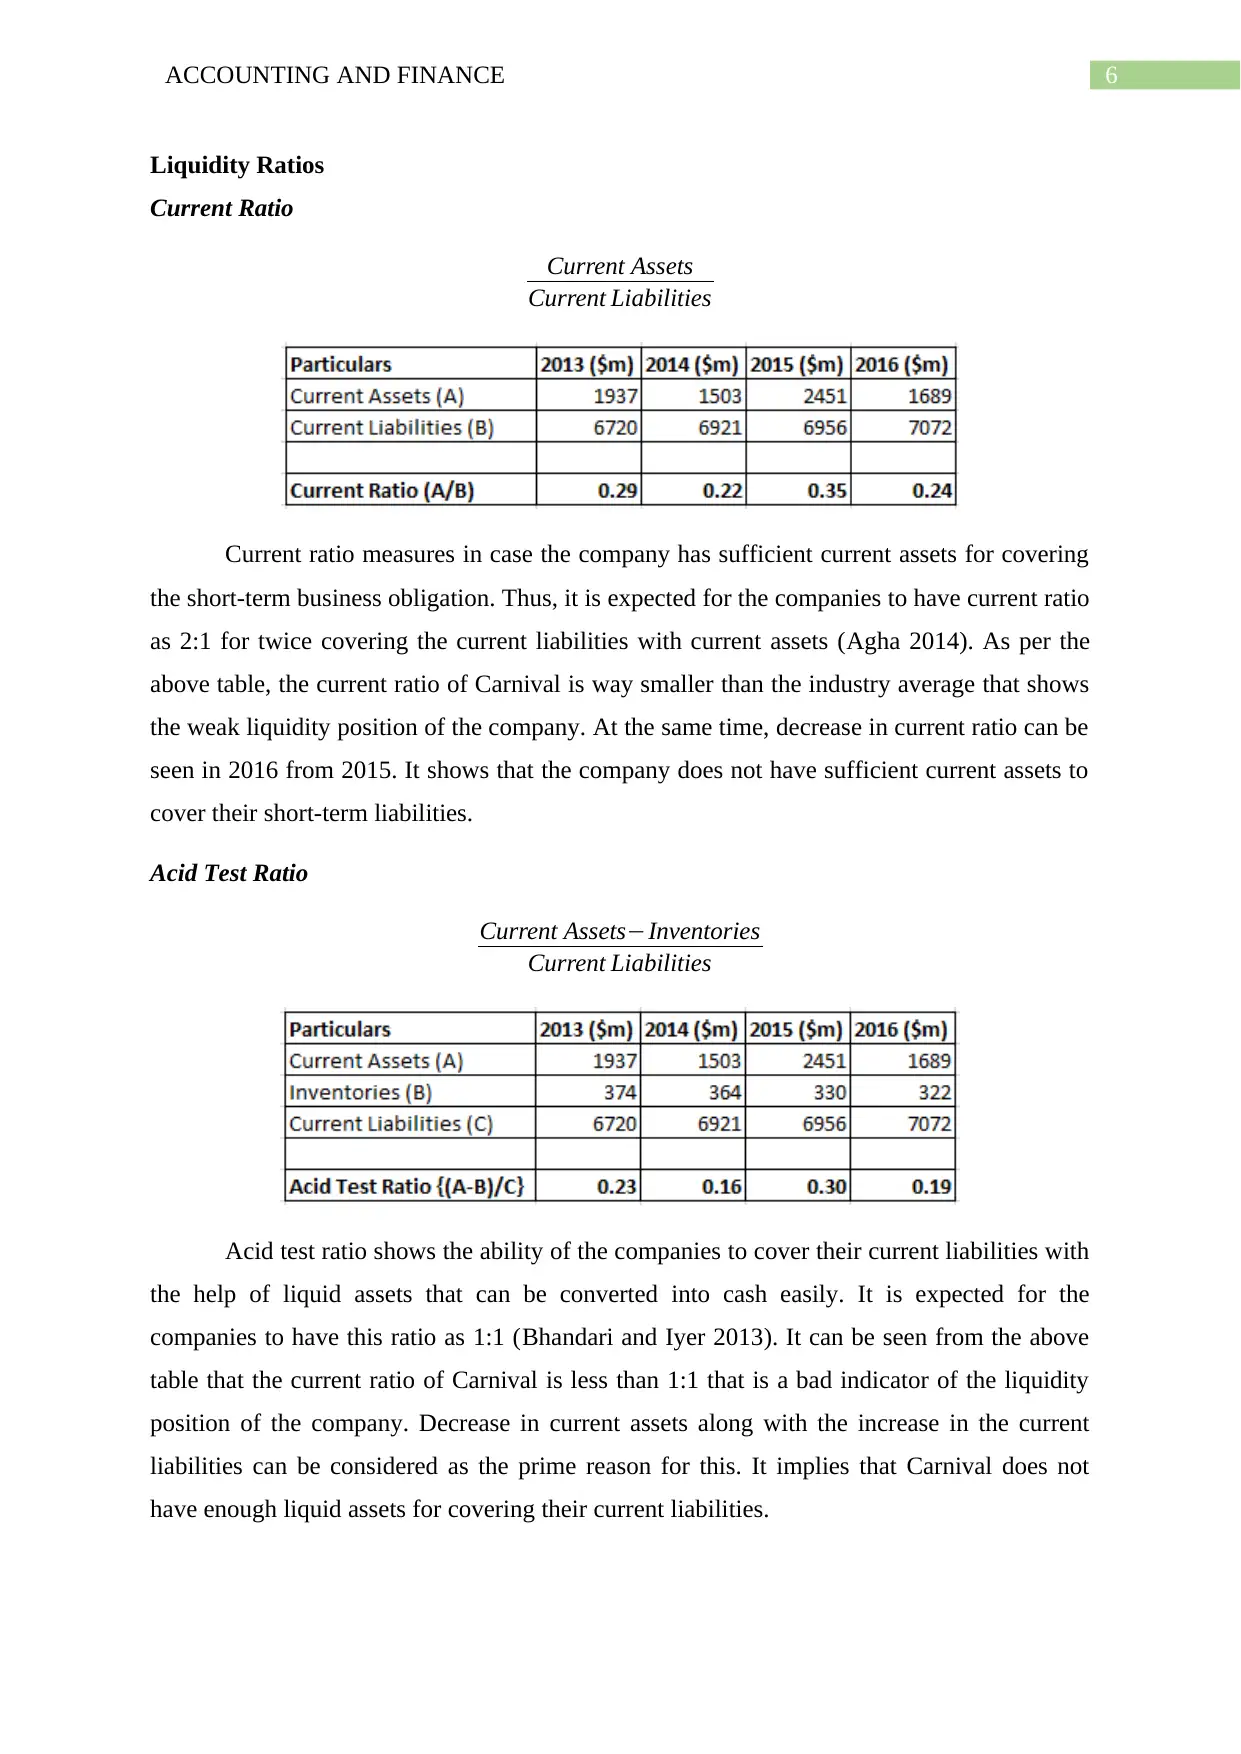
Liquidity Ratios
Current Ratio
Current Assets
Current Liabilities
Current ratio measures in case the company has sufficient current assets for covering
the short-term business obligation. Thus, it is expected for the companies to have current ratio
as 2:1 for twice covering the current liabilities with current assets (Agha 2014). As per the
above table, the current ratio of Carnival is way smaller than the industry average that shows
the weak liquidity position of the company. At the same time, decrease in current ratio can be
seen in 2016 from 2015. It shows that the company does not have sufficient current assets to
cover their short-term liabilities.
Acid Test Ratio
Current Assets−Inventories
Current Liabilities
Acid test ratio shows the ability of the companies to cover their current liabilities with
the help of liquid assets that can be converted into cash easily. It is expected for the
companies to have this ratio as 1:1 (Bhandari and Iyer 2013). It can be seen from the above
table that the current ratio of Carnival is less than 1:1 that is a bad indicator of the liquidity
position of the company. Decrease in current assets along with the increase in the current
liabilities can be considered as the prime reason for this. It implies that Carnival does not
have enough liquid assets for covering their current liabilities.
Paraphrase This Document
Need a fresh take? Get an instant paraphrase of this document with our AI Paraphraser
7ACCOUNTING AND FINANCE
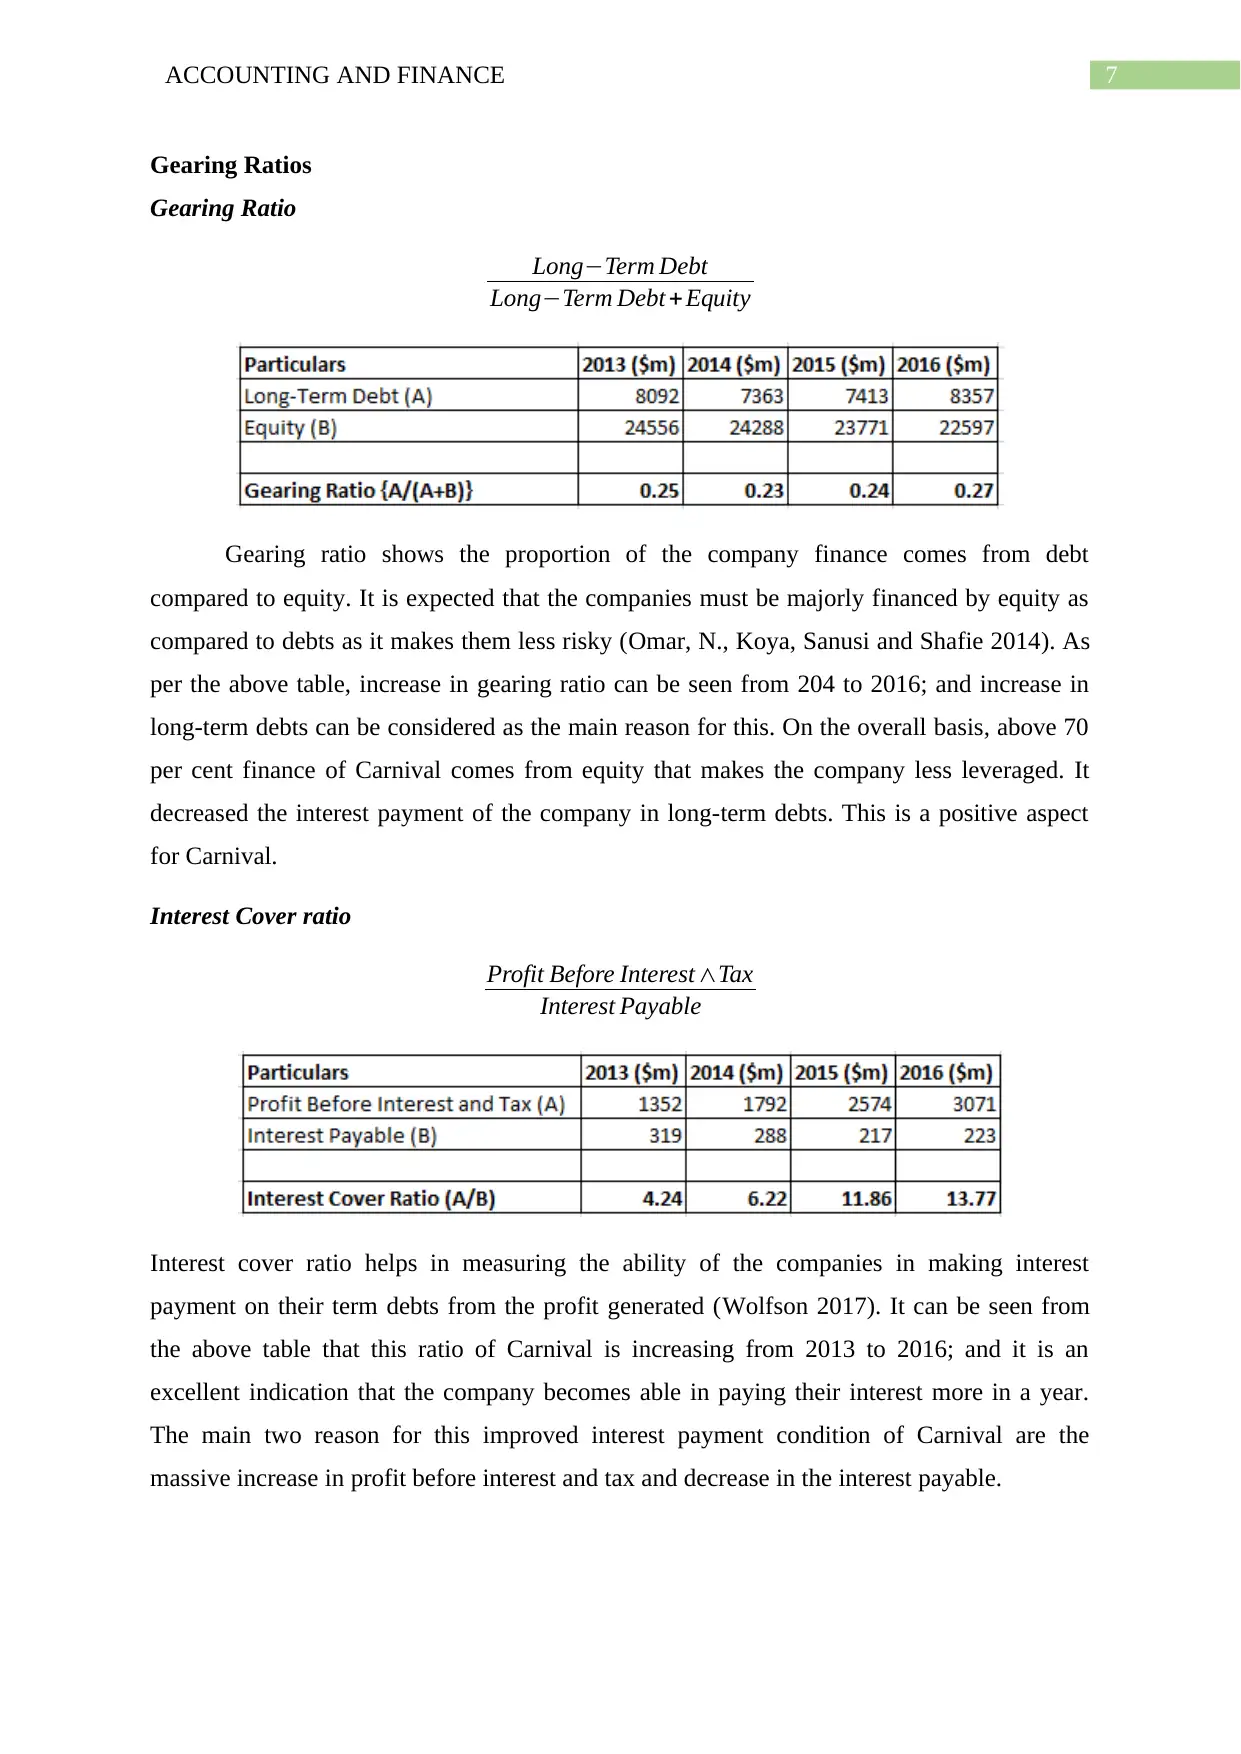
Gearing Ratios
Gearing Ratio
Long−Term Debt
Long−Term Debt + Equity
Gearing ratio shows the proportion of the company finance comes from debt
compared to equity. It is expected that the companies must be majorly financed by equity as
compared to debts as it makes them less risky (Omar, N., Koya, Sanusi and Shafie 2014). As
per the above table, increase in gearing ratio can be seen from 204 to 2016; and increase in
long-term debts can be considered as the main reason for this. On the overall basis, above 70
per cent finance of Carnival comes from equity that makes the company less leveraged. It
decreased the interest payment of the company in long-term debts. This is a positive aspect
for Carnival.
Interest Cover ratio
Profit Before Interest ∧Tax
Interest Payable
Interest cover ratio helps in measuring the ability of the companies in making interest
payment on their term debts from the profit generated (Wolfson 2017). It can be seen from
the above table that this ratio of Carnival is increasing from 2013 to 2016; and it is an
excellent indication that the company becomes able in paying their interest more in a year.
The main two reason for this improved interest payment condition of Carnival are the
massive increase in profit before interest and tax and decrease in the interest payable.
8ACCOUNTING AND FINANCE
Conclusion
It can be seen from the above ratio analysis of Carnival that the company has a mixed
financial condition along with financial performance. According to the profitability analysis
of the company, an increasing trend can be seen in the gross profit margin ratio, operating
profit margin ratio and ROCE; and the main reasons for this improved profitability position
of Carnival is increase in both gross profit and operating profit along with the increase in
revenue. However, the above discussion shows that the liquidity position of Carnival is not
good due to the fact that the company does not have required current assets and liquid assets
for covering their current liabilities. Decrease in current assets along with increase in current
liabilities is the main reason for this ineffective liquidity position. The above discussion also
shows that Carnival has majority portion of equity in their capital structure as the company
finance a small part of their business through term debts. It decrease the burden of interest
payment from the company and leads to the increased capability to make more interest
payment in a year.
⊘ This is a preview!⊘
Do you want full access?
Subscribe today to unlock all pages.
Trusted by 1+ million students worldwide
9ACCOUNTING AND FINANCE
References and Bibliography
Agha, H., 2014. Impact of working capital management on Profitability. European Scientific
Journal, ESJ, 10(1).
Annualreports.com. 2018. [online] Available at:
http://www.annualreports.com/HostedData/AnnualReportArchive/c/NYSE_CCL_2016.pdf
[Accessed 23 Dec. 2018].
Annualreports.com. 2018. [online] Available at:
http://www.annualreports.com/HostedData/AnnualReportArchive/c/NYSE_CCL_2015.PDF
[Accessed 23 Dec. 2018].
Annualreports.com. 2018. [online] Available at:
http://www.annualreports.com/HostedData/AnnualReportArchive/c/NYSE_CCL_2014.pdf
[Accessed 23 Dec. 2018].
Annualreports.com. 2018. [online] Available at:
http://www.annualreports.com/HostedData/AnnualReportArchive/c/NYSE_CCL_2013.pdf
[Accessed 23 Dec. 2018].
Bhandari, S.B. and Iyer, R., 2013. Predicting business failure using cash flow statement based
measures. Managerial Finance, 39(7), pp.667-676.
Carnivalcorp.com. (2018). Home - Carnival Corporation. [online] Available at:
http://www.carnivalcorp.com/ [Accessed 23 Dec. 2018].
Carraher, S. and Van Auken, H., 2013. The use of financial statements for decision making
by small firms. Journal of Small Business & Entrepreneurship, 26(3), pp.323-336.
Delen, D., Kuzey, C. and Uyar, A., 2013. Measuring firm performance using financial ratios:
A decision tree approach. Expert Systems with Applications, 40(10), pp.3970-3983.
Gitman, L.J., Juchau, R. and Flanagan, J., 2015. Principles of managerial finance. Pearson
Higher Education AU.
Muda, M., Shaharuddin, A. and Embaya, A., 2013. Comparative analysis of profitability
determinants of domestic and foreign Islamic banks in Malaysia. International Journal of
Economics and Financial Issues, 3(3), pp.559-569.
Paraphrase This Document
Need a fresh take? Get an instant paraphrase of this document with our AI Paraphraser
10ACCOUNTING AND FINANCE
Omar, N., Koya, R.K., Sanusi, Z.M. and Shafie, N.A., 2014. Financial statement fraud: A
case examination using Beneish Model and ratio analysis. International Journal of Trade,
Economics and Finance, 5(2), p.184.
Phx.corporate-ir.net. (2018). Quick Facts - Carnival Corporation. [online] Available at:
http://phx.corporate-ir.net/phoenix.zhtml?c=200767&p=irol-funfacts [Accessed 23 Dec.
2018].
Vernimmen, P., Quiry, P., Dallocchio, M., Le Fur, Y. and Salvi, A., 2014. Corporate
finance: theory and practice. John Wiley & Sons.
Weil, R.L., Schipper, K. and Francis, J., 2013. Financial accounting: an introduction to
concepts, methods and uses. Cengage Learning.
Wolfson, M.H., 2017. Financial crises: Understanding the postwar US experience.
Routledge.
11ACCOUNTING AND FINANCE
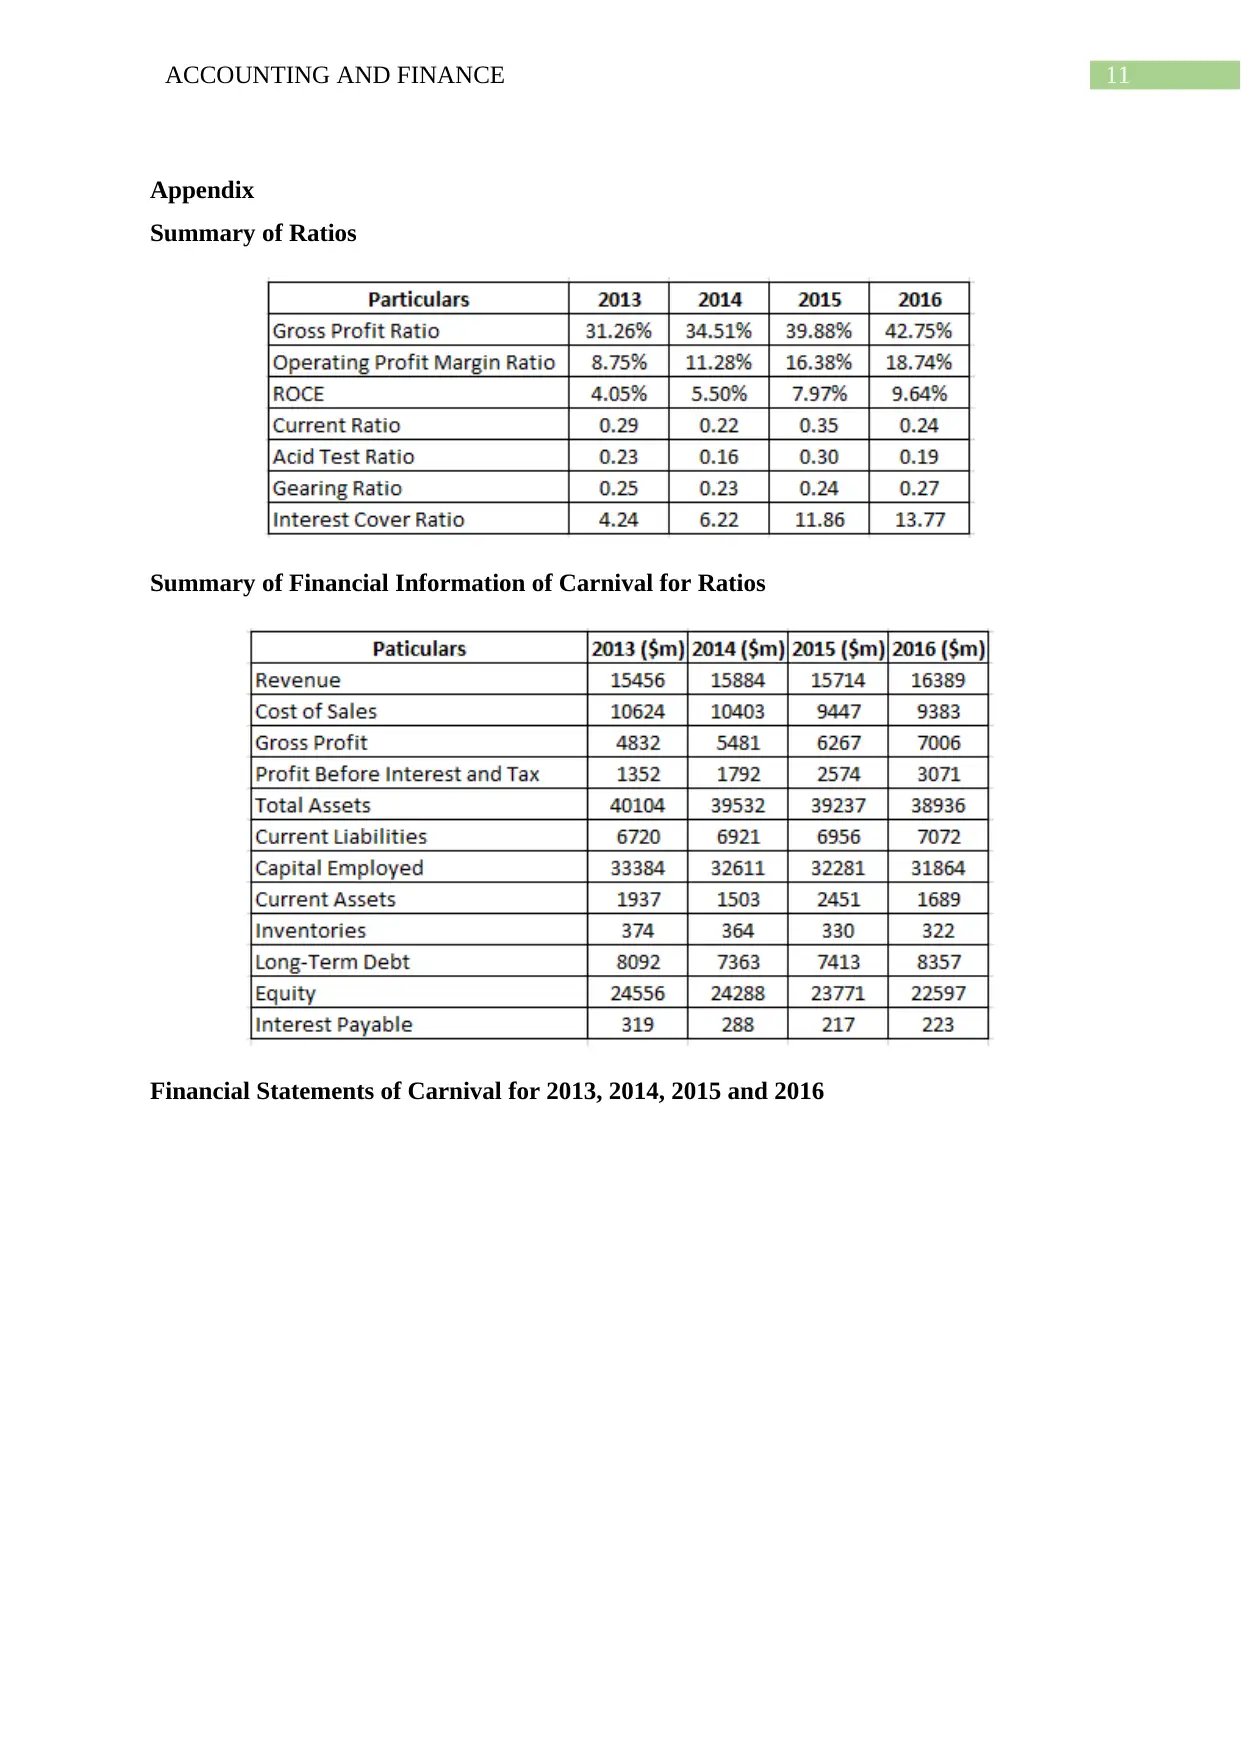
Appendix
Summary of Ratios
Summary of Financial Information of Carnival for Ratios
Financial Statements of Carnival for 2013, 2014, 2015 and 2016
Appendix
Summary of Ratios
Summary of Financial Information of Carnival for Ratios
Financial Statements of Carnival for 2013, 2014, 2015 and 2016
⊘ This is a preview!⊘
Do you want full access?
Subscribe today to unlock all pages.
Trusted by 1+ million students worldwide
1 out of 20
Related Documents


Your All-in-One AI-Powered Toolkit for Academic Success.
+13062052269
info@desklib.com
Available 24*7 on WhatsApp / Email
![[object Object]](/_next/static/media/star-bottom.7253800d.svg)
Unlock your academic potential
Copyright © 2020–2026 A2Z Services. All Rights Reserved. Developed and managed by ZUCOL.