Comprehensive Ratio Analysis of GlaxoSmithKline Plc (GSK) Finance
VerifiedAdded on 2023/04/20
|20
|1782
|184
Report
AI Summary
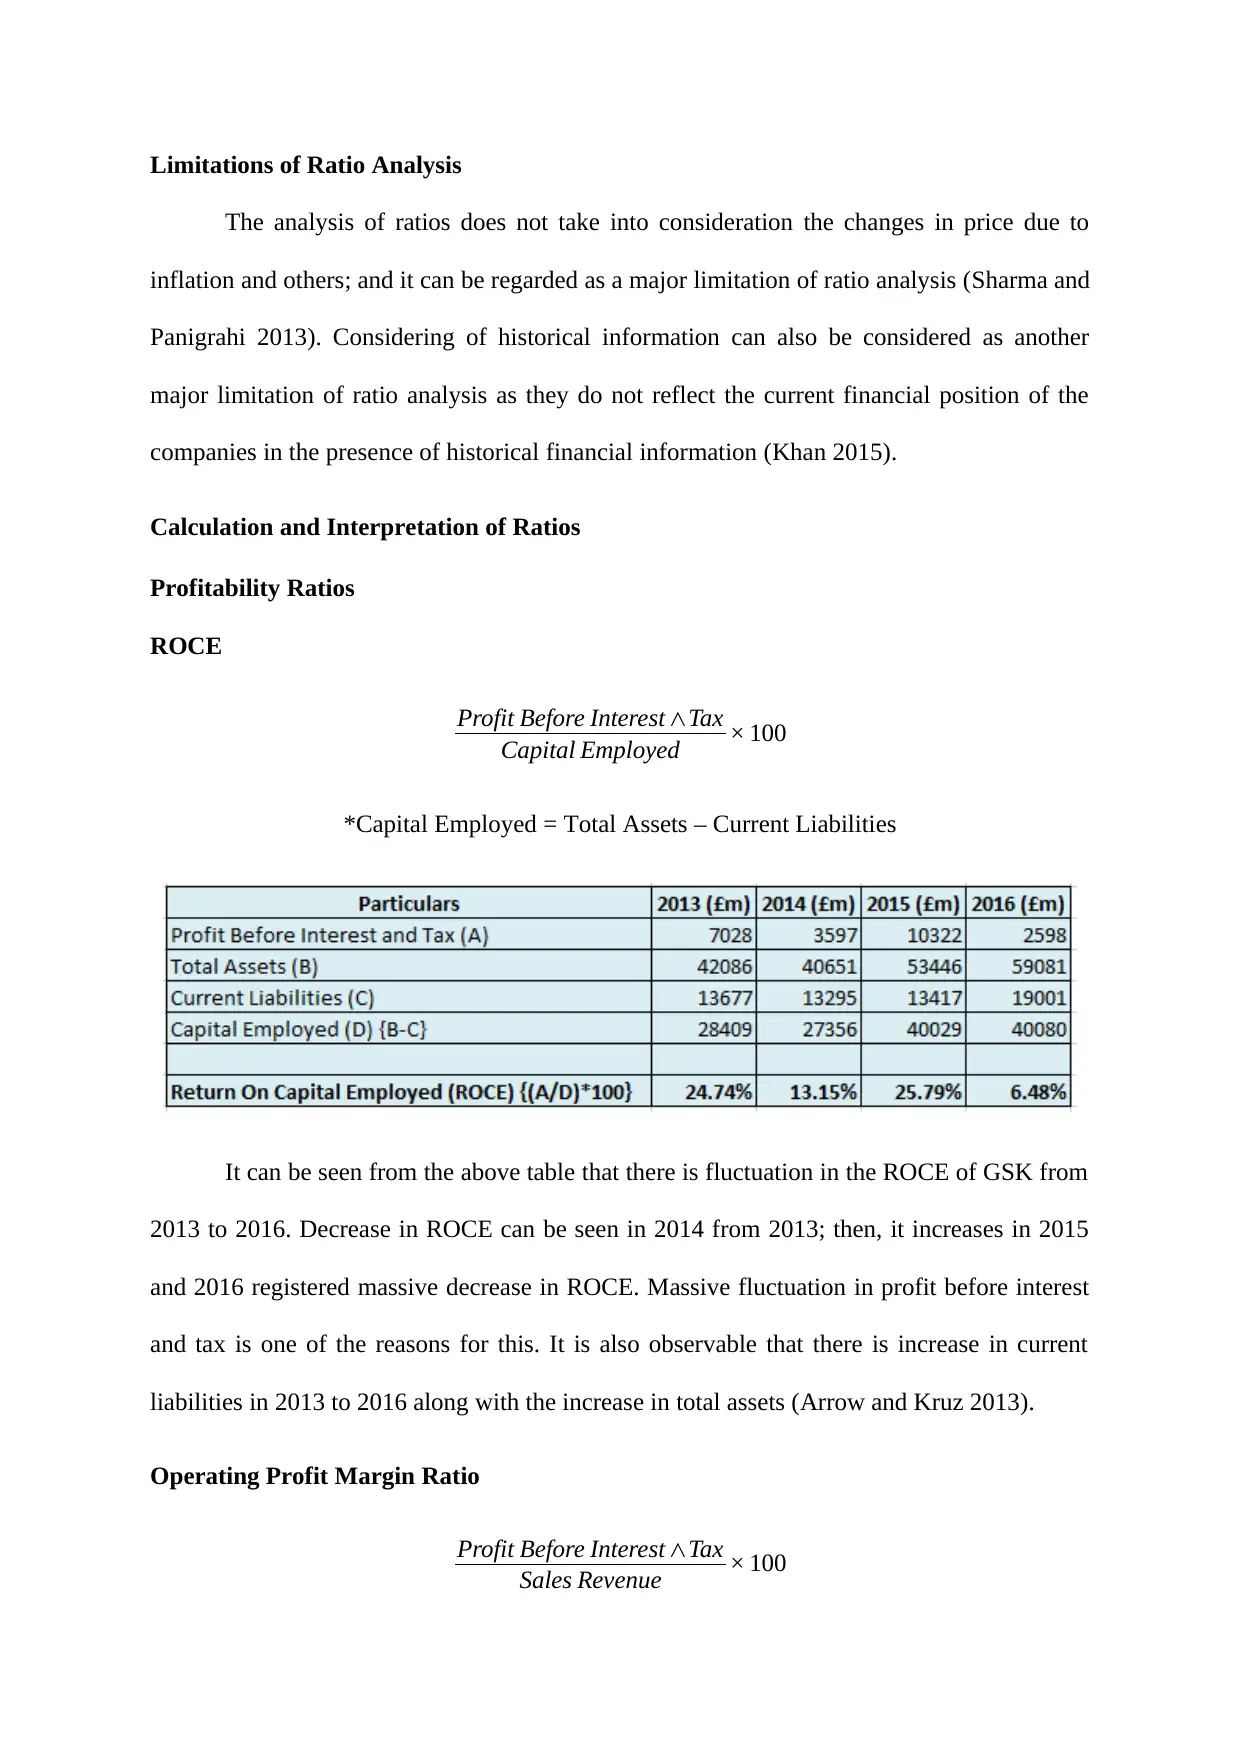
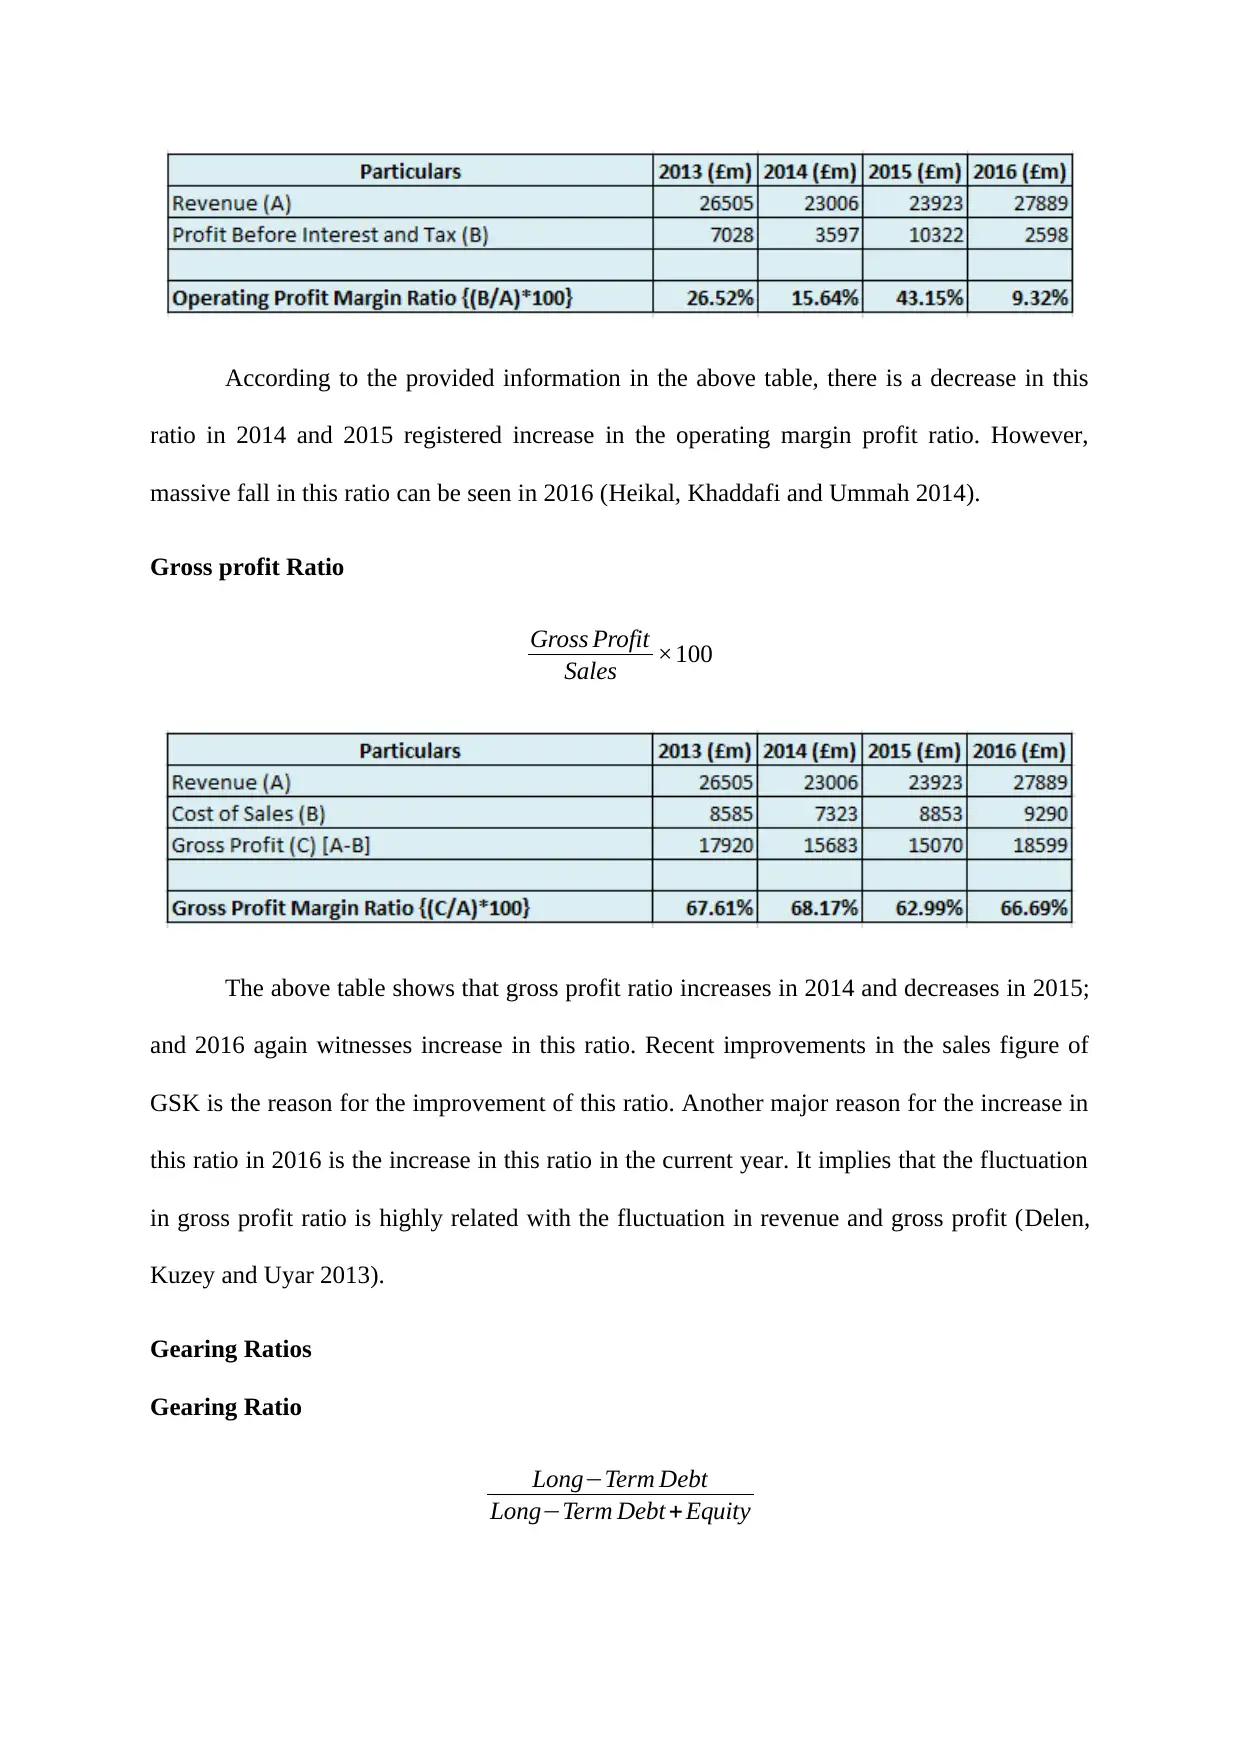
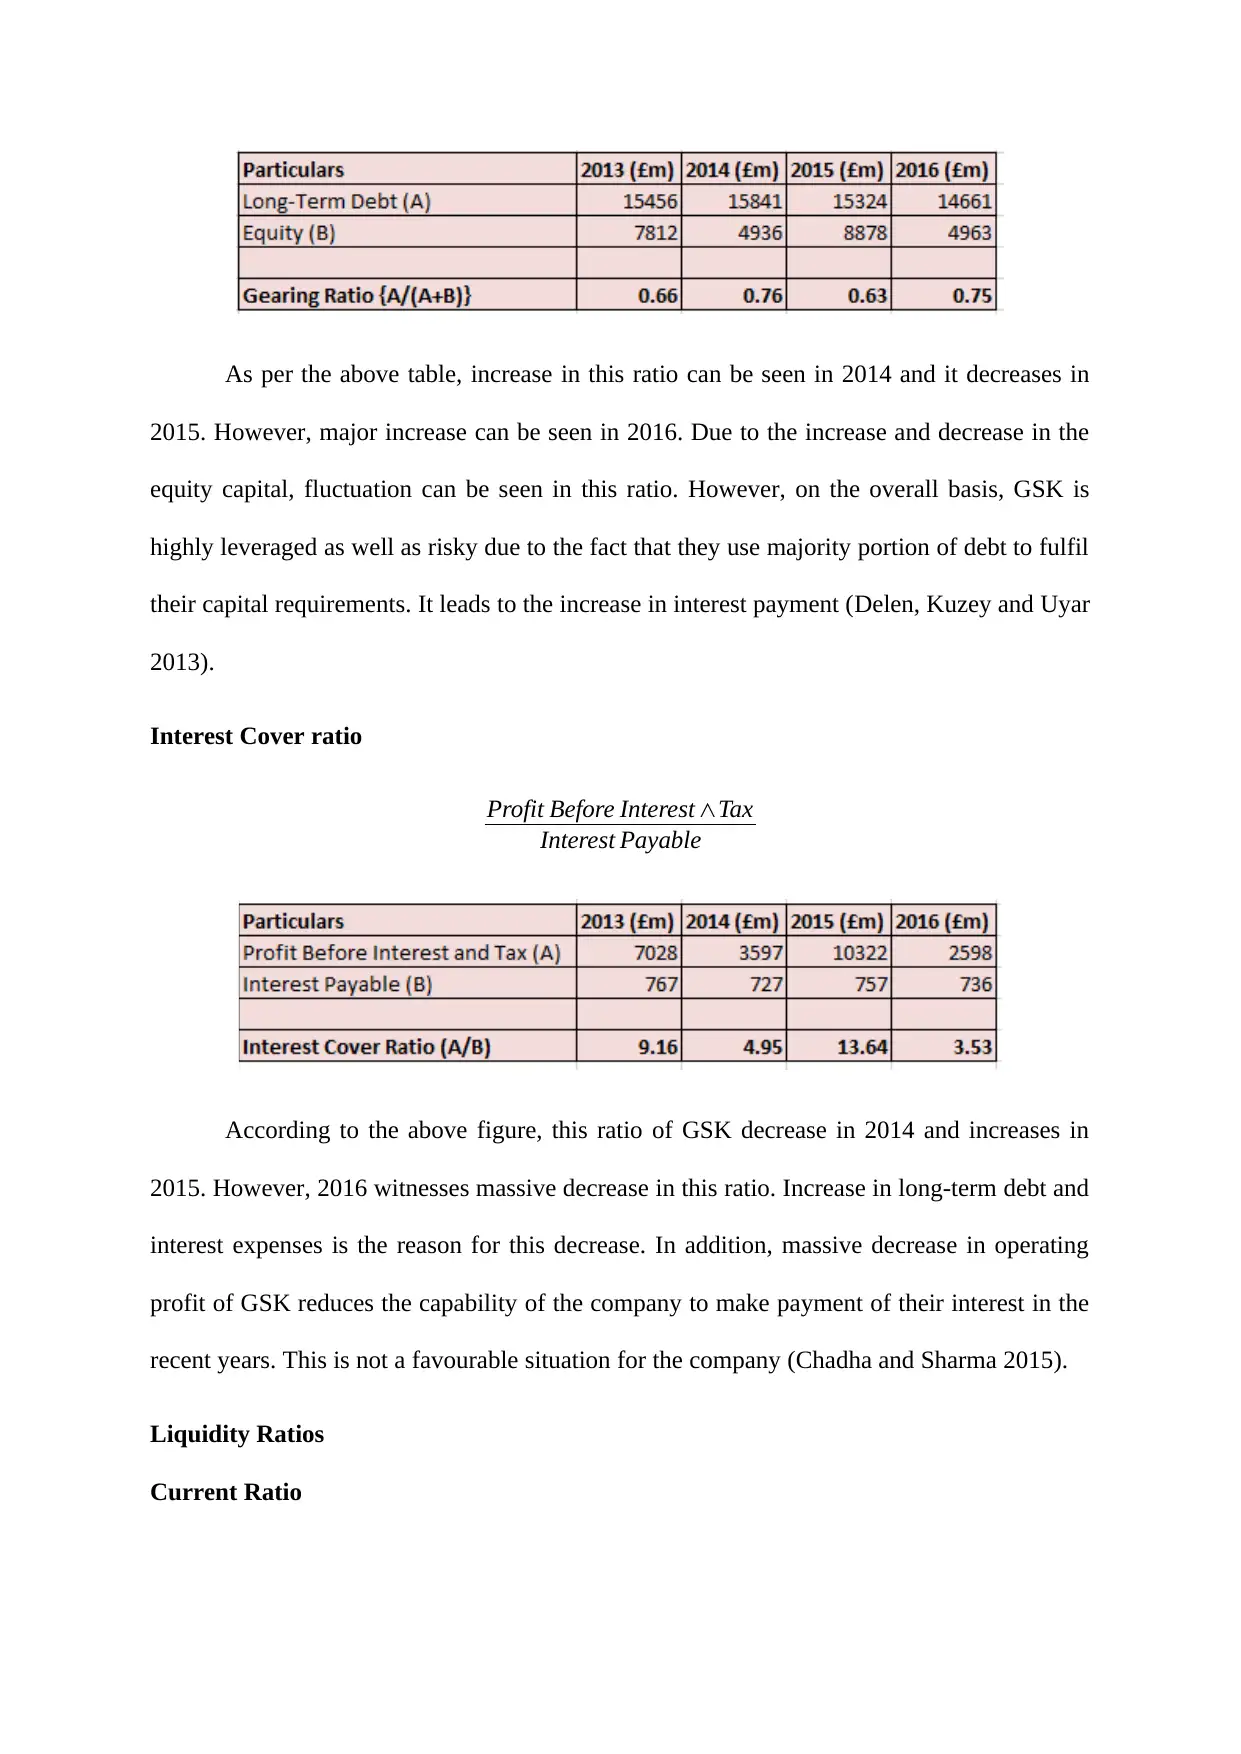
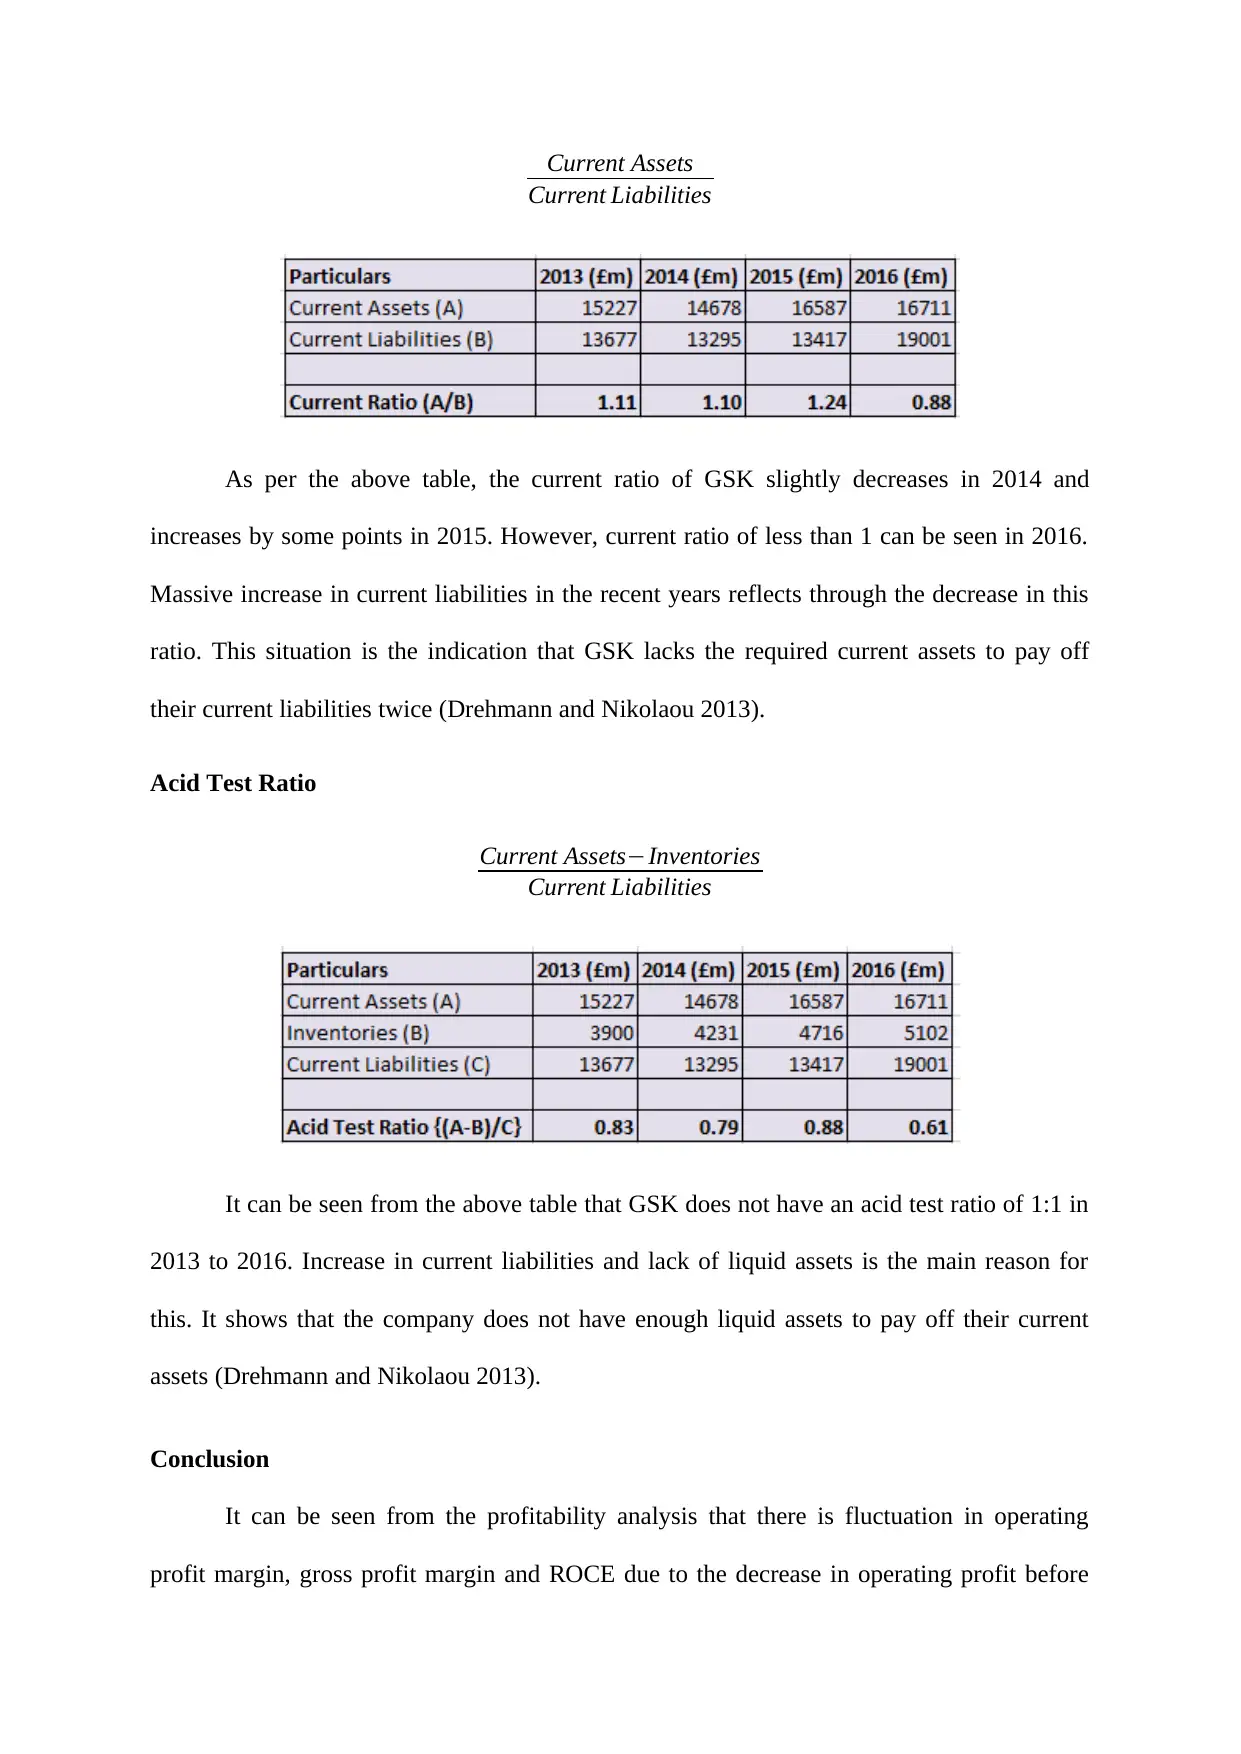
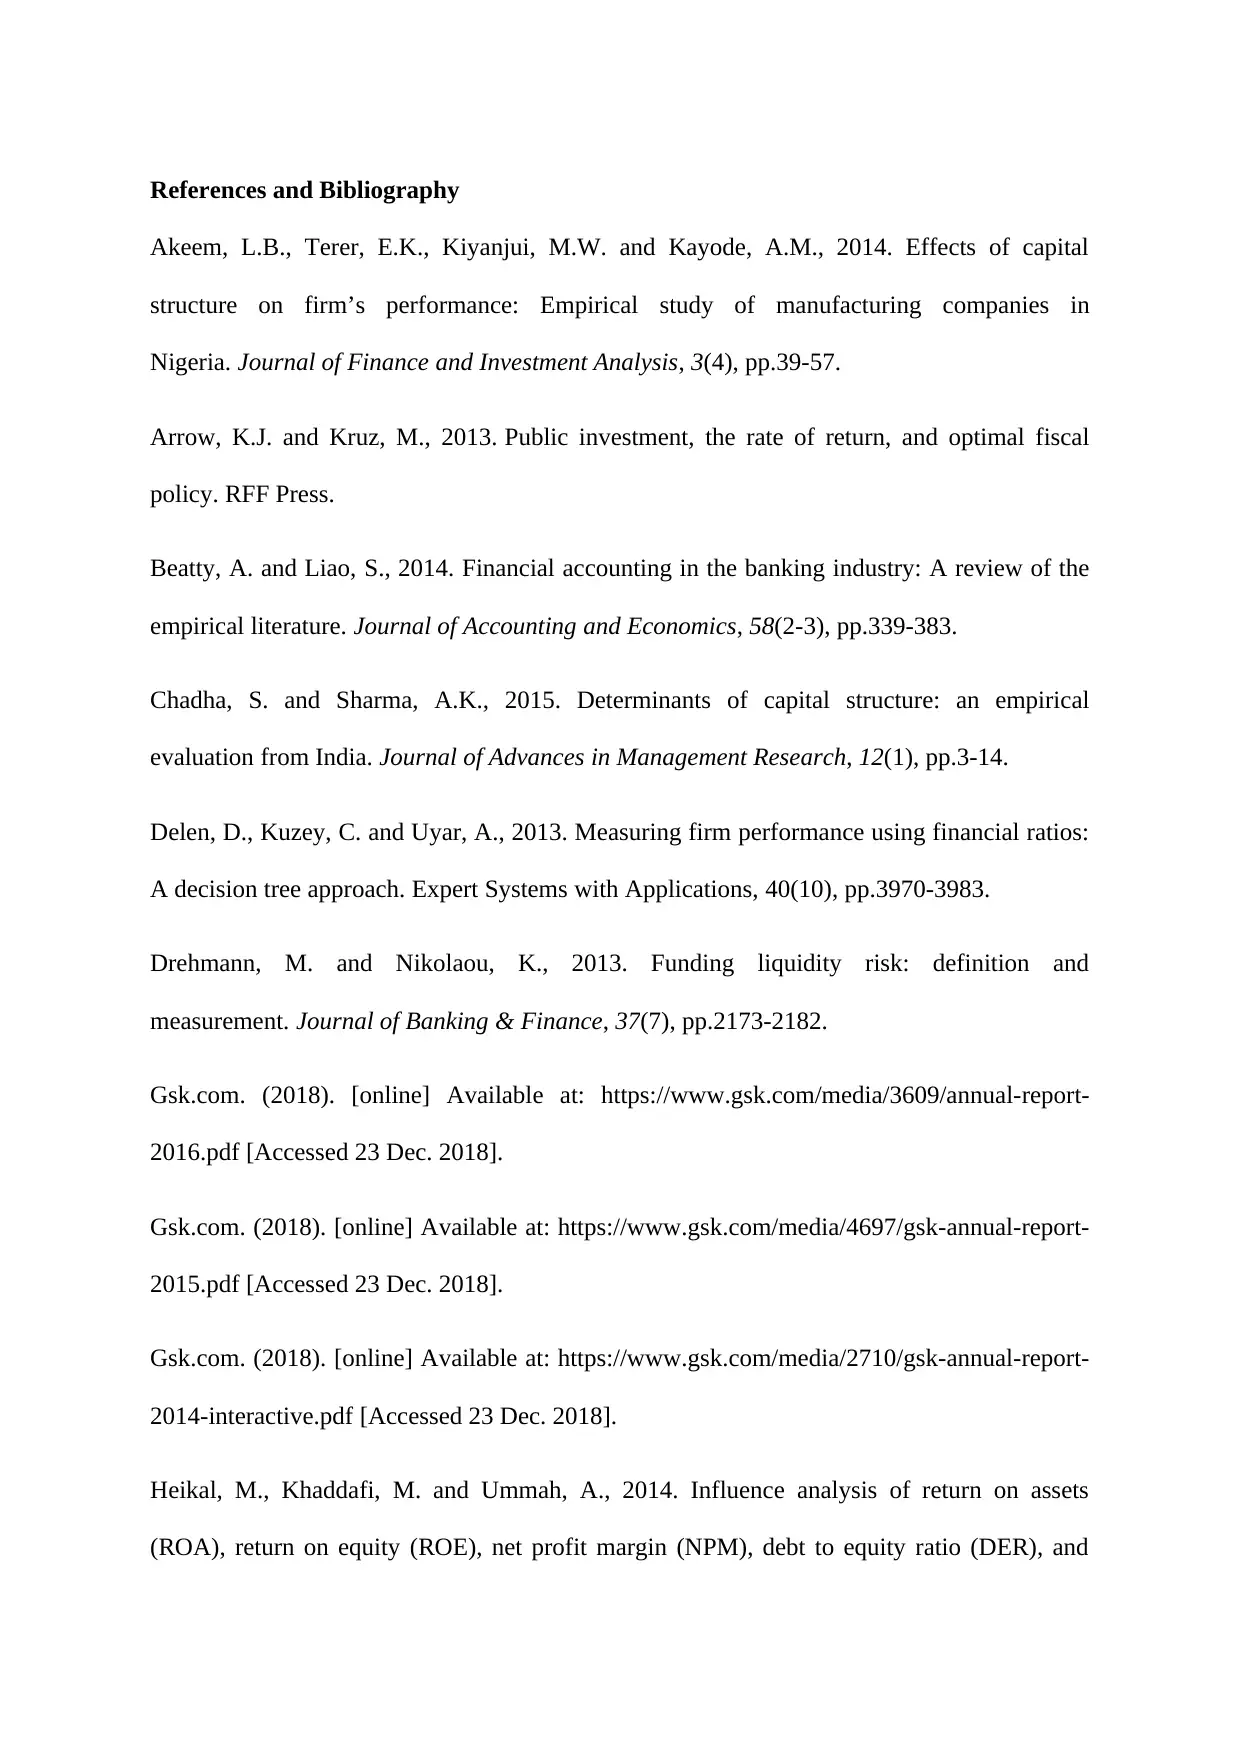
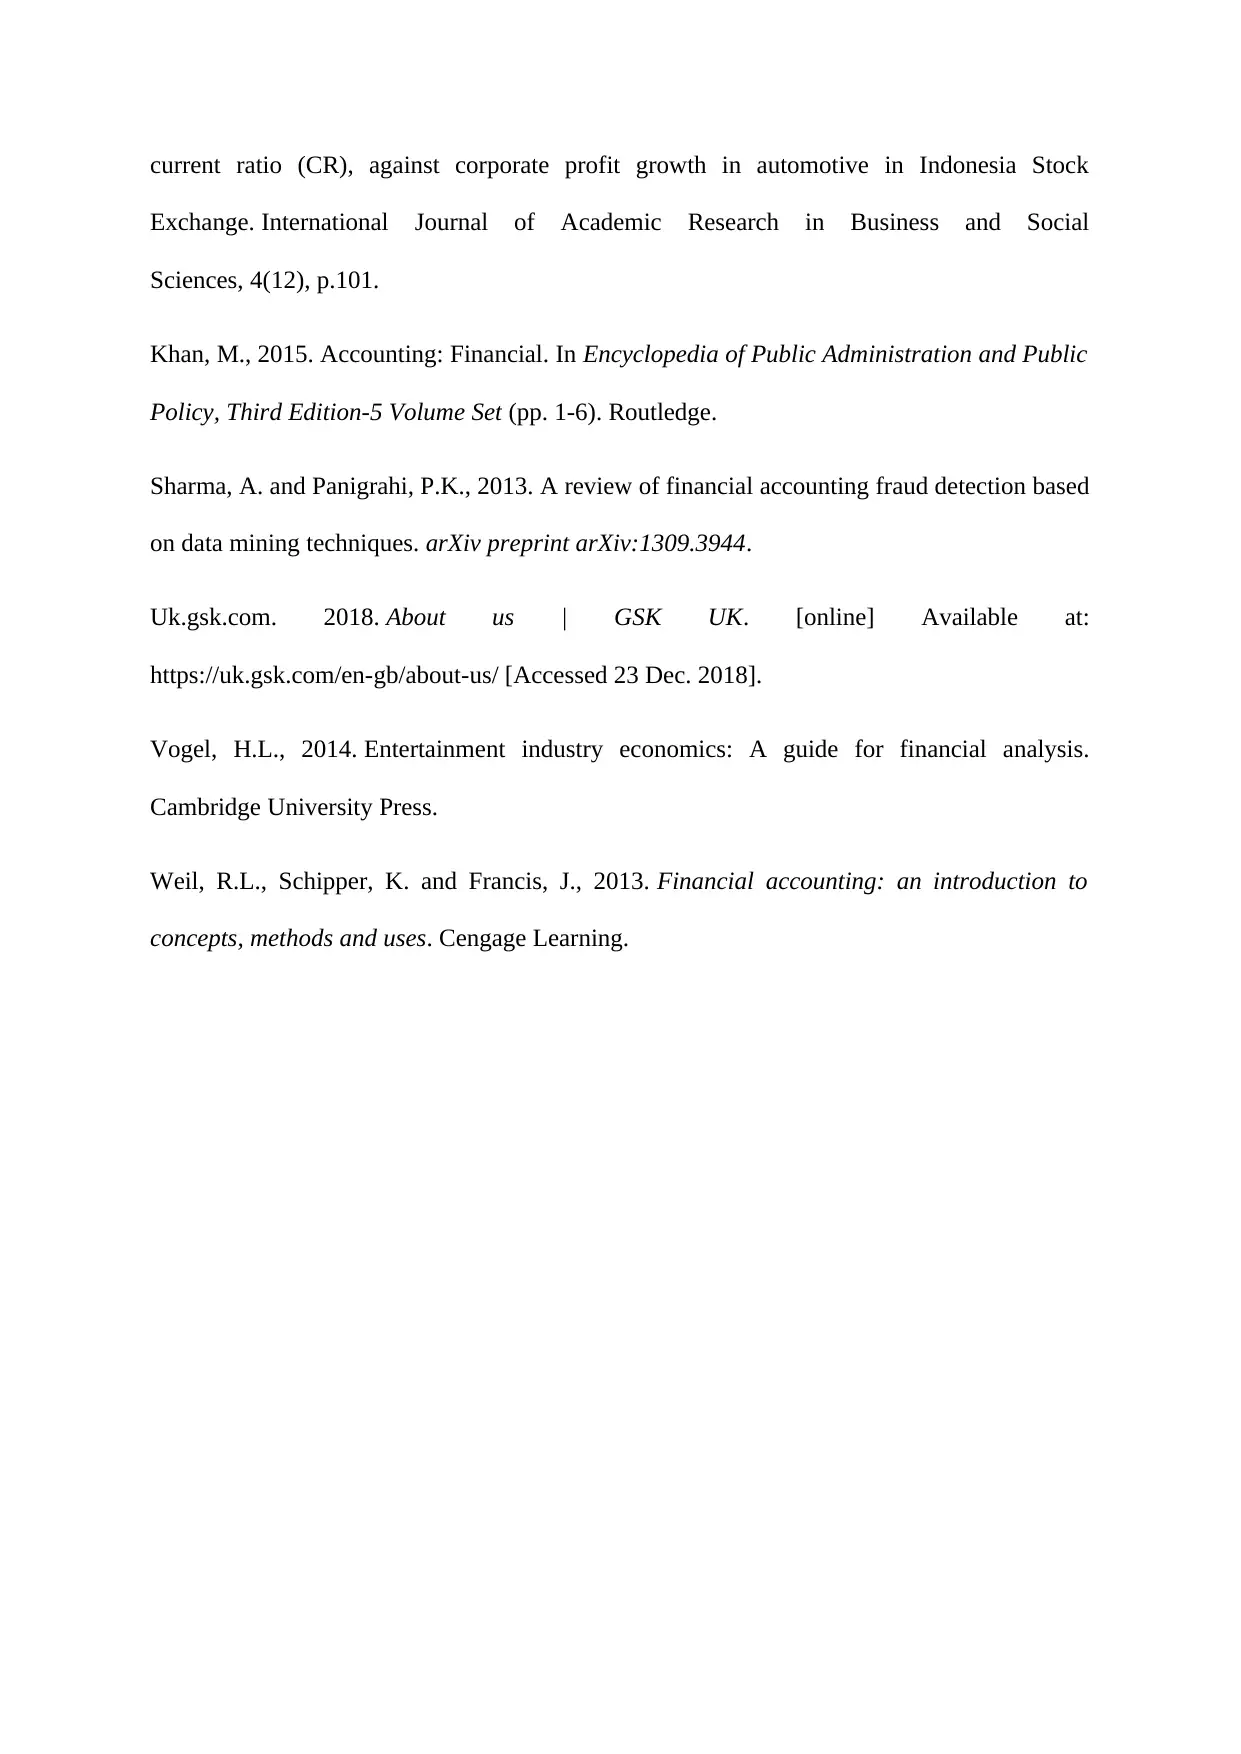
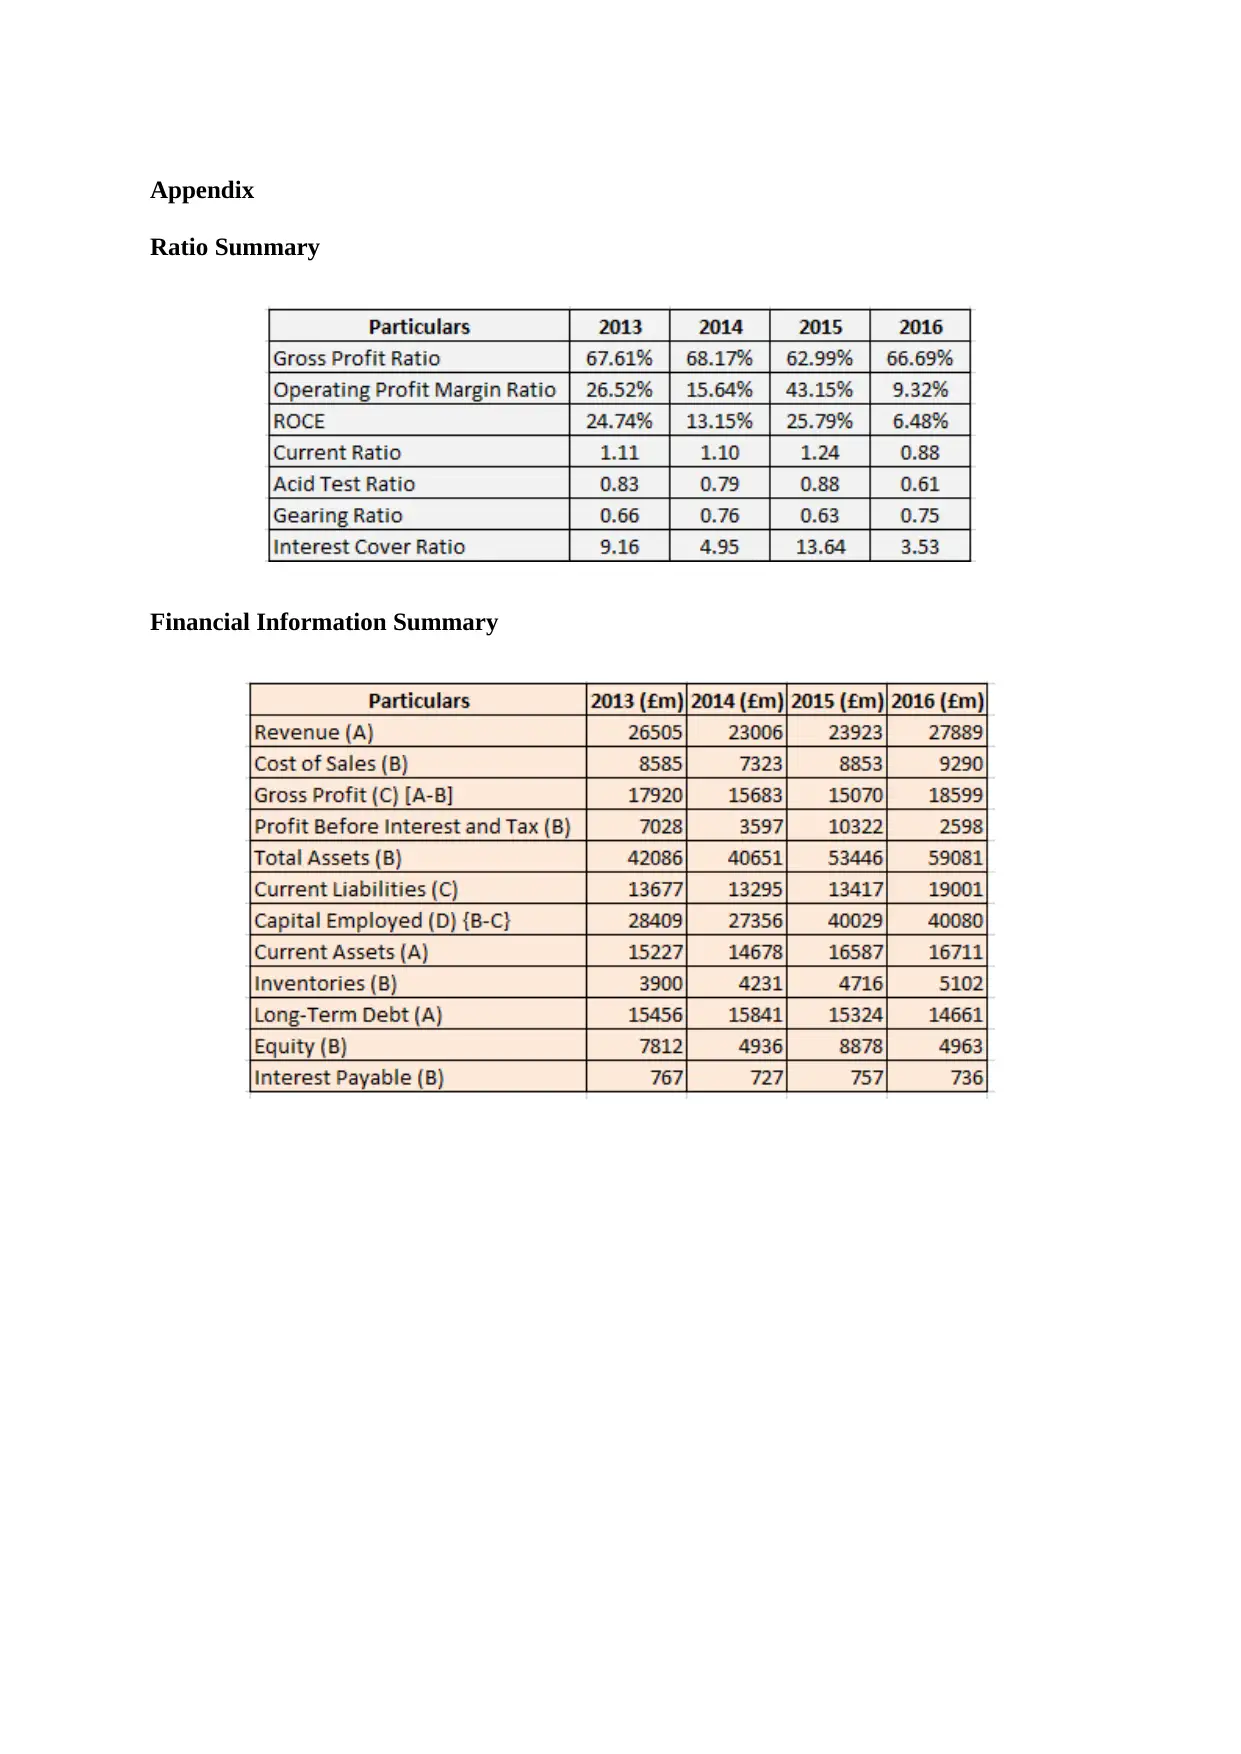
This report provides a financial analysis of GlaxoSmithKline Plc (GSK) using ratio analysis. It begins with a company introduction, followed by a literature review discussing the benefits and limitations of ratio analysis. The report then calculates and interprets key financial ratios, including profitability ratios (ROCE, operating profit margin, gross profit ratio), gearing ratios (gearing ratio, interest cover ratio), and liquidity ratios (current ratio, acid test ratio) for the years 2013-2016. The analysis reveals fluctuations in profitability, a reliance on debt financing, and potential liquidity issues for GSK. The report concludes with a summary of findings and includes references and an appendix with supporting financial information.

Accounting and Finance
Name of the Student
Name of the University
Author’s Note
Name of the Student
Name of the University
Author’s Note
Paraphrase This Document
Need a fresh take? Get an instant paraphrase of this document with our AI Paraphraser

Executive Summary
This report aims at analysing the financial performance of GlaxoSmithKline Plc (GSK)
through ratio analysis. This report involves in providing description of the company. After
that, this report provide a short literature review on ratio analysis that includes the discussion
of the limitations and benefits of ratio analysis. After that, this shows the calculation and
interpretation of the ratios of GSK.

Table of Contents
Company Introduction...............................................................................................................4
Ratio Analysis............................................................................................................................4
Benefits of Ratio Analysis.....................................................................................................4
Limitations of Ratio Analysis................................................................................................5
Calculation and Interpretation of Ratios................................................................................5
Profitability Ratios.............................................................................................................5
Gearing Ratios....................................................................................................................6
Liquidity Ratios..................................................................................................................7
Conclusion..................................................................................................................................8
References and Bibliography...................................................................................................10
Appendix..................................................................................................................................12
⊘ This is a preview!⊘
Do you want full access?
Subscribe today to unlock all pages.

Trusted by 1+ million students worldwide

Company Introduction
GlaxoSmithKline Plc, commonly known as GSK, is one of the leading British
pharmaceuticals company. The company was established in the year of 2000 and it is
headquartered at Bentford, London. The development of GSK was the result of the mergers
of Glaxo Wellcome and SmithKline Beecham. GSK is a science-led global healthcare
company in the presence of a special purpose; that is to assist people in doing more, feeling
better and living longer (gsk.com 2018). The company has an employee base of almost
99,500. It can be seen that the main factor behind the success of the company is their well-
crafter business strategy that is to bring distinguished, needed and high-quality healthcare
products to their consumers with the help of their three global businesses, talented people and
scientific processes (gsk.com 2018). Thus, in the presence of such effective performance and
business strategy, it can be said that GSK has the option of business expansion in the coming
years (gsk.com 2018).
Ratio Analysis
Ratio Analysis is regarded as the process of determining as well as interpreting the
arithmetical relationship on the basis of the financial statements (Vogel 2014).
Benefits of Ratio Analysis
Ratio analysis helps the companies in the processes of forecasting and planning as the
managers can know the trends in costs, sales, profit and others from the computation of
financial values from the financial statements (Weil, Schipper and Francis 2013). At the same
time, the process of ratio analysis helps the managers in the process of budgeting with the
analysis of past sales, expenses and others (Beatty and Liao 2014).
Paraphrase This Document
Need a fresh take? Get an instant paraphrase of this document with our AI Paraphraser

Limitations of Ratio Analysis
The analysis of ratios does not take into consideration the changes in price due to
inflation and others; and it can be regarded as a major limitation of ratio analysis (Sharma and
Panigrahi 2013). Considering of historical information can also be considered as another
major limitation of ratio analysis as they do not reflect the current financial position of the
companies in the presence of historical financial information (Khan 2015).
Calculation and Interpretation of Ratios
Profitability Ratios
ROCE
Profit Before Interest ∧Tax
Capital Employed × 100
*Capital Employed = Total Assets – Current Liabilities
It can be seen from the above table that there is fluctuation in the ROCE of GSK from
2013 to 2016. Decrease in ROCE can be seen in 2014 from 2013; then, it increases in 2015
and 2016 registered massive decrease in ROCE. Massive fluctuation in profit before interest
and tax is one of the reasons for this. It is also observable that there is increase in current
liabilities in 2013 to 2016 along with the increase in total assets (Arrow and Kruz 2013).
Operating Profit Margin Ratio
Profit Before Interest ∧Tax
Sales Revenue × 100

According to the provided information in the above table, there is a decrease in this
ratio in 2014 and 2015 registered increase in the operating margin profit ratio. However,
massive fall in this ratio can be seen in 2016 (Heikal, Khaddafi and Ummah 2014).
Gross profit Ratio
Gross Profit
Sales ×100
The above table shows that gross profit ratio increases in 2014 and decreases in 2015;
and 2016 again witnesses increase in this ratio. Recent improvements in the sales figure of
GSK is the reason for the improvement of this ratio. Another major reason for the increase in
this ratio in 2016 is the increase in this ratio in the current year. It implies that the fluctuation
in gross profit ratio is highly related with the fluctuation in revenue and gross profit (Delen,
Kuzey and Uyar 2013).
Gearing Ratios
Gearing Ratio
Long−Term Debt
Long−Term Debt + Equity
⊘ This is a preview!⊘
Do you want full access?
Subscribe today to unlock all pages.

Trusted by 1+ million students worldwide

As per the above table, increase in this ratio can be seen in 2014 and it decreases in
2015. However, major increase can be seen in 2016. Due to the increase and decrease in the
equity capital, fluctuation can be seen in this ratio. However, on the overall basis, GSK is
highly leveraged as well as risky due to the fact that they use majority portion of debt to fulfil
their capital requirements. It leads to the increase in interest payment (Delen, Kuzey and Uyar
2013).
Interest Cover ratio
Profit Before Interest ∧Tax
Interest Payable
According to the above figure, this ratio of GSK decrease in 2014 and increases in
2015. However, 2016 witnesses massive decrease in this ratio. Increase in long-term debt and
interest expenses is the reason for this decrease. In addition, massive decrease in operating
profit of GSK reduces the capability of the company to make payment of their interest in the
recent years. This is not a favourable situation for the company (Chadha and Sharma 2015).
Liquidity Ratios
Current Ratio
Paraphrase This Document
Need a fresh take? Get an instant paraphrase of this document with our AI Paraphraser

Current Assets
Current Liabilities
As per the above table, the current ratio of GSK slightly decreases in 2014 and
increases by some points in 2015. However, current ratio of less than 1 can be seen in 2016.
Massive increase in current liabilities in the recent years reflects through the decrease in this
ratio. This situation is the indication that GSK lacks the required current assets to pay off
their current liabilities twice (Drehmann and Nikolaou 2013).
Acid Test Ratio
Current Assets−Inventories
Current Liabilities
It can be seen from the above table that GSK does not have an acid test ratio of 1:1 in
2013 to 2016. Increase in current liabilities and lack of liquid assets is the main reason for
this. It shows that the company does not have enough liquid assets to pay off their current
assets (Drehmann and Nikolaou 2013).
Conclusion
It can be seen from the profitability analysis that there is fluctuation in operating
profit margin, gross profit margin and ROCE due to the decrease in operating profit before
Current Liabilities
As per the above table, the current ratio of GSK slightly decreases in 2014 and
increases by some points in 2015. However, current ratio of less than 1 can be seen in 2016.
Massive increase in current liabilities in the recent years reflects through the decrease in this
ratio. This situation is the indication that GSK lacks the required current assets to pay off
their current liabilities twice (Drehmann and Nikolaou 2013).
Acid Test Ratio
Current Assets−Inventories
Current Liabilities
It can be seen from the above table that GSK does not have an acid test ratio of 1:1 in
2013 to 2016. Increase in current liabilities and lack of liquid assets is the main reason for
this. It shows that the company does not have enough liquid assets to pay off their current
assets (Drehmann and Nikolaou 2013).
Conclusion
It can be seen from the profitability analysis that there is fluctuation in operating
profit margin, gross profit margin and ROCE due to the decrease in operating profit before

interest and tax along with fluctuation in revenue. Analysis of the gearing ratio shows that
GSK uses debt capital more than the equity capital that increases the interest expenses of the
company. For this reason, irregularity can be seen in the payment of interest by the company.
Lastly, the liquidity analysis states that GSK lacks required current assets and liquid assets to
pay off their current liabilities.
⊘ This is a preview!⊘
Do you want full access?
Subscribe today to unlock all pages.

Trusted by 1+ million students worldwide

References and Bibliography
Akeem, L.B., Terer, E.K., Kiyanjui, M.W. and Kayode, A.M., 2014. Effects of capital
structure on firm’s performance: Empirical study of manufacturing companies in
Nigeria. Journal of Finance and Investment Analysis, 3(4), pp.39-57.
Arrow, K.J. and Kruz, M., 2013. Public investment, the rate of return, and optimal fiscal
policy. RFF Press.
Beatty, A. and Liao, S., 2014. Financial accounting in the banking industry: A review of the
empirical literature. Journal of Accounting and Economics, 58(2-3), pp.339-383.
Chadha, S. and Sharma, A.K., 2015. Determinants of capital structure: an empirical
evaluation from India. Journal of Advances in Management Research, 12(1), pp.3-14.
Delen, D., Kuzey, C. and Uyar, A., 2013. Measuring firm performance using financial ratios:
A decision tree approach. Expert Systems with Applications, 40(10), pp.3970-3983.
Drehmann, M. and Nikolaou, K., 2013. Funding liquidity risk: definition and
measurement. Journal of Banking & Finance, 37(7), pp.2173-2182.
Gsk.com. (2018). [online] Available at: https://www.gsk.com/media/3609/annual-report-
2016.pdf [Accessed 23 Dec. 2018].
Gsk.com. (2018). [online] Available at: https://www.gsk.com/media/4697/gsk-annual-report-
2015.pdf [Accessed 23 Dec. 2018].
Gsk.com. (2018). [online] Available at: https://www.gsk.com/media/2710/gsk-annual-report-
2014-interactive.pdf [Accessed 23 Dec. 2018].
Heikal, M., Khaddafi, M. and Ummah, A., 2014. Influence analysis of return on assets
(ROA), return on equity (ROE), net profit margin (NPM), debt to equity ratio (DER), and
Paraphrase This Document
Need a fresh take? Get an instant paraphrase of this document with our AI Paraphraser

current ratio (CR), against corporate profit growth in automotive in Indonesia Stock
Exchange. International Journal of Academic Research in Business and Social
Sciences, 4(12), p.101.
Khan, M., 2015. Accounting: Financial. In Encyclopedia of Public Administration and Public
Policy, Third Edition-5 Volume Set (pp. 1-6). Routledge.
Sharma, A. and Panigrahi, P.K., 2013. A review of financial accounting fraud detection based
on data mining techniques. arXiv preprint arXiv:1309.3944.
Uk.gsk.com. 2018. About us | GSK UK. [online] Available at:
https://uk.gsk.com/en-gb/about-us/ [Accessed 23 Dec. 2018].
Vogel, H.L., 2014. Entertainment industry economics: A guide for financial analysis.
Cambridge University Press.
Weil, R.L., Schipper, K. and Francis, J., 2013. Financial accounting: an introduction to
concepts, methods and uses. Cengage Learning.

Appendix
Ratio Summary
Financial Information Summary
Ratio Summary
Financial Information Summary
⊘ This is a preview!⊘
Do you want full access?
Subscribe today to unlock all pages.

Trusted by 1+ million students worldwide
1 out of 20
Related Documents

Your All-in-One AI-Powered Toolkit for Academic Success.
+13062052269
info@desklib.com
Available 24*7 on WhatsApp / Email
Unlock your academic potential
Copyright © 2020–2025 A2Z Services. All Rights Reserved. Developed and managed by ZUCOL.