International Finance: Ratio Analysis, WACC & Investment Appraisal
VerifiedAdded on 2023/06/18
|19
|4763
|456
Report
AI Summary
This report provides a comprehensive analysis of international finance concepts, focusing on ratio analysis of Cwire Ltd and Oxford BioMedica, estimation of the company's cost of capital using publicly available data, and evaluation of how the company might meet funding requirements. It discusses traditional and modern techniques of raising capital and critically evaluates a project using investment appraisal techniques, offering possible revisions to the proposal. The report includes calculations for WACC using both the Dividend Growth Model (DVM) and Capital Asset Pricing Model (CAPM) for both companies, providing a detailed financial assessment and comparison.

Paraphrase This Document
Need a fresh take? Get an instant paraphrase of this document with our AI Paraphraser
Table of Contents
INTRODUCTION...........................................................................................................................3
PART A...........................................................................................................................................3
Introduction of Proxy Company..................................................................................................3
Ratio analysis of Cwire Ltd and Oxford BioMedica:..................................................................3
PART B...........................................................................................................................................6
Estimate of the company's cost of capital using publicly available data. Discuss and evaluate
how the company might meet the funding requirements of the project......................................6
Traditional and modern techniques of raising capital..................................................................8
PART C.........................................................................................................................................11
Critically evaluate the project by using investment appraisal techniques and advise possible
revision to the proposal..............................................................................................................11
REFERENCES..............................................................................................................................15
REFERENCES................................................................................................................................1
INTRODUCTION
International finance is concerned with the management of money in a multinational
business. It shows how to participate in international marketplace, transfer public money, and
profit from particular ventures. In truth, international finance is a critical element of financial
networks. It primarily deals with issues of multi-country monetary interactions. International
finance includes currency rates, financial organizations across the worldwide, foreign direct
investment (FDI), and other important aspects of world economic management (Potts, 2017).
The Landtech firm, which provides financial solutions to its clients, is the subject of this study.
One of Cwire Ltd's clients seeks advice from a variety of customers. It is a privately held
technological manufacturing company situated in Corby, England. Oxford Biomedica, other
proxy firm in this study, is a biological and tissue engineering organization that specializes on
producing biomarker therapies. Financial ratios, WACC, and investment assessment approaches
are included in this paper.
PART A
Introduction of Proxy Company
Oxford BioMedica is a biology and muscle restoration company that also produces
biomarker treatments. It is listed on the London Stock Exchange and is a constituent of the FTSE
250 Index. In 1995, Oxford University. It went public in 1996 as part of the Autonomous
Property Sector's initial public offering (IPO).
Ratio analysis:
This is one of the major aspects that would lead to make an analysis of the financial
health and performance of the company (Septiani, Liyundira and Wibisono, 2021). Financial
ratio would determine the financial performance of the company in term of analysing that
whether it is performing well or not.
Ratio analysis of Cwire Ltd and Oxford BioMedica:
Profitability ratio:
This ratio would make an analysis of the profitability of the company i.e. its ability to
make generation of income while making it compared it with the expenses (Nalurita, 2017). It
includes:
Net profit margin:
⊘ This is a preview!⊘
Do you want full access?
Subscribe today to unlock all pages.
Trusted by 1+ million students worldwide
This ratio measures the profitability aspect of the company (Purwanti, 2019). While
making an analysis of the Cwire and Oxford BioMedica it is found that the net profit margin of
Cwire is 43% in 2019 and 2020, while in case of Oxford BioMedica the ratio is 100% in 2019
and 99% in 2020. This shows that profitability proportion of the proxy company i.e. Oxford
BioMedica is higher than benchmark company i.e. Cwire. This shows that the financial
performance of the proxy company is meeting the benchmark and is ensuring high profitability
(Durrani, Rosmin and Volz, 2020).
ROCE:
This ratio measures the financial performance of the company in term of generation of
profit with the efficient employment of capital (Wijaya and Yudawisastra, 2019). In case of
Cwire the ROCE is 43% in 2019 and 17% in 2020 while in case of Oxford BioMedica the ratio
is 84% in 2019 and 78% in 2020. This shows that the proxy company is showing a high financial
performance while making it compared with the benchmark company. In the same way it is also
analysed that the Oxford BioMedica is showing a declining trend in 2020 with decrease ratio but
still it hold a good performance in comparison of the benchmark company.
Liquidity ratio:
This ratio is related with the measurement of the efficiency of the company in terms of
measuring the liquidity i.e. how efficient the company would be in terms of making a payment of
its short terms liability (Khidirova, 2018). It includes:
Current ratio or working capital ratio:
This ratio measures the liquidity of the company that shows how efficient the company is
or hold current assets that it would make repayment of its current liabilities (Yenni and et.al.,
2021). This ratio is also used to measure the capability of the company in terms of making an
analysis of the working capacity or it shows that the company would have adequate funds with
respect to meeting the daily operations. In case of Oxford BioMedia the current ratio is 1.97 in
2019 and 2.08 in 2020. This shows the high and raising current ratio which indicate that the
capacity of the company is raising in terms of making a repayment of its current liabilities. This
shows the high liquidity position of the company.
Gearing ratio:
Paraphrase This Document
Need a fresh take? Get an instant paraphrase of this document with our AI Paraphraser
This ratio makes comparison of the financial structure of the company i.e. it make a
comparison of debt with the equity. It includes:
Debt equity ratio:
This ratio is related with the measurement of contribution of creditors, shareholders along
with owners in the capital employed of the business (Nuryani and Sunarsi, 2020). In case of
Cwire Ltd the ratio is 4% in 2019 and 2020 while in case of Oxford BioMedia the ratio is 3.81
(29/76000) in 2019 and 4.60 (52/113000) in 2020. This shows that the proxy company’s
performance while making it compared it with the benchmark company is moderate. This is
because the Oxford BioMedia’s debt ratio is showing a declining phase from 2019 to 2020. This
means that the company is not able to meet the benchmark (Svistun, Zavora and Khudolii, 2018).
Investor ratio:
These are the financial ratio that is used by the investor in order to make an evaluation of
the company capacity with respect to the generation of return in respect to the investment made
by them. It includes:
Return on equity:
This ratio measures the rate of return that would be earned by the shareholders on their
common shareholding (Lubis and Alfiyah, 2021). In case of Cwire the ratio is 36% in 2019 while
in 2020 it decline and become 14%. However, while making a comparison with the Oxford
BioMedia it is found that the ratio is declining but id declining rate is lower than the benchmark
company i.e. 84% in 2019 and 77% in 2020. This shows that the proxy company shows better
performance while making it compared it with the benchmark company.
Earnings per share:
It measures the net income that would be made used for the payment of its holders of
common stock. Rising of company’s EPS shows a positive performance of the company. While
making an analysis of the Cwire Ltd it was observed that the ratio was declining because in 2019
it was 360.74 but in 2020 it become 144.74 while in case of Oxford BioMedica the ratio in 2019
was 85.33 and in 2020 it become 115.684. This shows that the performance of the proxy
company is high and positive while making it compared it with the benchmark company.
In brief it would be right to state that while making an analysis of the financial performance
of Cwire Ltd (Benchmark company) with the Oxford BioMedia (Proxy company) through ratio
analysis, the performance of Oxford BioMedica would be high and effective while making it
compared it with the benchmark company. This also means that the proxy company is meeting
the benchmark along with showing high financial performance (Sherov, 2019).
PART B
Estimate of the company's cost of capital using publicly available data. Discuss and evaluate how
the company might meet the funding requirements of the project
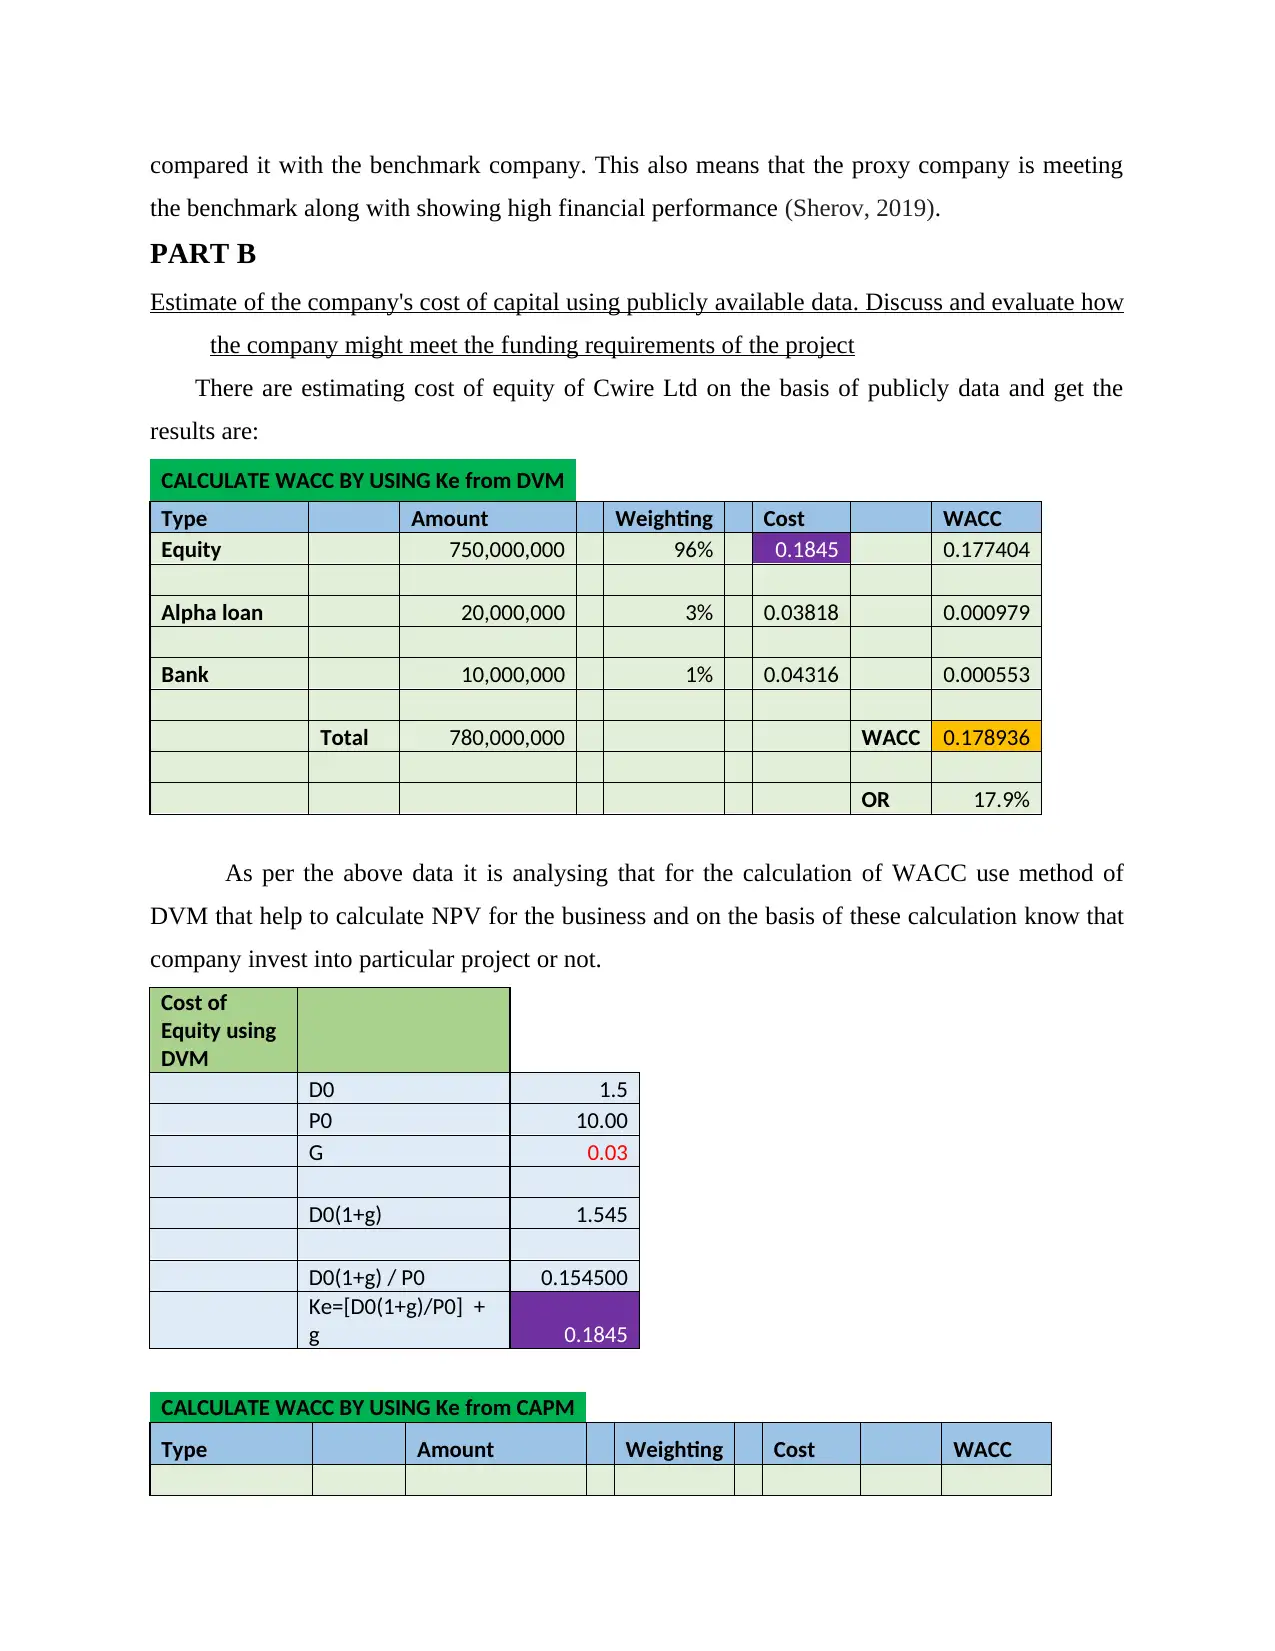
There are estimating cost of equity of Cwire Ltd on the basis of publicly data and get the
results are:
CALCULATE WACC BY USING Ke from DVM
Type Amount Weighting Cost WACC
Equity 750,000,000 96% 0.1845 0.177404
Alpha loan 20,000,000 3% 0.03818 0.000979
Bank 10,000,000 1% 0.04316 0.000553
Total 780,000,000 WACC 0.178936
OR 17.9%
As per the above data it is analysing that for the calculation of WACC use method of
DVM that help to calculate NPV for the business and on the basis of these calculation know that
company invest into particular project or not.
Cost of
Equity using
DVM
D0 1.5
P0 10.00
G 0.03
D0(1+g) 1.545
D0(1+g) / P0 0.154500
Ke=[D0(1+g)/P0] +
g 0.1845
CALCULATE WACC BY USING Ke from CAPM
Type Amount Weighting Cost WACC
the benchmark along with showing high financial performance (Sherov, 2019).
PART B
Estimate of the company's cost of capital using publicly available data. Discuss and evaluate how
the company might meet the funding requirements of the project
There are estimating cost of equity of Cwire Ltd on the basis of publicly data and get the
results are:
CALCULATE WACC BY USING Ke from DVM
Type Amount Weighting Cost WACC
Equity 750,000,000 96% 0.1845 0.177404
Alpha loan 20,000,000 3% 0.03818 0.000979
Bank 10,000,000 1% 0.04316 0.000553
Total 780,000,000 WACC 0.178936
OR 17.9%
As per the above data it is analysing that for the calculation of WACC use method of
DVM that help to calculate NPV for the business and on the basis of these calculation know that
company invest into particular project or not.
Cost of
Equity using
DVM
D0 1.5
P0 10.00
G 0.03
D0(1+g) 1.545
D0(1+g) / P0 0.154500
Ke=[D0(1+g)/P0] +
g 0.1845
CALCULATE WACC BY USING Ke from CAPM
Type Amount Weighting Cost WACC
⊘ This is a preview!⊘
Do you want full access?
Subscribe today to unlock all pages.
Trusted by 1+ million students worldwide
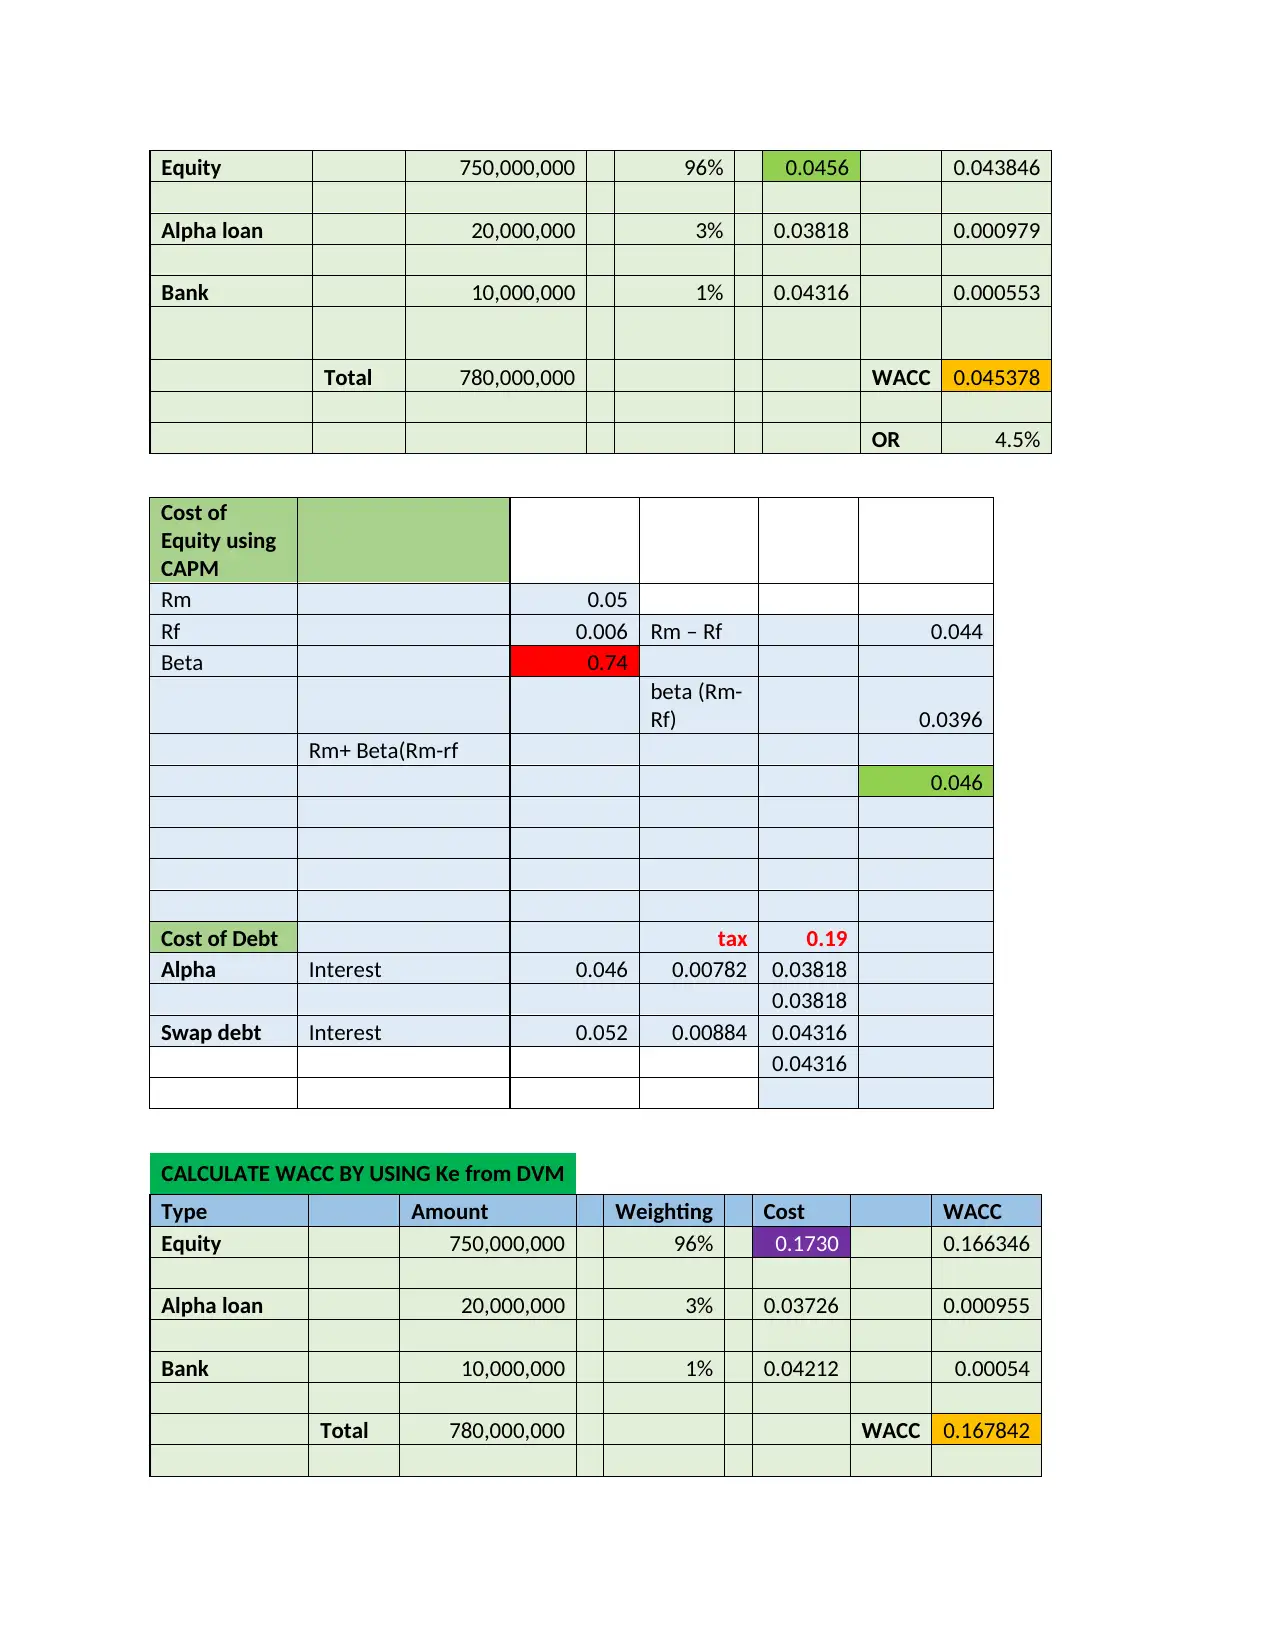
Equity 750,000,000 96% 0.0456 0.043846
Alpha loan 20,000,000 3% 0.03818 0.000979
Bank 10,000,000 1% 0.04316 0.000553
Total 780,000,000 WACC 0.045378
OR 4.5%
Cost of
Equity using
CAPM
Rm 0.05
Rf 0.006 Rm – Rf 0.044
Beta 0.74
beta (Rm-
Rf) 0.0396
Rm+ Beta(Rm-rf
0.046
Cost of Debt tax 0.19
Alpha Interest 0.046 0.00782 0.03818
0.03818
Swap debt Interest 0.052 0.00884 0.04316
0.04316
CALCULATE WACC BY USING Ke from DVM
Type Amount Weighting Cost WACC
Equity 750,000,000 96% 0.1730 0.166346
Alpha loan 20,000,000 3% 0.03726 0.000955
Bank 10,000,000 1% 0.04212 0.00054
Total 780,000,000 WACC 0.167842
Paraphrase This Document
Need a fresh take? Get an instant paraphrase of this document with our AI Paraphraser
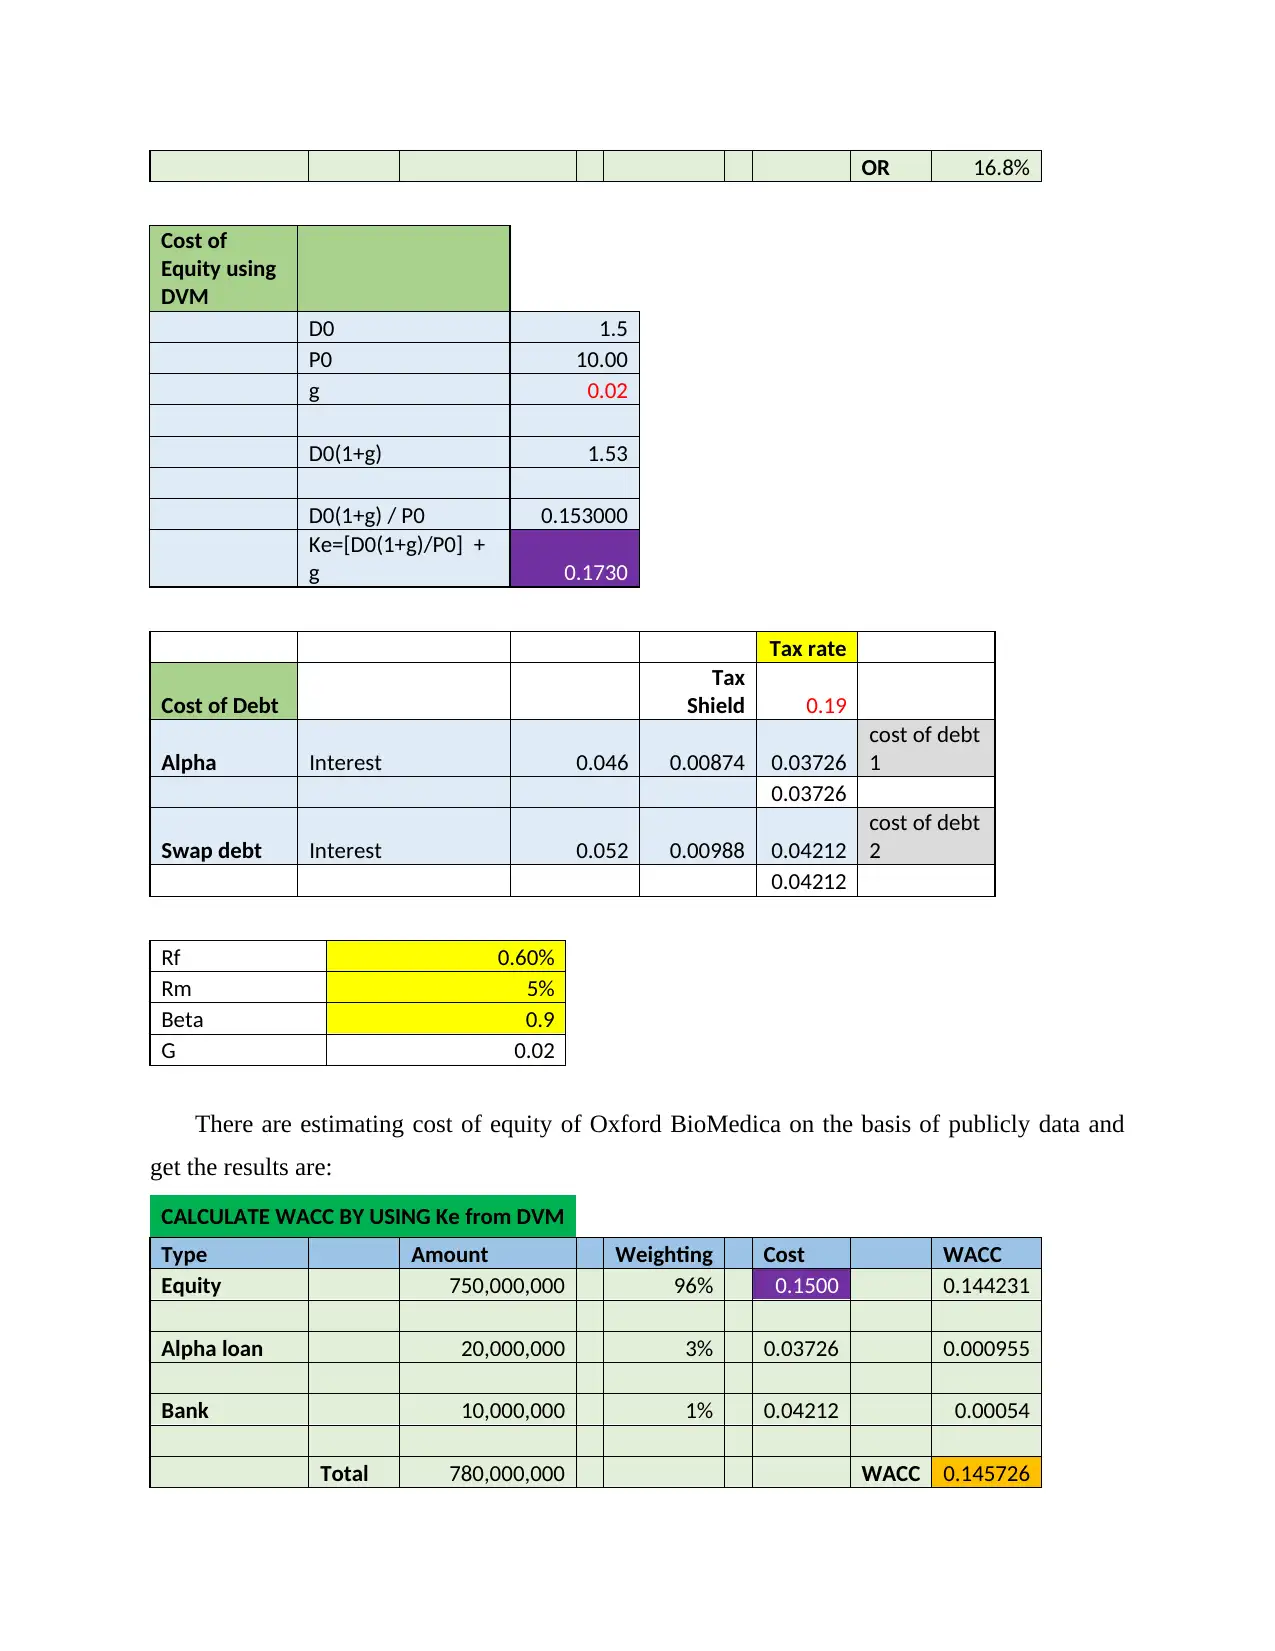
OR 16.8%
Cost of
Equity using
DVM
D0 1.5
P0 10.00
g 0.02
D0(1+g) 1.53
D0(1+g) / P0 0.153000
Ke=[D0(1+g)/P0] +
g 0.1730
Tax rate
Cost of Debt
Tax
Shield 0.19
Alpha Interest 0.046 0.00874 0.03726
cost of debt
1
0.03726
Swap debt Interest 0.052 0.00988 0.04212
cost of debt
2
0.04212
Rf 0.60%
Rm 5%
Beta 0.9
G 0.02
There are estimating cost of equity of Oxford BioMedica on the basis of publicly data and
get the results are:
CALCULATE WACC BY USING Ke from DVM
Type Amount Weighting Cost WACC
Equity 750,000,000 96% 0.1500 0.144231
Alpha loan 20,000,000 3% 0.03726 0.000955
Bank 10,000,000 1% 0.04212 0.00054
Total 780,000,000 WACC 0.145726
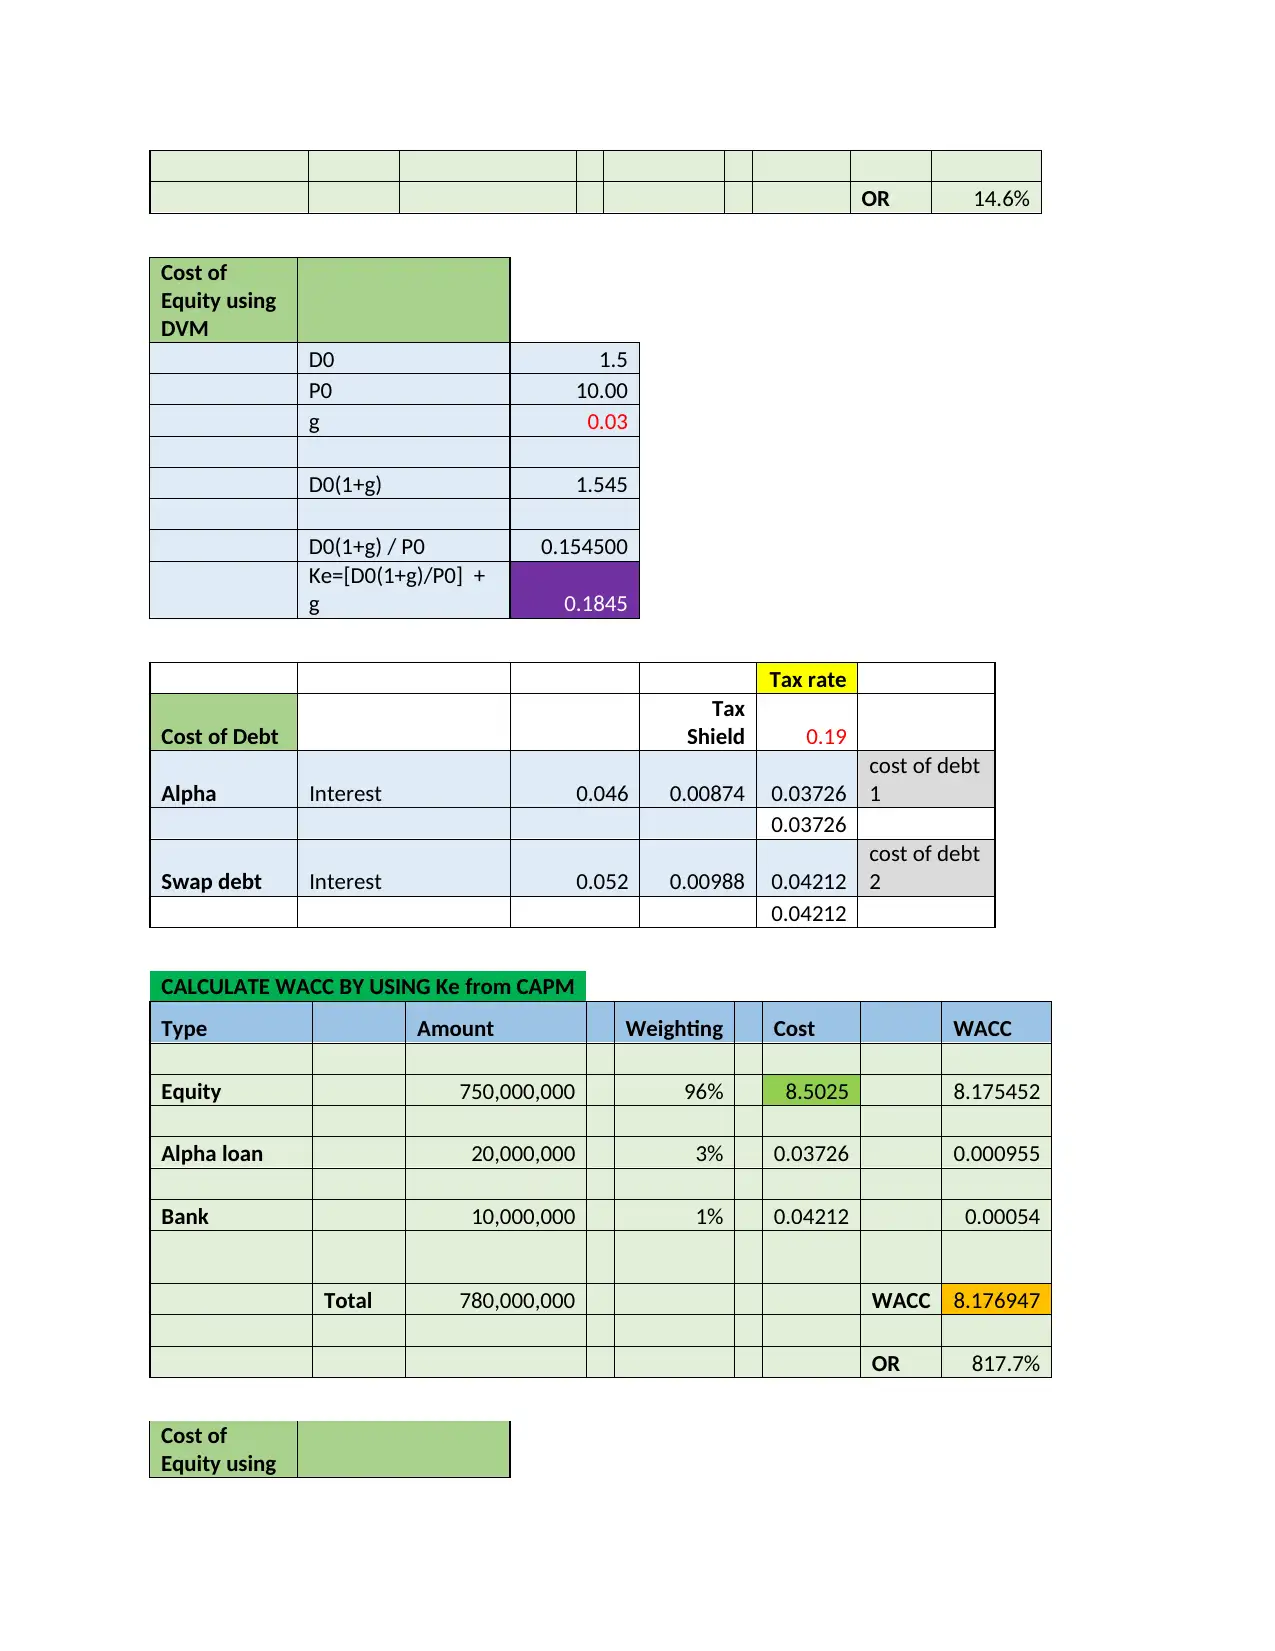
OR 14.6%
Cost of
Equity using
DVM
D0 1.5
P0 10.00
g 0.03
D0(1+g) 1.545
D0(1+g) / P0 0.154500
Ke=[D0(1+g)/P0] +
g 0.1845
Tax rate
Cost of Debt
Tax
Shield 0.19
Alpha Interest 0.046 0.00874 0.03726
cost of debt
1
0.03726
Swap debt Interest 0.052 0.00988 0.04212
cost of debt
2
0.04212
CALCULATE WACC BY USING Ke from CAPM
Type Amount Weighting Cost WACC
Equity 750,000,000 96% 8.5025 8.175452
Alpha loan 20,000,000 3% 0.03726 0.000955
Bank 10,000,000 1% 0.04212 0.00054
Total 780,000,000 WACC 8.176947
OR 817.7%
Cost of
Equity using
Cost of
Equity using
DVM
D0 1.5
P0 10.00
g 0.03
D0(1+g) 1.545
D0(1+g) / P0 0.154500
Ke=[D0(1+g)/P0] +
g 0.1845
Tax rate
Cost of Debt
Tax
Shield 0.19
Alpha Interest 0.046 0.00874 0.03726
cost of debt
1
0.03726
Swap debt Interest 0.052 0.00988 0.04212
cost of debt
2
0.04212
CALCULATE WACC BY USING Ke from CAPM
Type Amount Weighting Cost WACC
Equity 750,000,000 96% 8.5025 8.175452
Alpha loan 20,000,000 3% 0.03726 0.000955
Bank 10,000,000 1% 0.04212 0.00054
Total 780,000,000 WACC 8.176947
OR 817.7%
Cost of
Equity using
⊘ This is a preview!⊘
Do you want full access?
Subscribe today to unlock all pages.
Trusted by 1+ million students worldwide
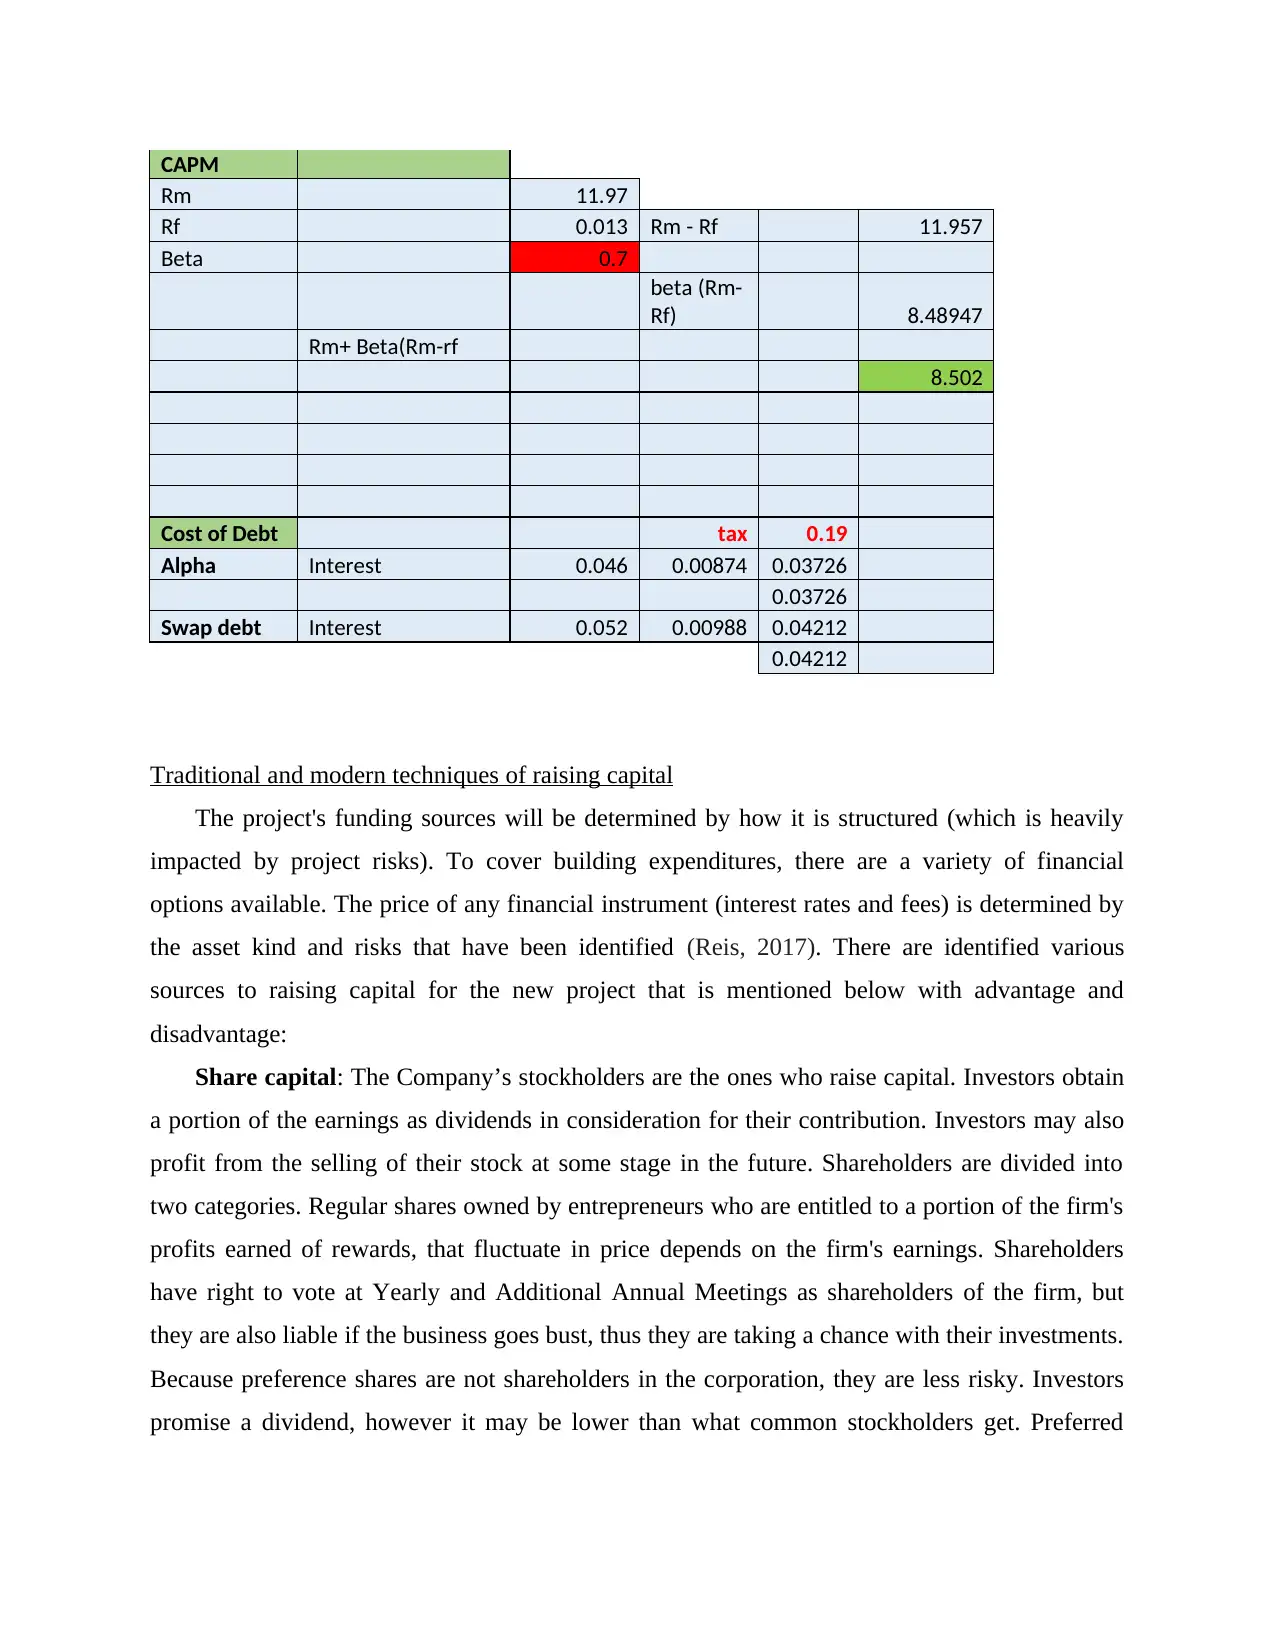
CAPM
Rm 11.97
Rf 0.013 Rm - Rf 11.957
Beta 0.7
beta (Rm-
Rf) 8.48947
Rm+ Beta(Rm-rf
8.502
Cost of Debt tax 0.19
Alpha Interest 0.046 0.00874 0.03726
0.03726
Swap debt Interest 0.052 0.00988 0.04212
0.04212
Traditional and modern techniques of raising capital
The project's funding sources will be determined by how it is structured (which is heavily
impacted by project risks). To cover building expenditures, there are a variety of financial
options available. The price of any financial instrument (interest rates and fees) is determined by
the asset kind and risks that have been identified (Reis, 2017). There are identified various
sources to raising capital for the new project that is mentioned below with advantage and
disadvantage:
Share capital: The Company’s stockholders are the ones who raise capital. Investors obtain
a portion of the earnings as dividends in consideration for their contribution. Investors may also
profit from the selling of their stock at some stage in the future. Shareholders are divided into
two categories. Regular shares owned by entrepreneurs who are entitled to a portion of the firm's
profits earned of rewards, that fluctuate in price depends on the firm's earnings. Shareholders
have right to vote at Yearly and Additional Annual Meetings as shareholders of the firm, but
they are also liable if the business goes bust, thus they are taking a chance with their investments.
Because preference shares are not shareholders in the corporation, they are less risky. Investors
promise a dividend, however it may be lower than what common stockholders get. Preferred
Paraphrase This Document
Need a fresh take? Get an instant paraphrase of this document with our AI Paraphraser
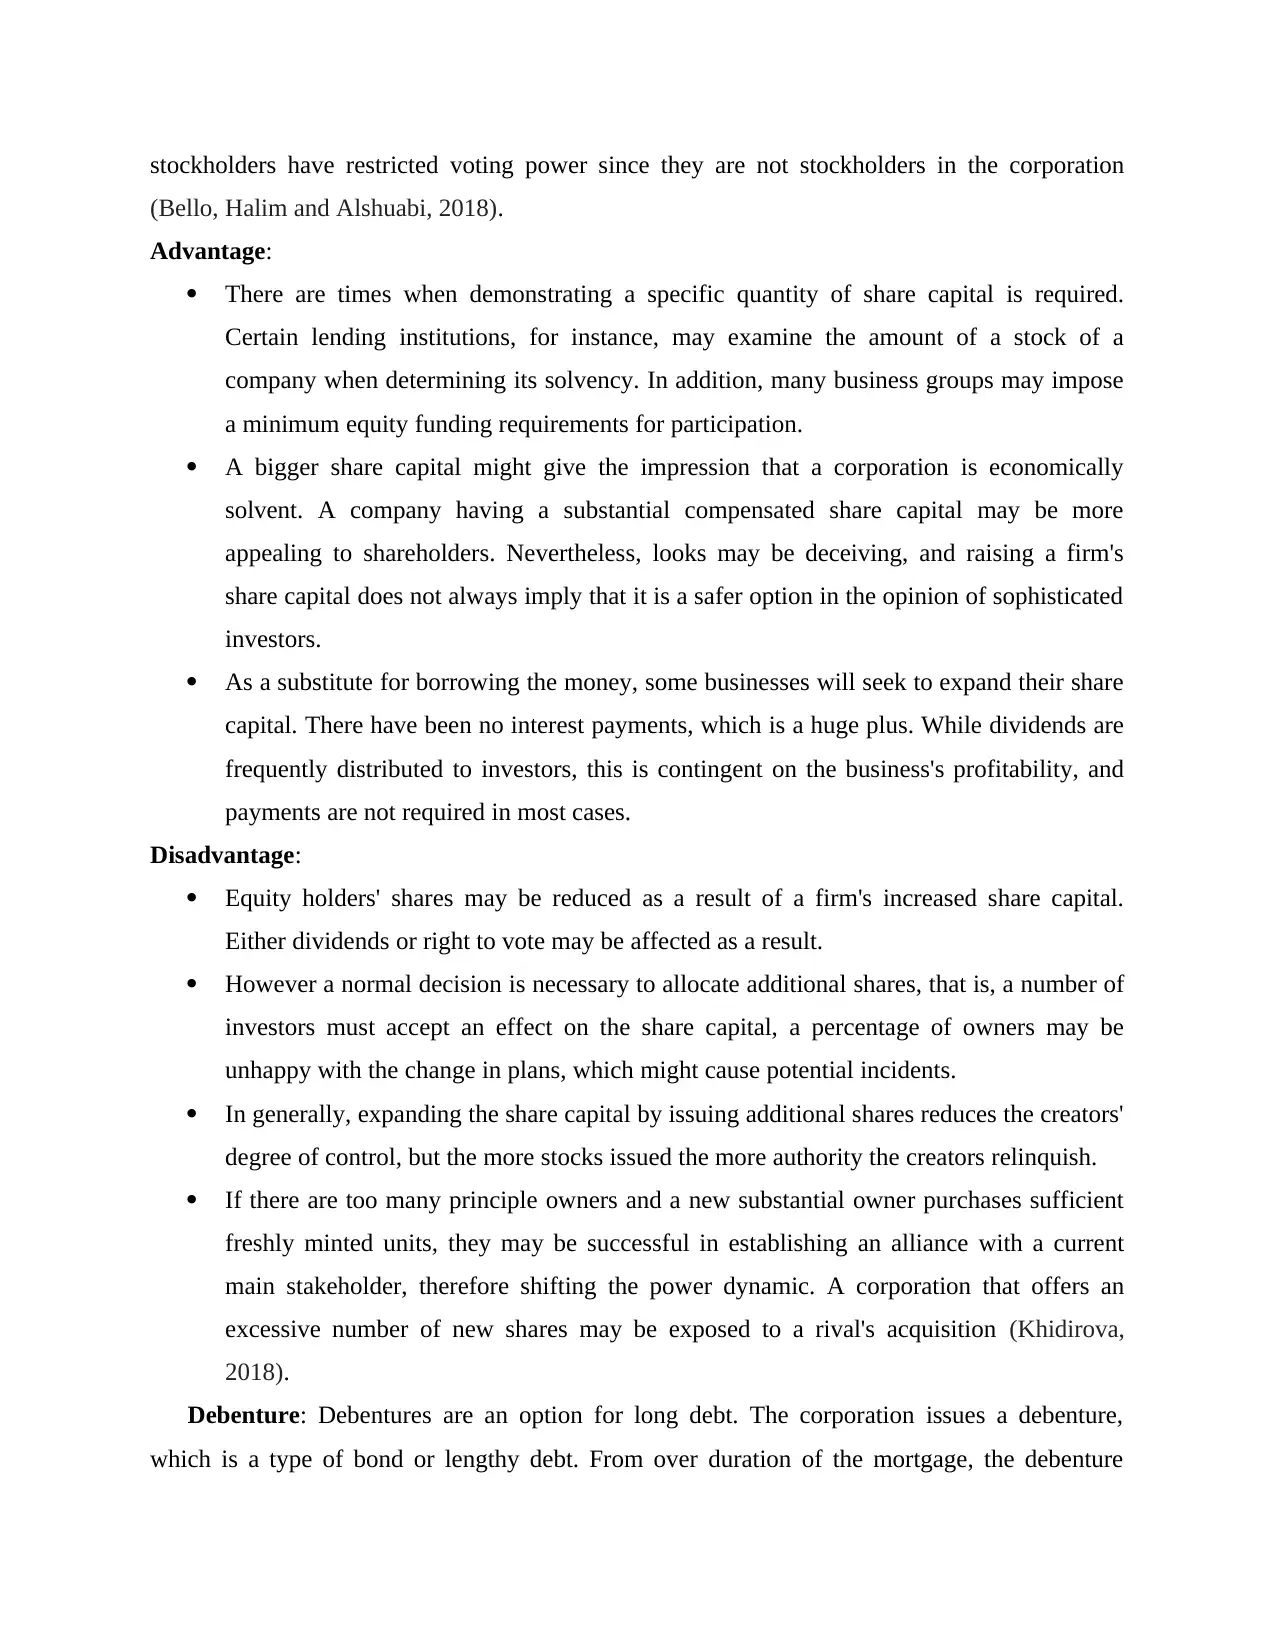
stockholders have restricted voting power since they are not stockholders in the corporation
(Bello, Halim and Alshuabi, 2018).
Advantage:
There are times when demonstrating a specific quantity of share capital is required.
Certain lending institutions, for instance, may examine the amount of a stock of a
company when determining its solvency. In addition, many business groups may impose
a minimum equity funding requirements for participation.
A bigger share capital might give the impression that a corporation is economically
solvent. A company having a substantial compensated share capital may be more
appealing to shareholders. Nevertheless, looks may be deceiving, and raising a firm's
share capital does not always imply that it is a safer option in the opinion of sophisticated
investors.
As a substitute for borrowing the money, some businesses will seek to expand their share
capital. There have been no interest payments, which is a huge plus. While dividends are
frequently distributed to investors, this is contingent on the business's profitability, and
payments are not required in most cases.
Disadvantage:
Equity holders' shares may be reduced as a result of a firm's increased share capital.
Either dividends or right to vote may be affected as a result.
However a normal decision is necessary to allocate additional shares, that is, a number of
investors must accept an effect on the share capital, a percentage of owners may be
unhappy with the change in plans, which might cause potential incidents.
In generally, expanding the share capital by issuing additional shares reduces the creators'
degree of control, but the more stocks issued the more authority the creators relinquish.
If there are too many principle owners and a new substantial owner purchases sufficient
freshly minted units, they may be successful in establishing an alliance with a current
main stakeholder, therefore shifting the power dynamic. A corporation that offers an
excessive number of new shares may be exposed to a rival's acquisition (Khidirova,
2018).
Debenture: Debentures are an option for long debt. The corporation issues a debenture,
which is a type of bond or lengthy debt. From over duration of the mortgage, the debenture
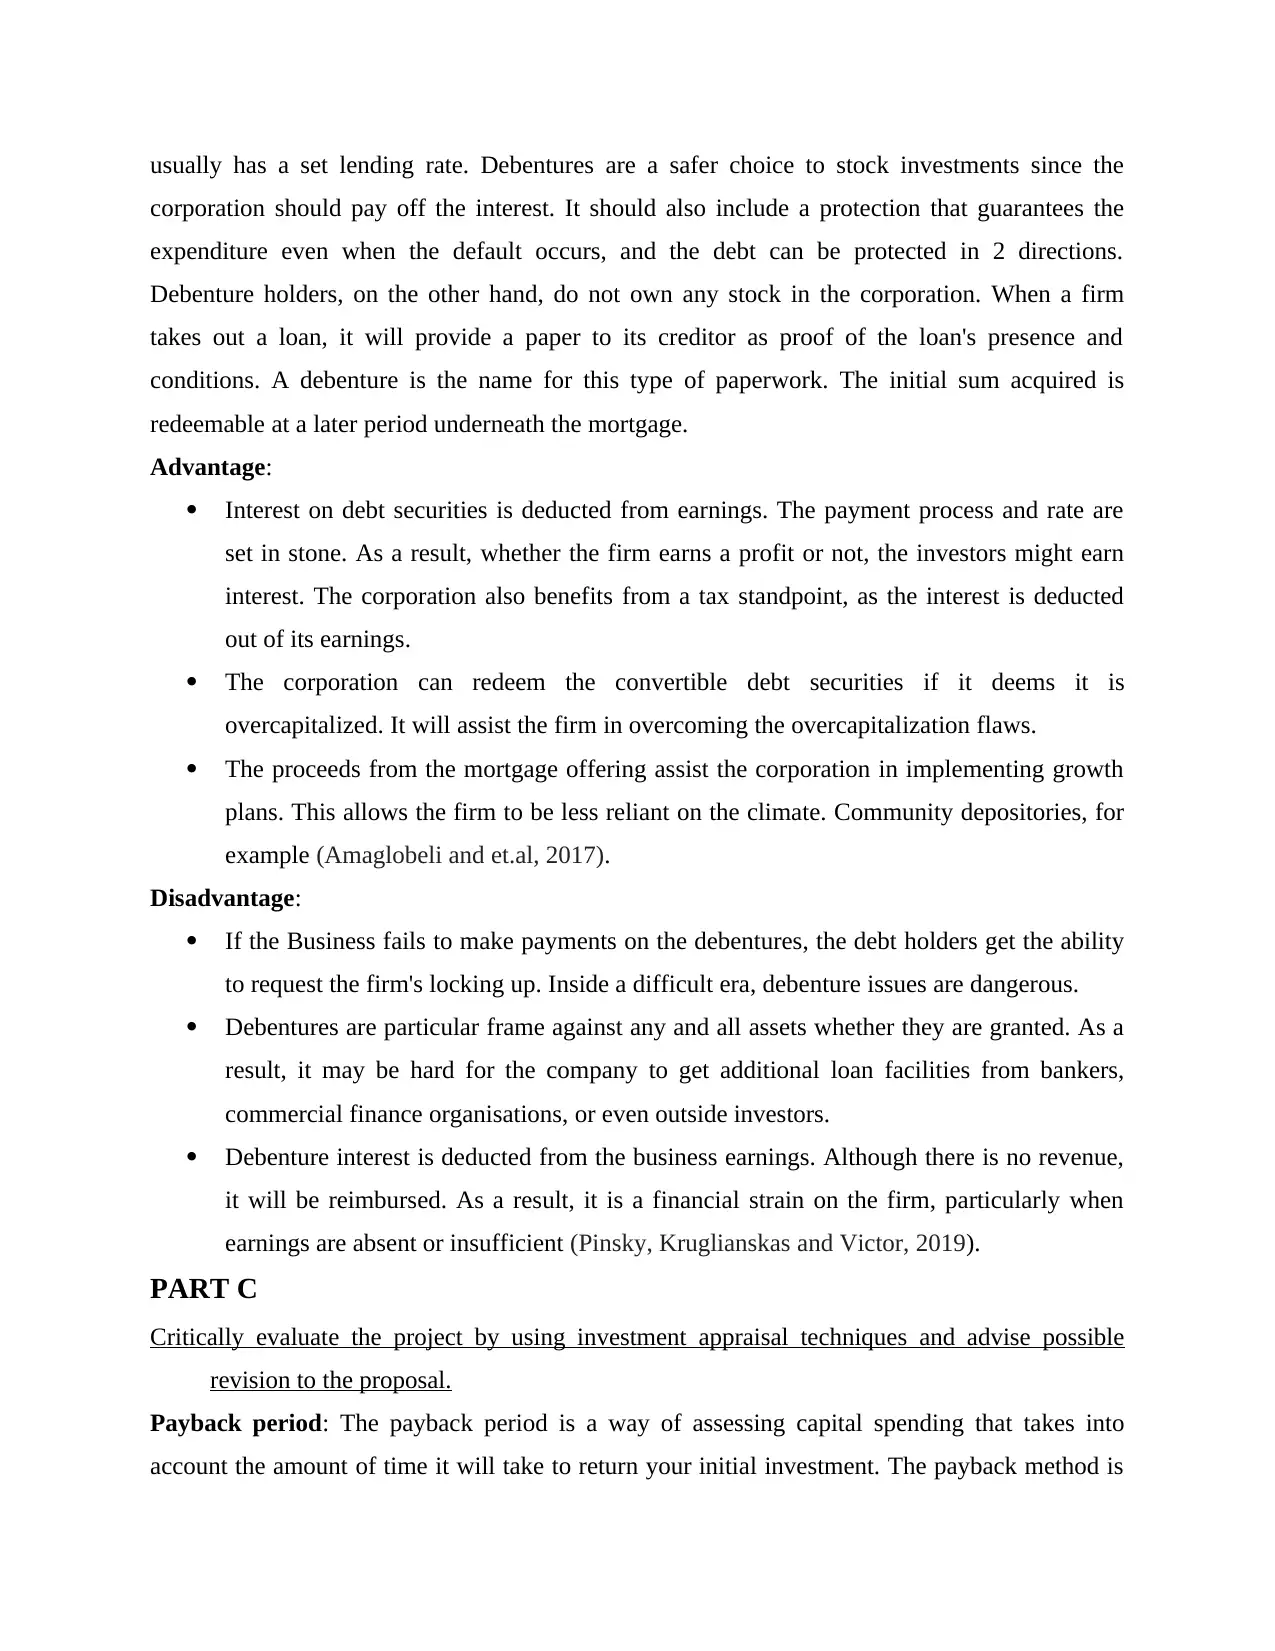
usually has a set lending rate. Debentures are a safer choice to stock investments since the
corporation should pay off the interest. It should also include a protection that guarantees the
expenditure even when the default occurs, and the debt can be protected in 2 directions.
Debenture holders, on the other hand, do not own any stock in the corporation. When a firm
takes out a loan, it will provide a paper to its creditor as proof of the loan's presence and
conditions. A debenture is the name for this type of paperwork. The initial sum acquired is
redeemable at a later period underneath the mortgage.
Advantage:
Interest on debt securities is deducted from earnings. The payment process and rate are
set in stone. As a result, whether the firm earns a profit or not, the investors might earn
interest. The corporation also benefits from a tax standpoint, as the interest is deducted
out of its earnings.
The corporation can redeem the convertible debt securities if it deems it is
overcapitalized. It will assist the firm in overcoming the overcapitalization flaws.
The proceeds from the mortgage offering assist the corporation in implementing growth
plans. This allows the firm to be less reliant on the climate. Community depositories, for
example (Amaglobeli and et.al, 2017).
Disadvantage:
If the Business fails to make payments on the debentures, the debt holders get the ability
to request the firm's locking up. Inside a difficult era, debenture issues are dangerous.
Debentures are particular frame against any and all assets whether they are granted. As a
result, it may be hard for the company to get additional loan facilities from bankers,
commercial finance organisations, or even outside investors.
Debenture interest is deducted from the business earnings. Although there is no revenue,
it will be reimbursed. As a result, it is a financial strain on the firm, particularly when
earnings are absent or insufficient (Pinsky, Kruglianskas and Victor, 2019).
PART C
Critically evaluate the project by using investment appraisal techniques and advise possible
revision to the proposal.
Payback period: The payback period is a way of assessing capital spending that takes into
account the amount of time it will take to return your initial investment. The payback method is
⊘ This is a preview!⊘
Do you want full access?
Subscribe today to unlock all pages.
Trusted by 1+ million students worldwide
1 out of 19
Related Documents


Your All-in-One AI-Powered Toolkit for Academic Success.
+13062052269
info@desklib.com
Available 24*7 on WhatsApp / Email
![[object Object]](/_next/static/media/star-bottom.7253800d.svg)
Unlock your academic potential
Copyright © 2020–2026 A2Z Services. All Rights Reserved. Developed and managed by ZUCOL.