Comparative Analysis: Business Performance of R plc vs. S plc
VerifiedAdded on 2023/06/16
|6
|1320
|212
Report
AI Summary
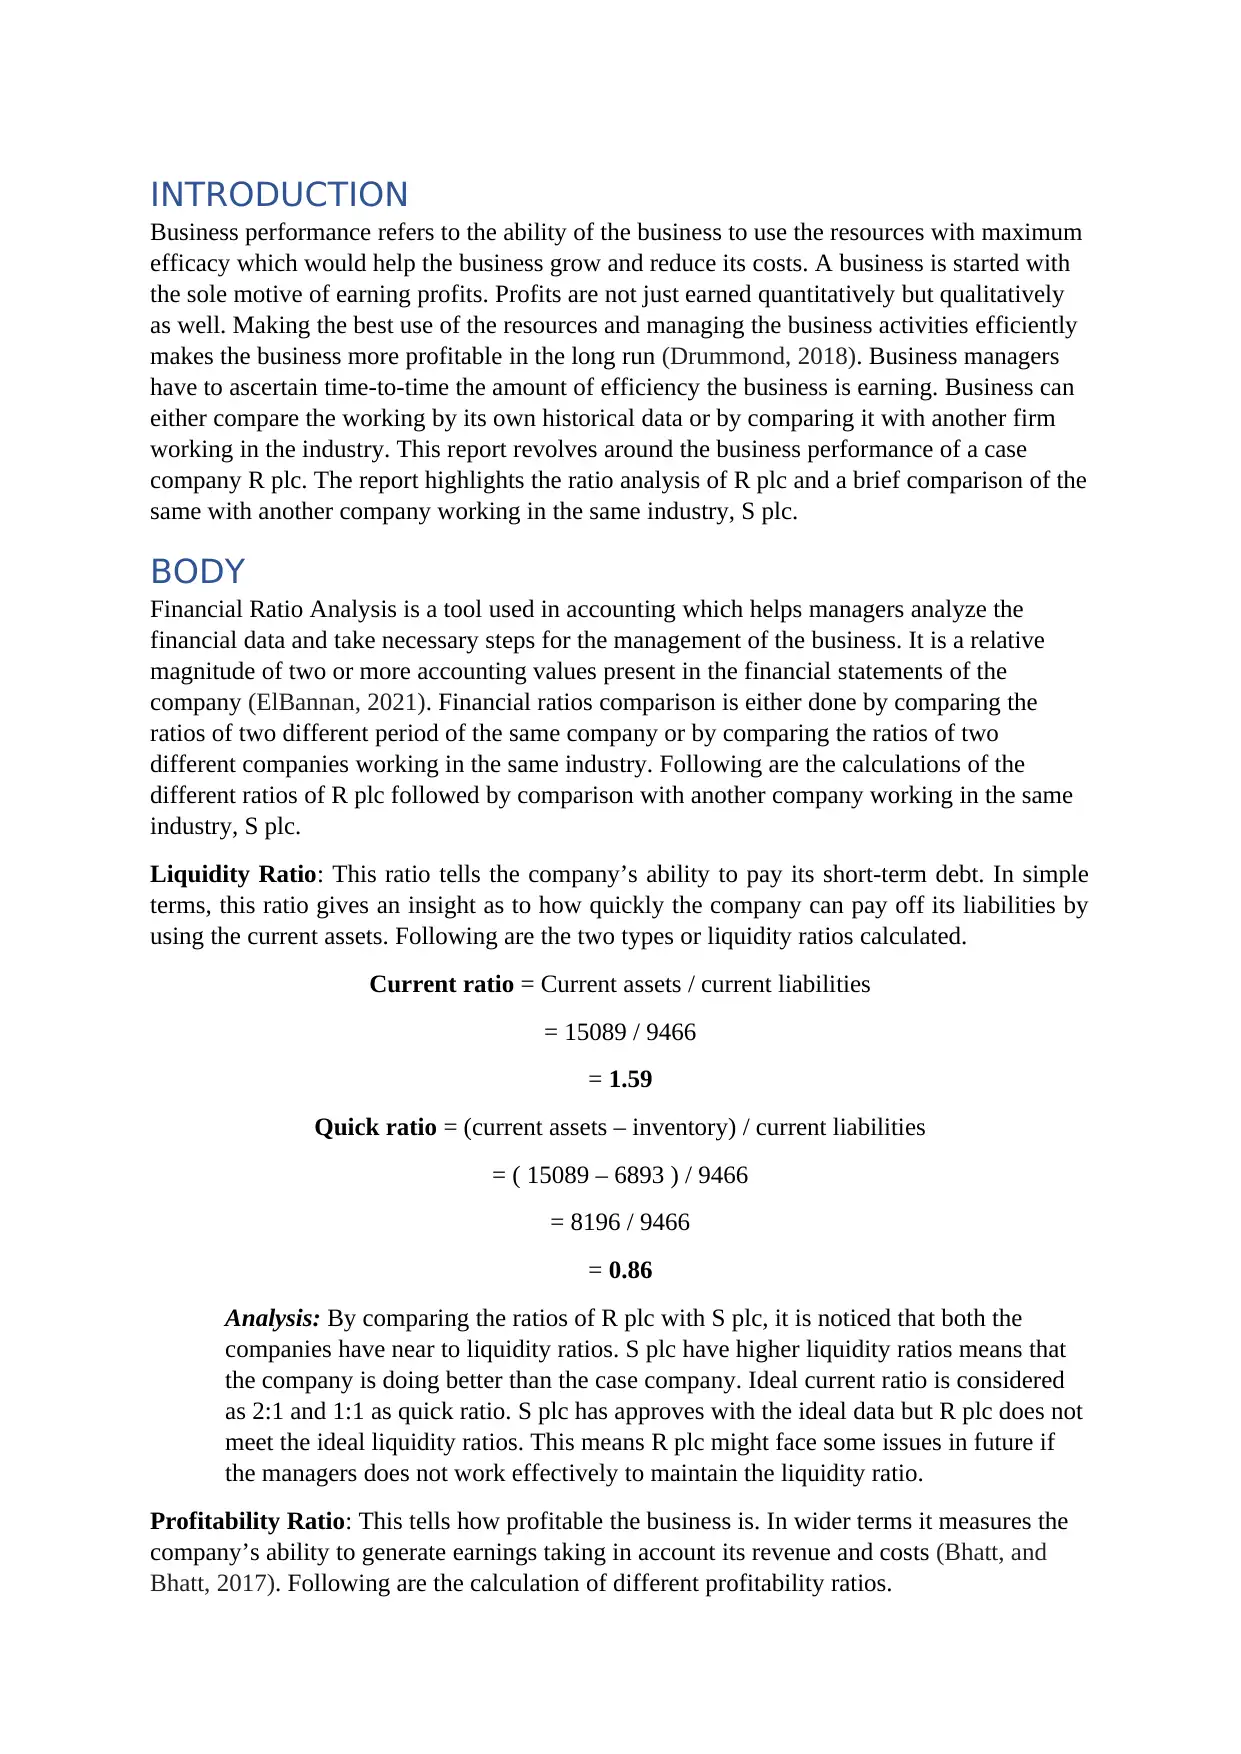
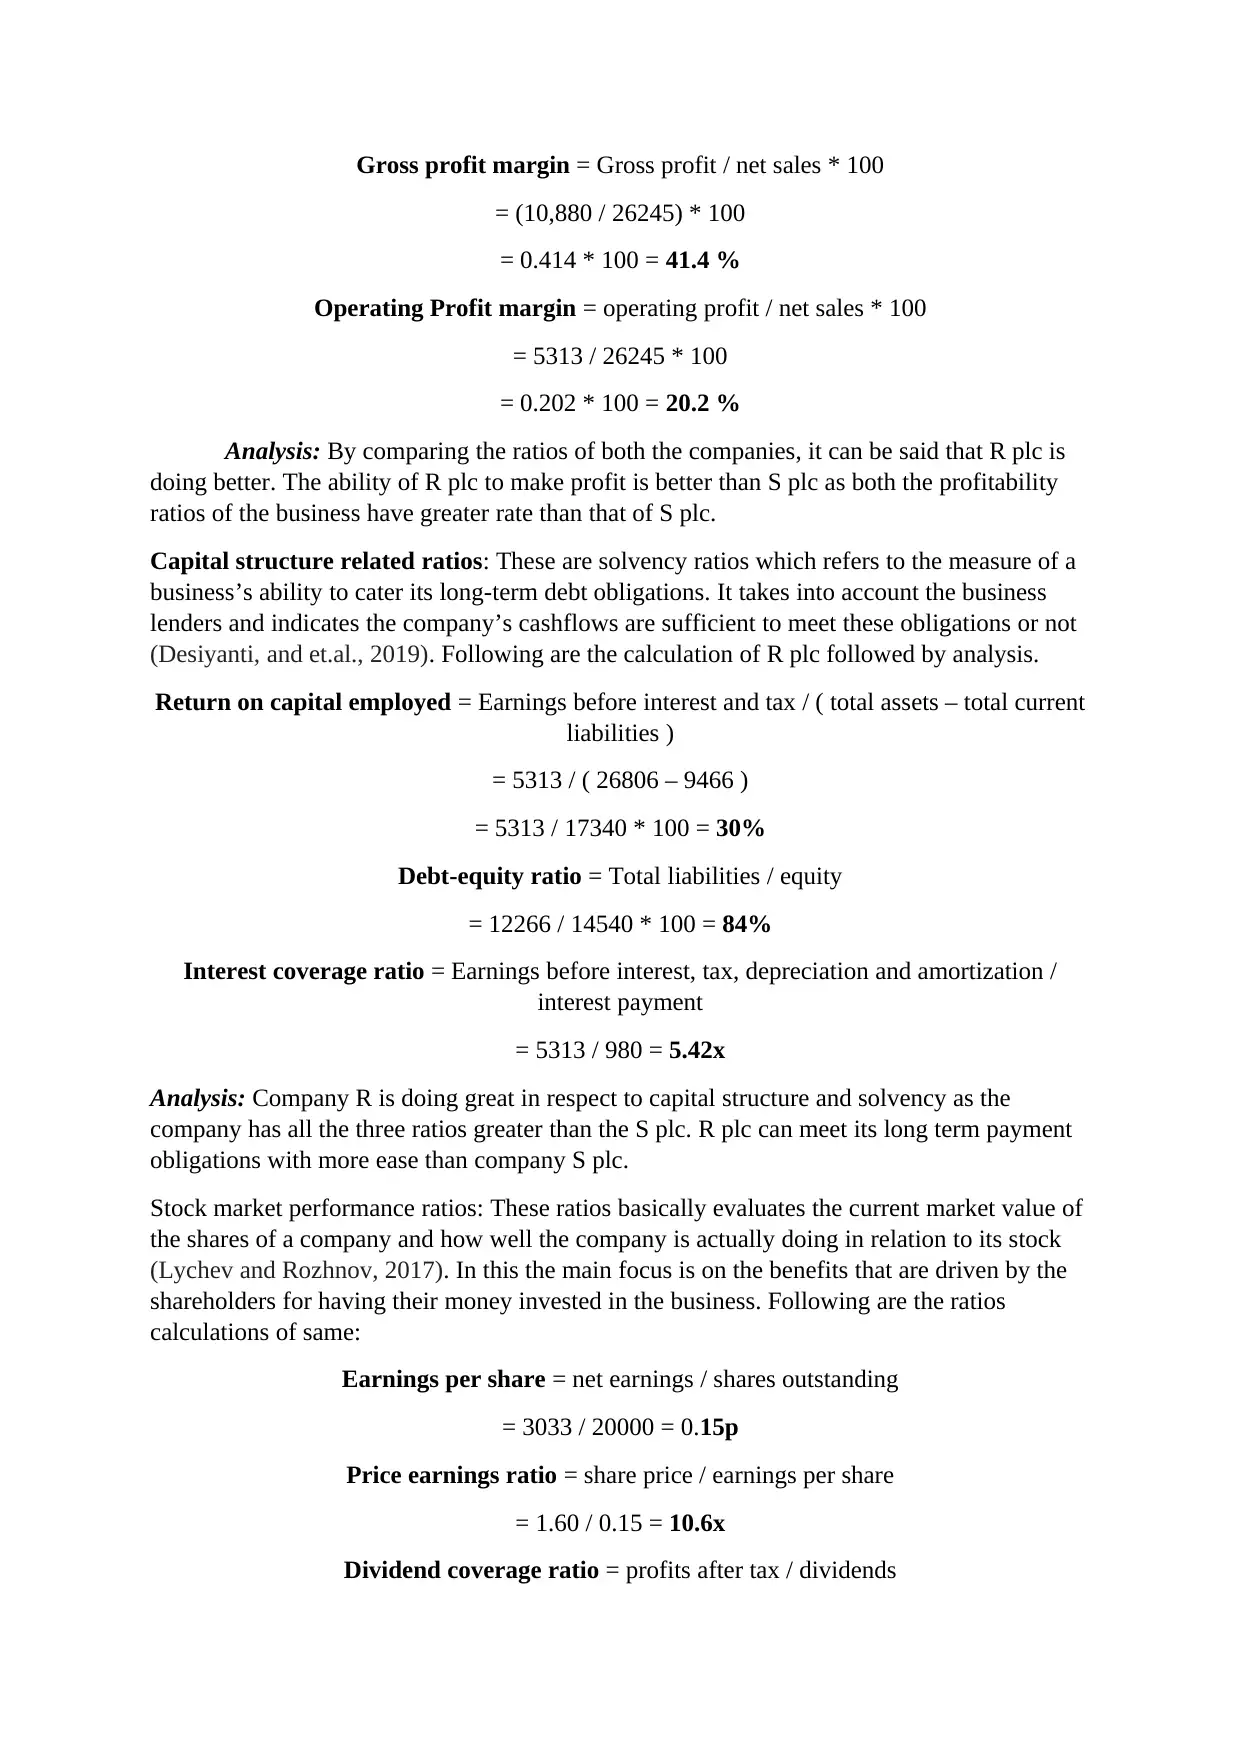
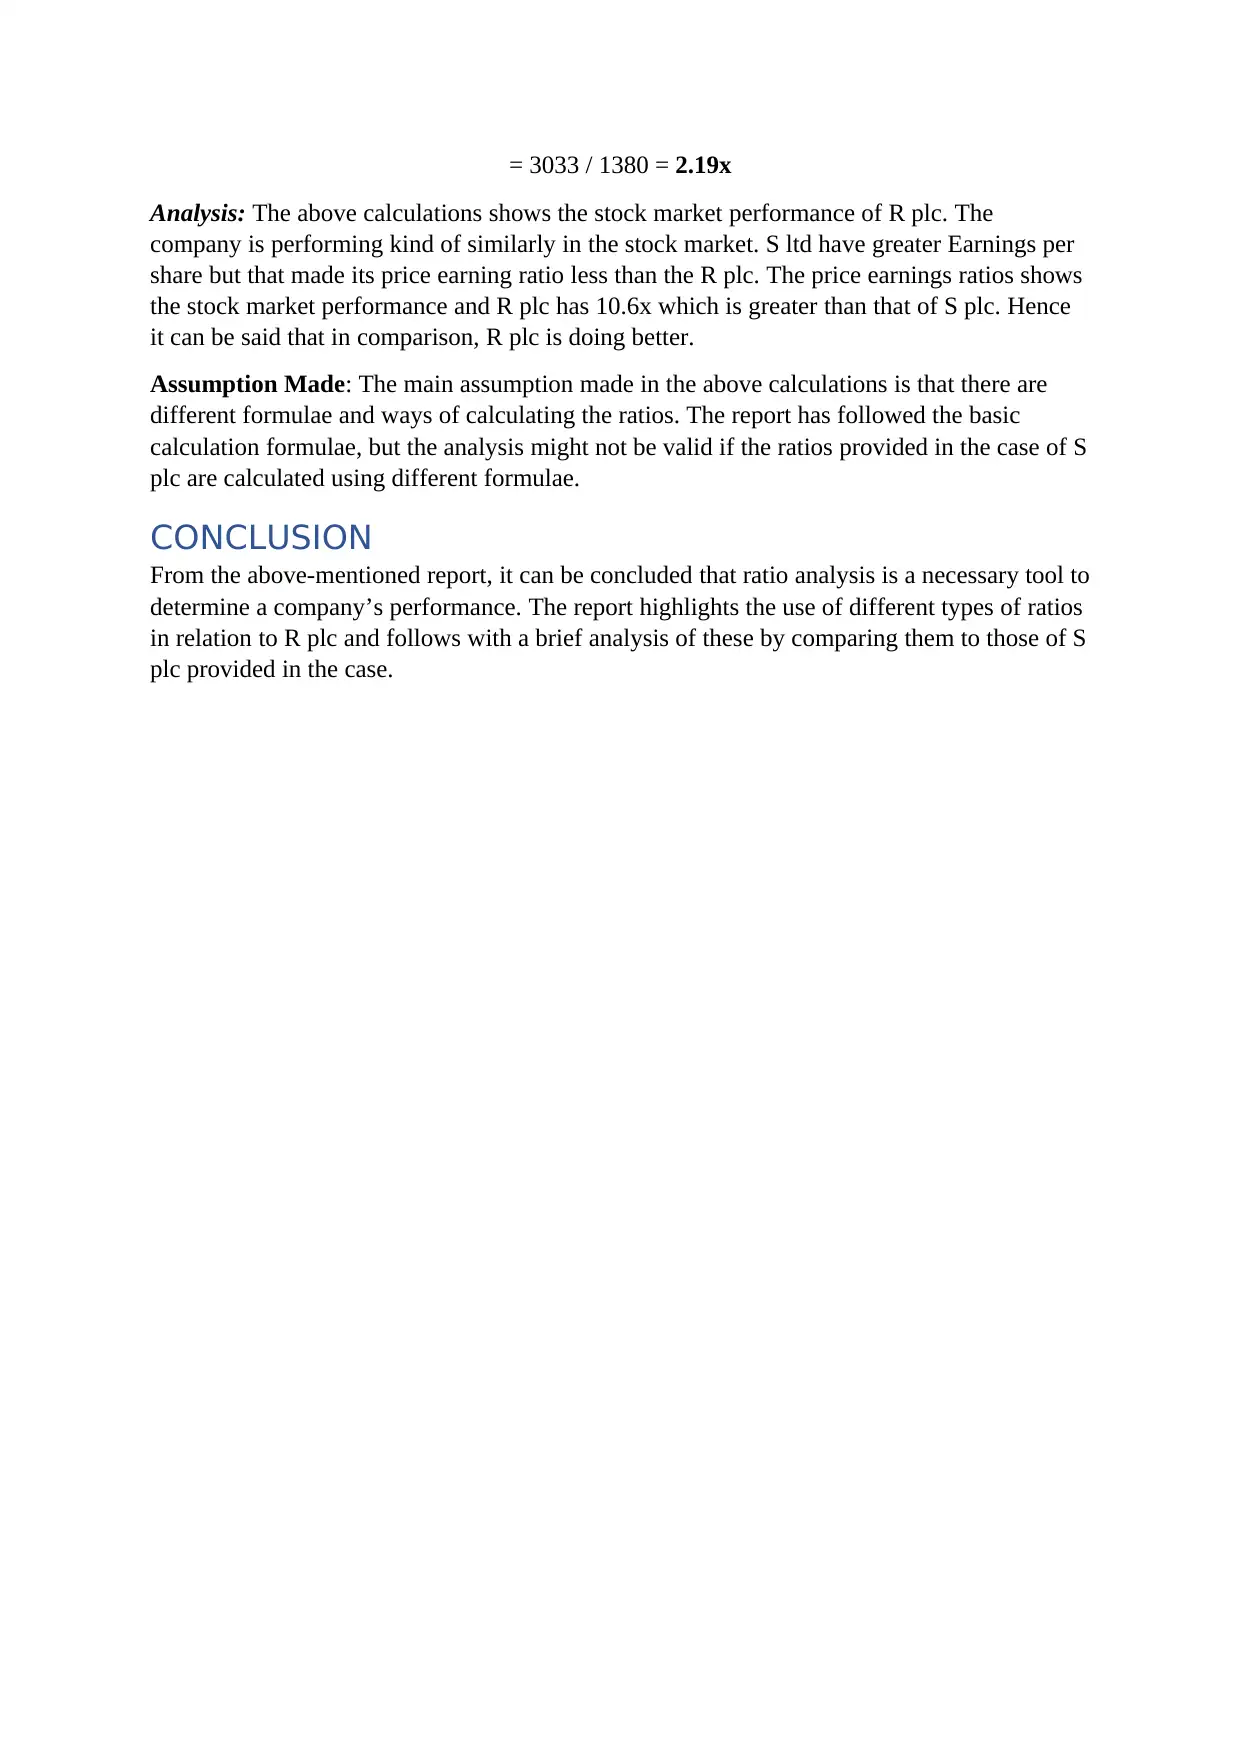
This report assesses the business performance of R plc through financial ratio analysis, comparing it with S plc in the same industry. It covers liquidity ratios (current and quick), profitability ratios (gross and operating profit margins), capital structure ratios (return on capital employed, debt-equity ratio, and interest coverage ratio), and stock market performance ratios (earnings per share, price earnings ratio, and dividend coverage ratio). The analysis reveals that while S plc has better liquidity ratios, R plc demonstrates superior profitability and capital structure. In stock market performance, R plc also outperforms S plc based on the price earnings ratio. The report concludes that ratio analysis is crucial for evaluating a company's performance and highlights the comparative strengths and weaknesses of R plc relative to S plc. Desklib offers more solved assignments and resources for students.

1 out of 6
Related Documents


Your All-in-One AI-Powered Toolkit for Academic Success.
+13062052269
info@desklib.com
Available 24*7 on WhatsApp / Email
![[object Object]](/_next/static/media/star-bottom.7253800d.svg)
Copyright © 2020–2026 A2Z Services. All Rights Reserved. Developed and managed by ZUCOL.