Comprehensive Ratio Analysis Report: Severn Trent Plc Financial Review

Verified

Added on  2021/05/30

|15
|1556
|512
Report
AI Summary
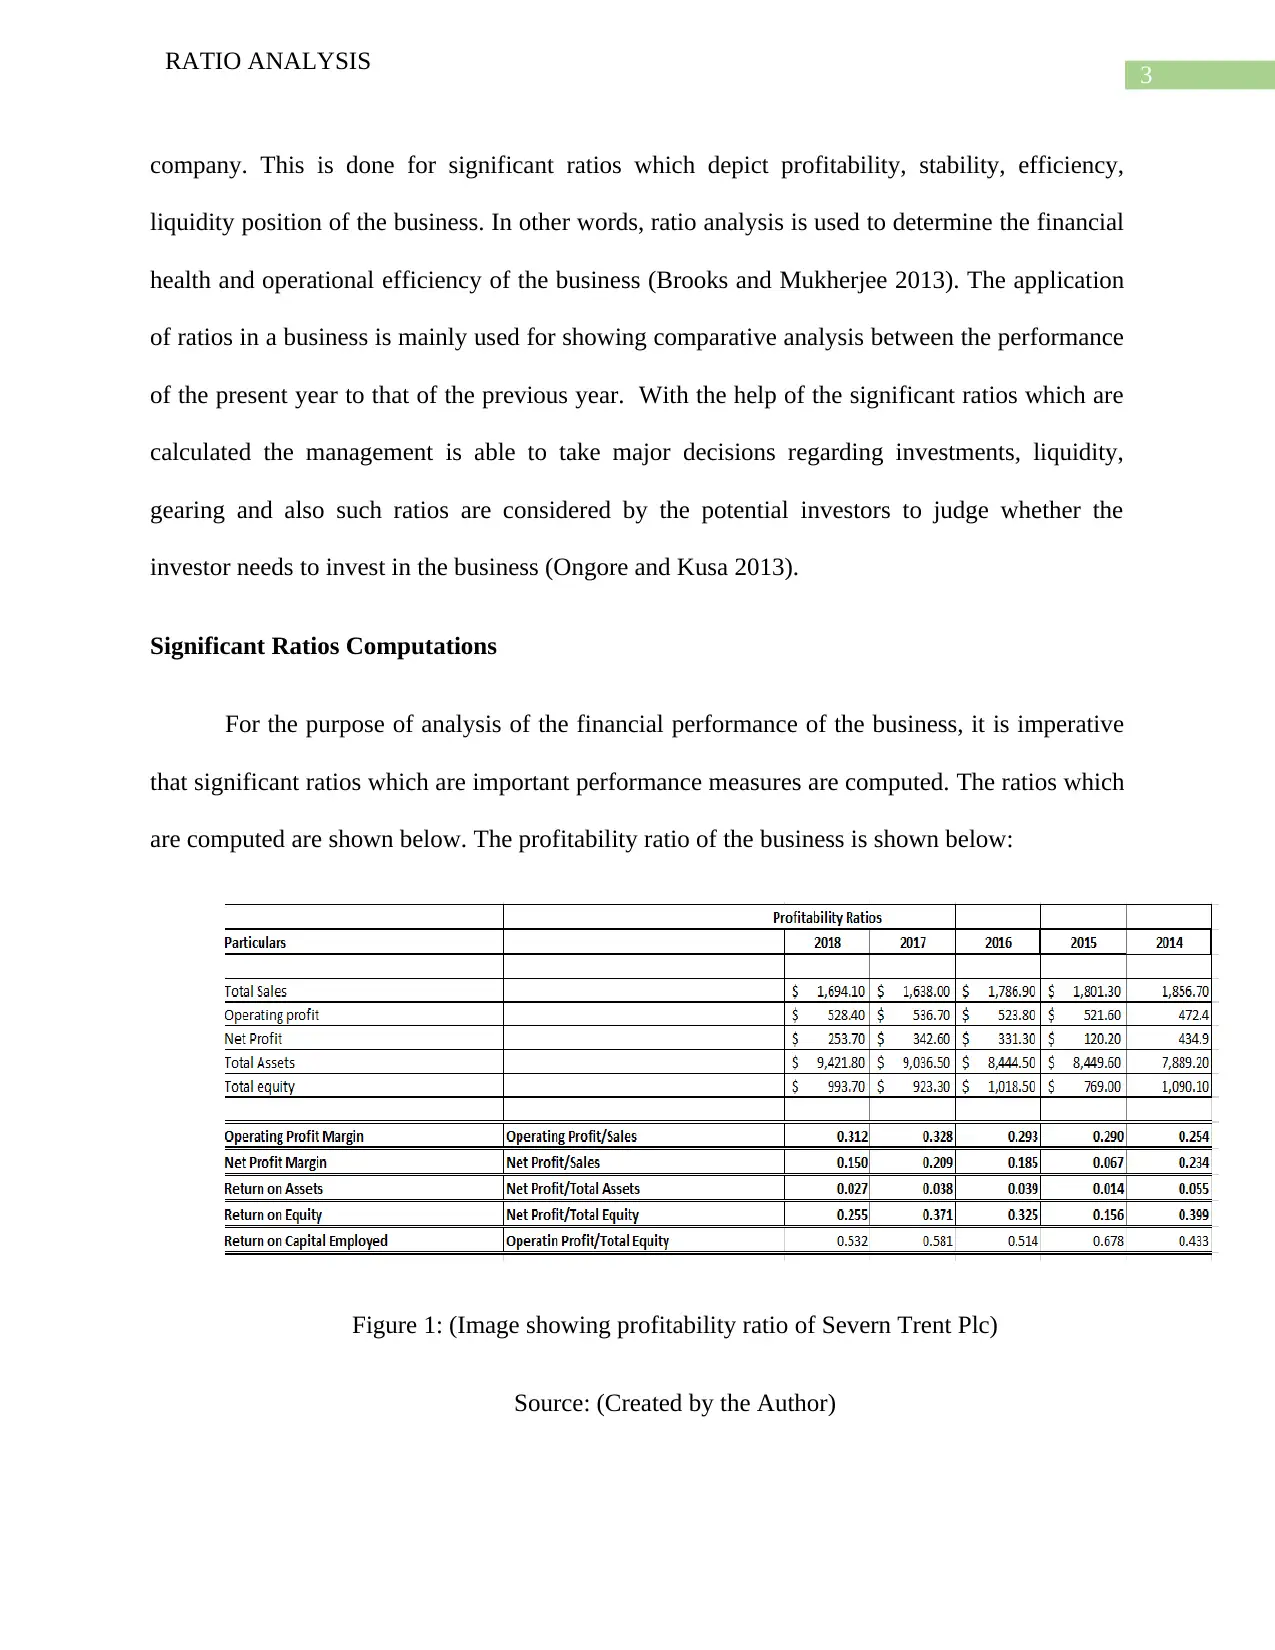
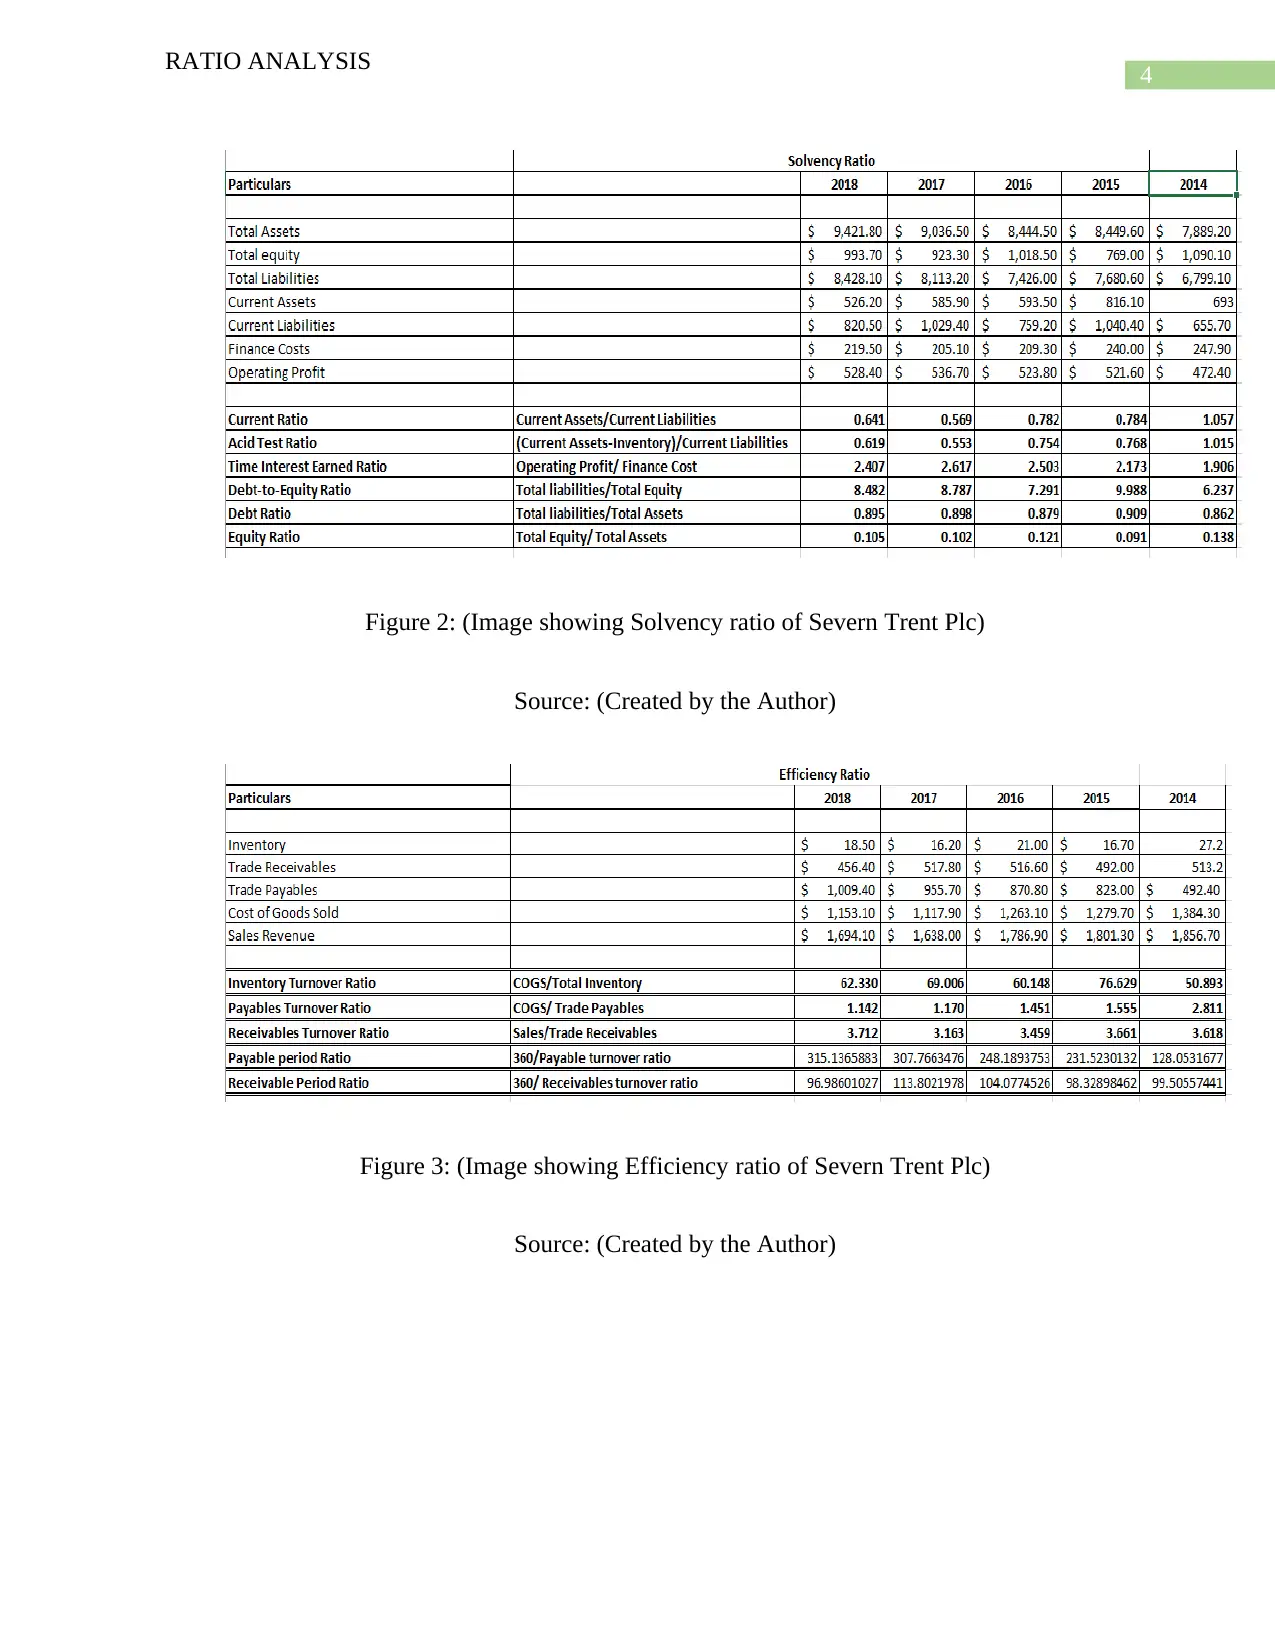
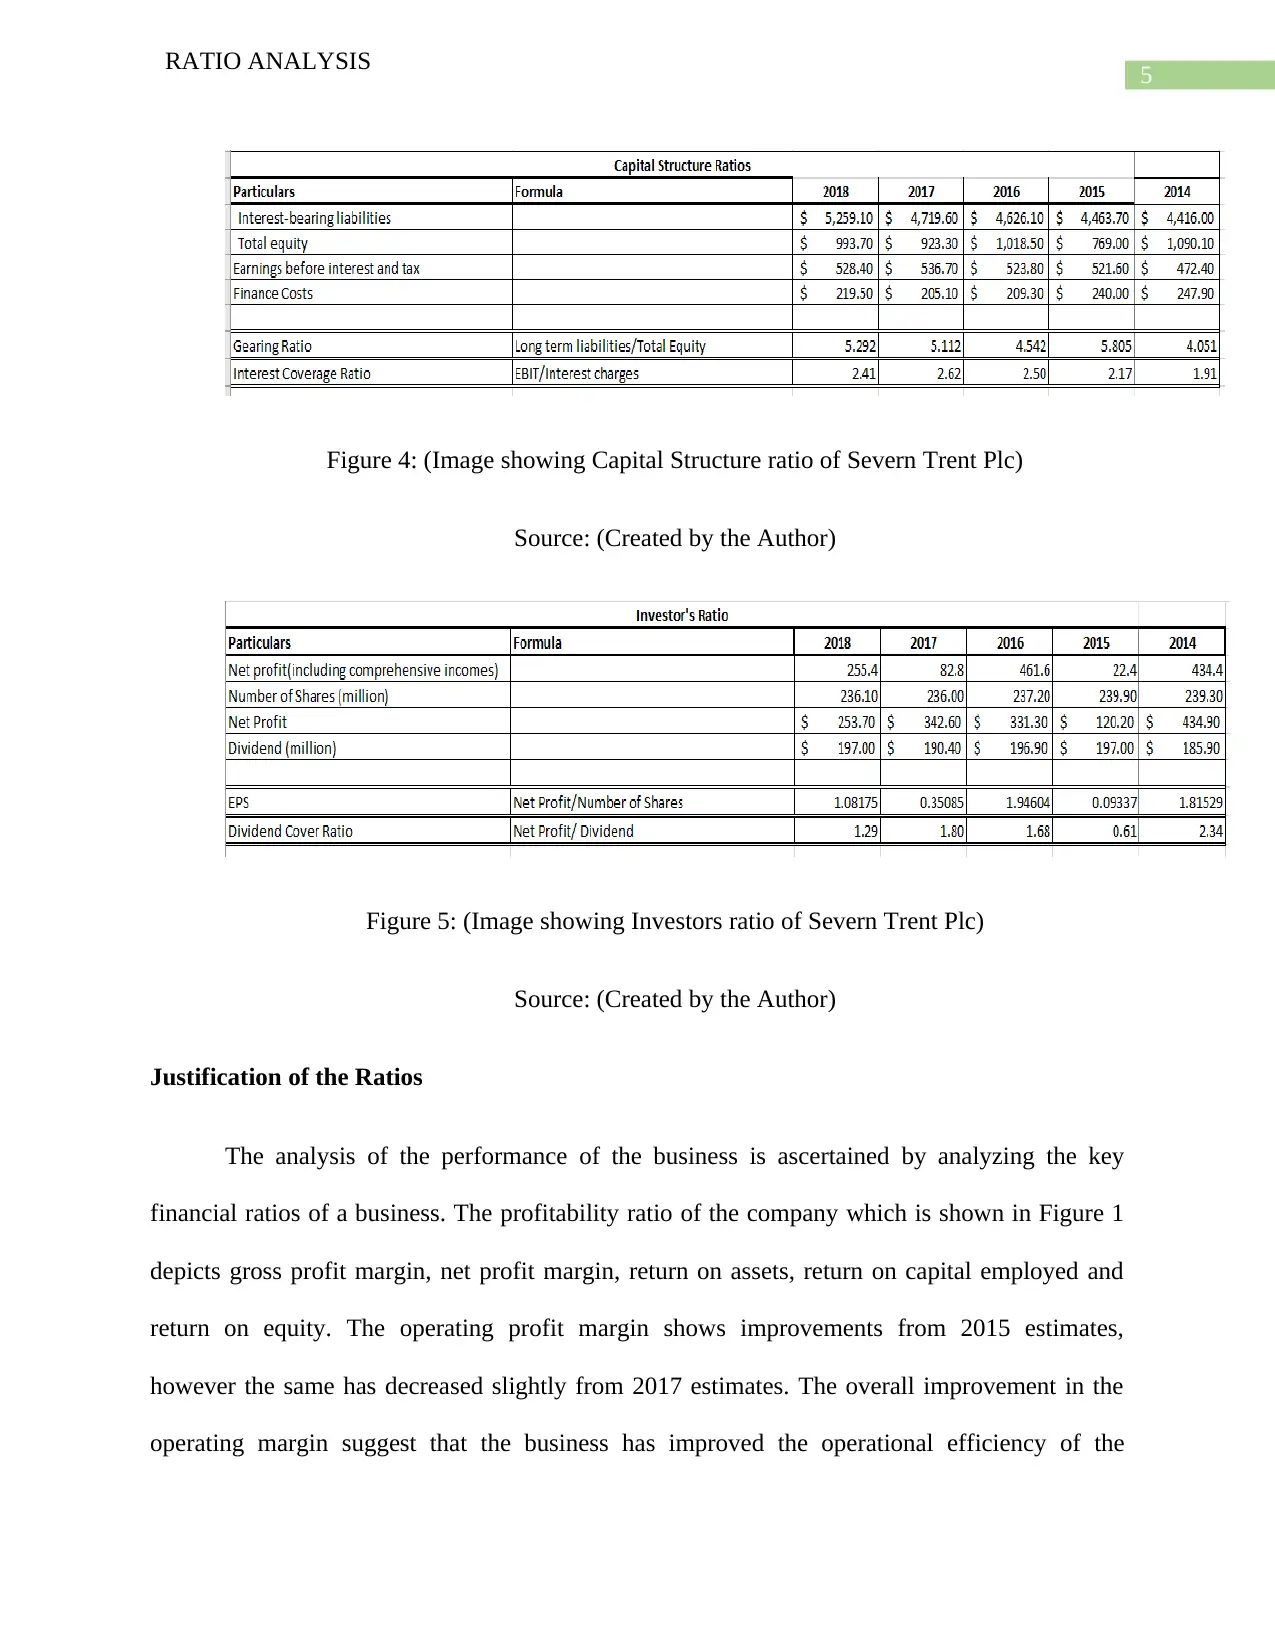
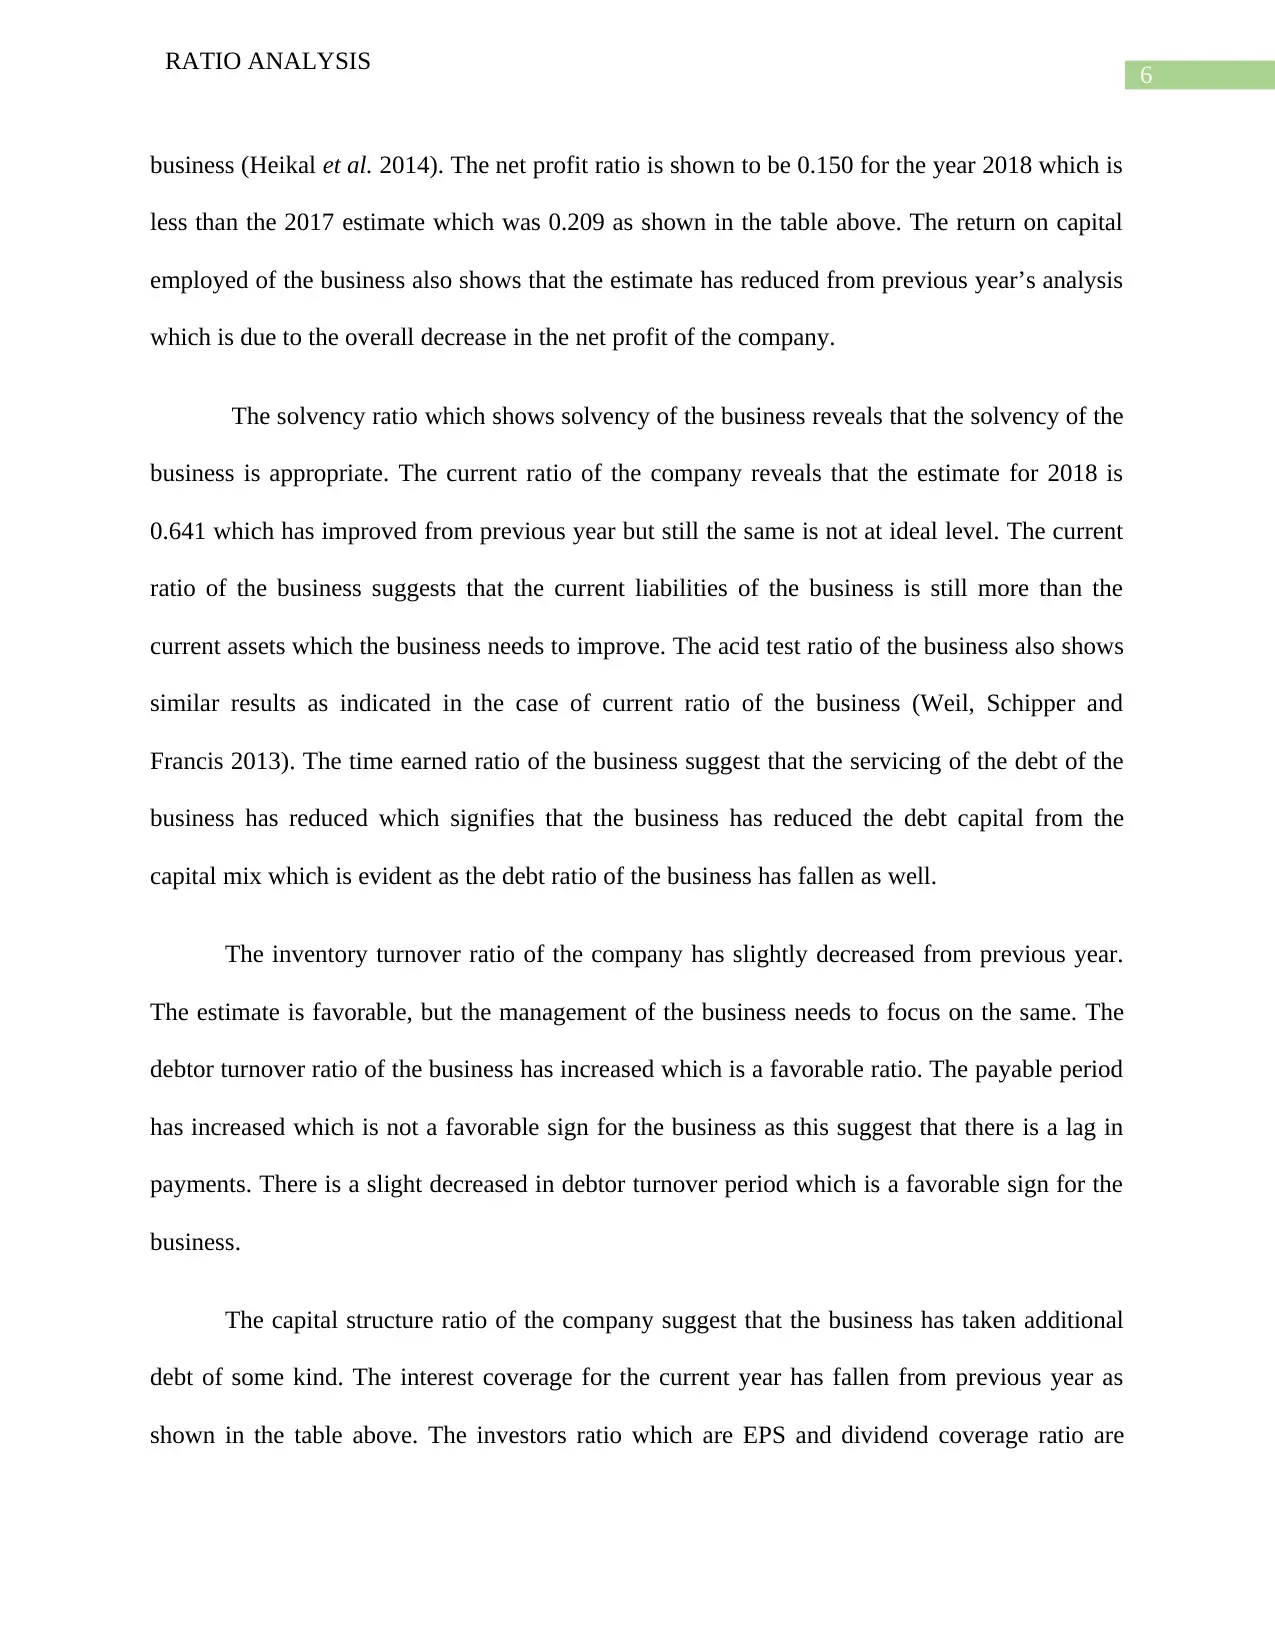
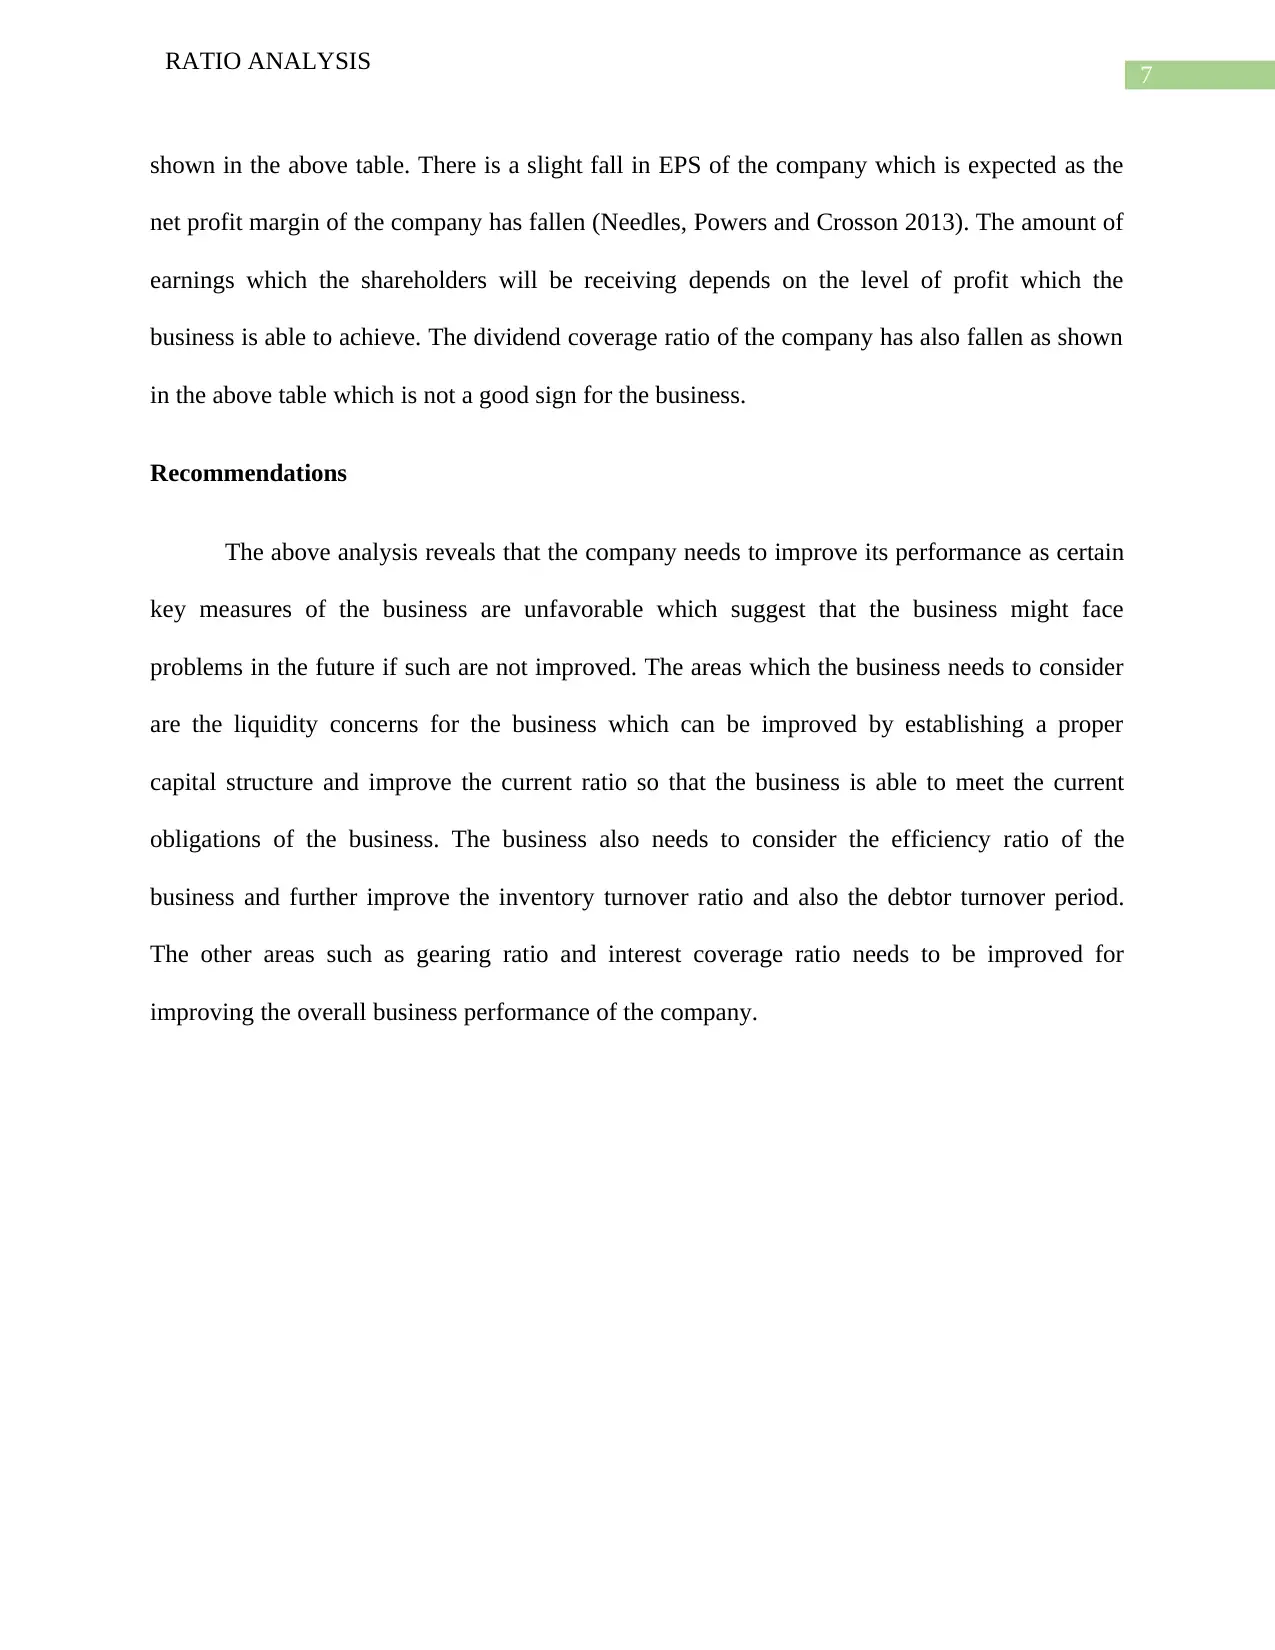
This report provides a comprehensive ratio analysis of Severn Trent Plc's financial performance, based on its annual reports from 2015 to 2018. The analysis includes the computation and justification of various financial ratios, categorized into profitability, solvency, efficiency, capital structure, and investor's perspective. The report examines key performance indicators such as gross profit margin, net profit margin, return on assets, current ratio, debt ratio, inventory turnover, and earnings per share. It compares the company's performance across the years, highlighting trends and identifying areas of improvement. The report concludes with recommendations for Severn Trent, focusing on enhancing liquidity, improving efficiency ratios, and optimizing capital structure to improve overall financial health. The report uses figures and tables to illustrate the financial data and ratio calculations.
tabler-icon-diamond-filled.svg

Contribute Materials

Your contribution can guide someone’s learning journey. Share your documents today.
Document Page
Running head: RATIO ANALYSIS
Ratio Analysis
Name of the Student:
Name of the University:
Author’s Note
tabler-icon-diamond-filled.svg

Secure Best Marks with AI Grader

Need help grading? Try our AI Grader for instant feedback on your assignments.
Document Page
1
RATIO ANALYSIS
Table of Contents
Assessment B...................................................................................................................................2
Introduction..................................................................................................................................2
Overview of the Company...........................................................................................................2
Ratio Analysis and Uses..............................................................................................................2
Significant Ratios Computations.................................................................................................3
Justification of the Ratios............................................................................................................5
Recommendations........................................................................................................................7
Reference.........................................................................................................................................8
Appendix..........................................................................................................................................9
Document Page
2
RATIO ANALYSIS
Assessment B
Introduction
The main purpose of this assessment is to analyze the financial performance of a
company. The company which is selected for this assessment is Severn Trent Company. The
financial performance of the company is to be analyzed on the basis of the annual reports of the
company for the year 2018. This assessment will be considering annual reports of past fours
years for the purpose of calculating significant ratios which are also financial indicators of the
overall success of the business (Delen, Kuzey and Uyar 2013). The ratios which are to be
calculated are profitability, solvency, efficiency, capital structure and investor’s perspective
ratios. The assessment will be considering the ratio which will depicting the performance of the
business and the same will be compared with previous year’s assessment.
Overview of the Company
Severn Trent Plc is a water company which operates in United Kingdom and the same is listed in
London Stock Exchange. The company approximately employs around 15000 employees across
United Kingdom. The company has various subsidiaries and various of the subsidiaries are
engaged in supplying water to about 4.5 million houses in the area of its operations
(Severntrent.com. 2018). The business is regarding as a leading supplier of water supply in the
country.
Ratio Analysis and Uses
Ratio Analysis is a quantitative analysis technique which is uses to analyze the financial
performance of the business. The application of ratios is evident in the annual report of the
Document Page
3
RATIO ANALYSIS
company. This is done for significant ratios which depict profitability, stability, efficiency,
liquidity position of the business. In other words, ratio analysis is used to determine the financial
health and operational efficiency of the business (Brooks and Mukherjee 2013). The application
of ratios in a business is mainly used for showing comparative analysis between the performance
of the present year to that of the previous year. With the help of the significant ratios which are
calculated the management is able to take major decisions regarding investments, liquidity,
gearing and also such ratios are considered by the potential investors to judge whether the
investor needs to invest in the business (Ongore and Kusa 2013).
Significant Ratios Computations
For the purpose of analysis of the financial performance of the business, it is imperative
that significant ratios which are important performance measures are computed. The ratios which
are computed are shown below. The profitability ratio of the business is shown below:
Figure 1: (Image showing profitability ratio of Severn Trent Plc)
Source: (Created by the Author)
tabler-icon-diamond-filled.svg

Secure Best Marks with AI Grader

Need help grading? Try our AI Grader for instant feedback on your assignments.
Document Page
4
RATIO ANALYSIS
Figure 2: (Image showing Solvency ratio of Severn Trent Plc)
Source: (Created by the Author)
Figure 3: (Image showing Efficiency ratio of Severn Trent Plc)
Source: (Created by the Author)
Document Page
5
RATIO ANALYSIS
Figure 4: (Image showing Capital Structure ratio of Severn Trent Plc)
Source: (Created by the Author)
Figure 5: (Image showing Investors ratio of Severn Trent Plc)
Source: (Created by the Author)
Justification of the Ratios
The analysis of the performance of the business is ascertained by analyzing the key
financial ratios of a business. The profitability ratio of the company which is shown in Figure 1
depicts gross profit margin, net profit margin, return on assets, return on capital employed and
return on equity. The operating profit margin shows improvements from 2015 estimates,
however the same has decreased slightly from 2017 estimates. The overall improvement in the
operating margin suggest that the business has improved the operational efficiency of the
Document Page
6
RATIO ANALYSIS
business (Heikal et al. 2014). The net profit ratio is shown to be 0.150 for the year 2018 which is
less than the 2017 estimate which was 0.209 as shown in the table above. The return on capital
employed of the business also shows that the estimate has reduced from previous year’s analysis
which is due to the overall decrease in the net profit of the company.
The solvency ratio which shows solvency of the business reveals that the solvency of the
business is appropriate. The current ratio of the company reveals that the estimate for 2018 is
0.641 which has improved from previous year but still the same is not at ideal level. The current
ratio of the business suggests that the current liabilities of the business is still more than the
current assets which the business needs to improve. The acid test ratio of the business also shows
similar results as indicated in the case of current ratio of the business (Weil, Schipper and
Francis 2013). The time earned ratio of the business suggest that the servicing of the debt of the
business has reduced which signifies that the business has reduced the debt capital from the
capital mix which is evident as the debt ratio of the business has fallen as well.
The inventory turnover ratio of the company has slightly decreased from previous year.
The estimate is favorable, but the management of the business needs to focus on the same. The
debtor turnover ratio of the business has increased which is a favorable ratio. The payable period
has increased which is not a favorable sign for the business as this suggest that there is a lag in
payments. There is a slight decreased in debtor turnover period which is a favorable sign for the
business.
The capital structure ratio of the company suggest that the business has taken additional
debt of some kind. The interest coverage for the current year has fallen from previous year as
shown in the table above. The investors ratio which are EPS and dividend coverage ratio are
tabler-icon-diamond-filled.svg

Paraphrase This Document

Need a fresh take? Get an instant paraphrase of this document with our AI Paraphraser
Document Page
7
RATIO ANALYSIS
shown in the above table. There is a slight fall in EPS of the company which is expected as the
net profit margin of the company has fallen (Needles, Powers and Crosson 2013). The amount of
earnings which the shareholders will be receiving depends on the level of profit which the
business is able to achieve. The dividend coverage ratio of the company has also fallen as shown
in the above table which is not a good sign for the business.
Recommendations
The above analysis reveals that the company needs to improve its performance as certain
key measures of the business are unfavorable which suggest that the business might face
problems in the future if such are not improved. The areas which the business needs to consider
are the liquidity concerns for the business which can be improved by establishing a proper
capital structure and improve the current ratio so that the business is able to meet the current
obligations of the business. The business also needs to consider the efficiency ratio of the
business and further improve the inventory turnover ratio and also the debtor turnover period.
The other areas such as gearing ratio and interest coverage ratio needs to be improved for
improving the overall business performance of the company.
Document Page
8
RATIO ANALYSIS
Reference
Brooks, R. and Mukherjee, A.K., 2013. Financial management: core concepts. Pearson.
Delen, D., Kuzey, C. and Uyar, A., 2013. Measuring firm performance using financial ratios: A
decision tree approach. Expert Systems with Applications, 40(10), pp.3970-3983.
Heikal, M., Khaddafi, M. and Ummah, A., 2014. Influence analysis of return on assets (ROA),
return on equity (ROE), net profit margin (NPM), debt to equity ratio (DER), and current ratio
(CR), against corporate profit growth in automotive in Indonesia Stock Exchange. International
Journal of Academic Research in Business and Social Sciences, 4(12), p.101.
Needles, B.E., Powers, M. and Crosson, S.V., 2013. Financial and managerial accounting.
Cengage Learning.
Ongore, V.O. and Kusa, G.B., 2013. Determinants of financial performance of commercial banks
in Kenya. International Journal of Economics and Financial Issues, 3(1), pp.237-252.
Severntrent.com. (2018). Overview | Investors | Severn Trent Plc. [online] Available at:
https://www.severntrent.com/investors/overview/ [Accessed 14 Jul. 2018].
Weil, R.L., Schipper, K. and Francis, J., 2013. Financial accounting: an introduction to
concepts, methods and uses. Cengage Learning.
Document Page
9
RATIO ANALYSIS
Appendix
tabler-icon-diamond-filled.svg

Secure Best Marks with AI Grader

Need help grading? Try our AI Grader for instant feedback on your assignments.
Document Page
10
RATIO ANALYSIS
Document Page
11
RATIO ANALYSIS
Document Page
12
RATIO ANALYSIS
tabler-icon-diamond-filled.svg

Paraphrase This Document

Need a fresh take? Get an instant paraphrase of this document with our AI Paraphraser
Document Page
13
RATIO ANALYSIS
Document Page
14
RATIO ANALYSIS
chevron_up_icon
1 out of 15
circle_padding
hide_on_mobile
zoom_out_icon
logo.png

Your All-in-One AI-Powered Toolkit for Academic Success.

Available 24*7 on WhatsApp / Email

[object Object]