Financial Health Report: Tech Solutions Ratio Analysis and Review
VerifiedAdded on 2023/01/04
|5
|1138
|61
Report
AI Summary
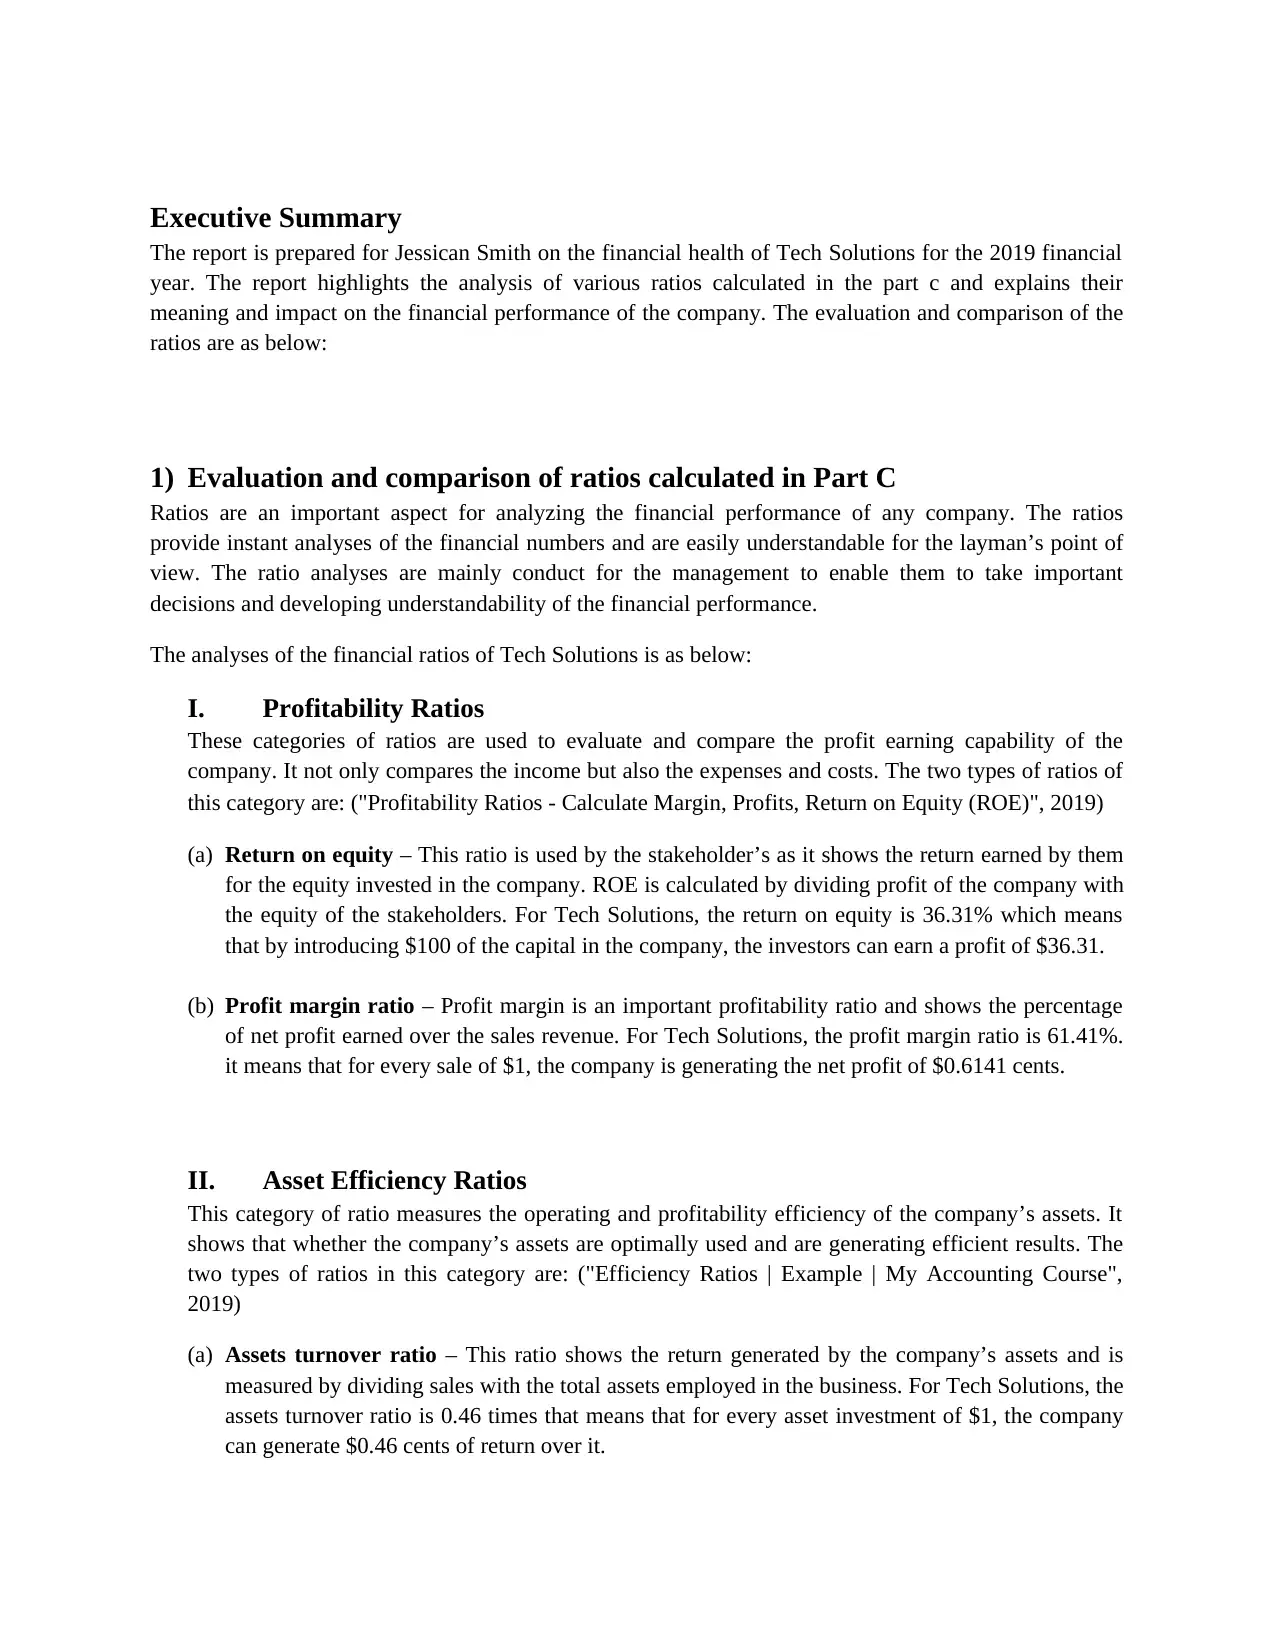
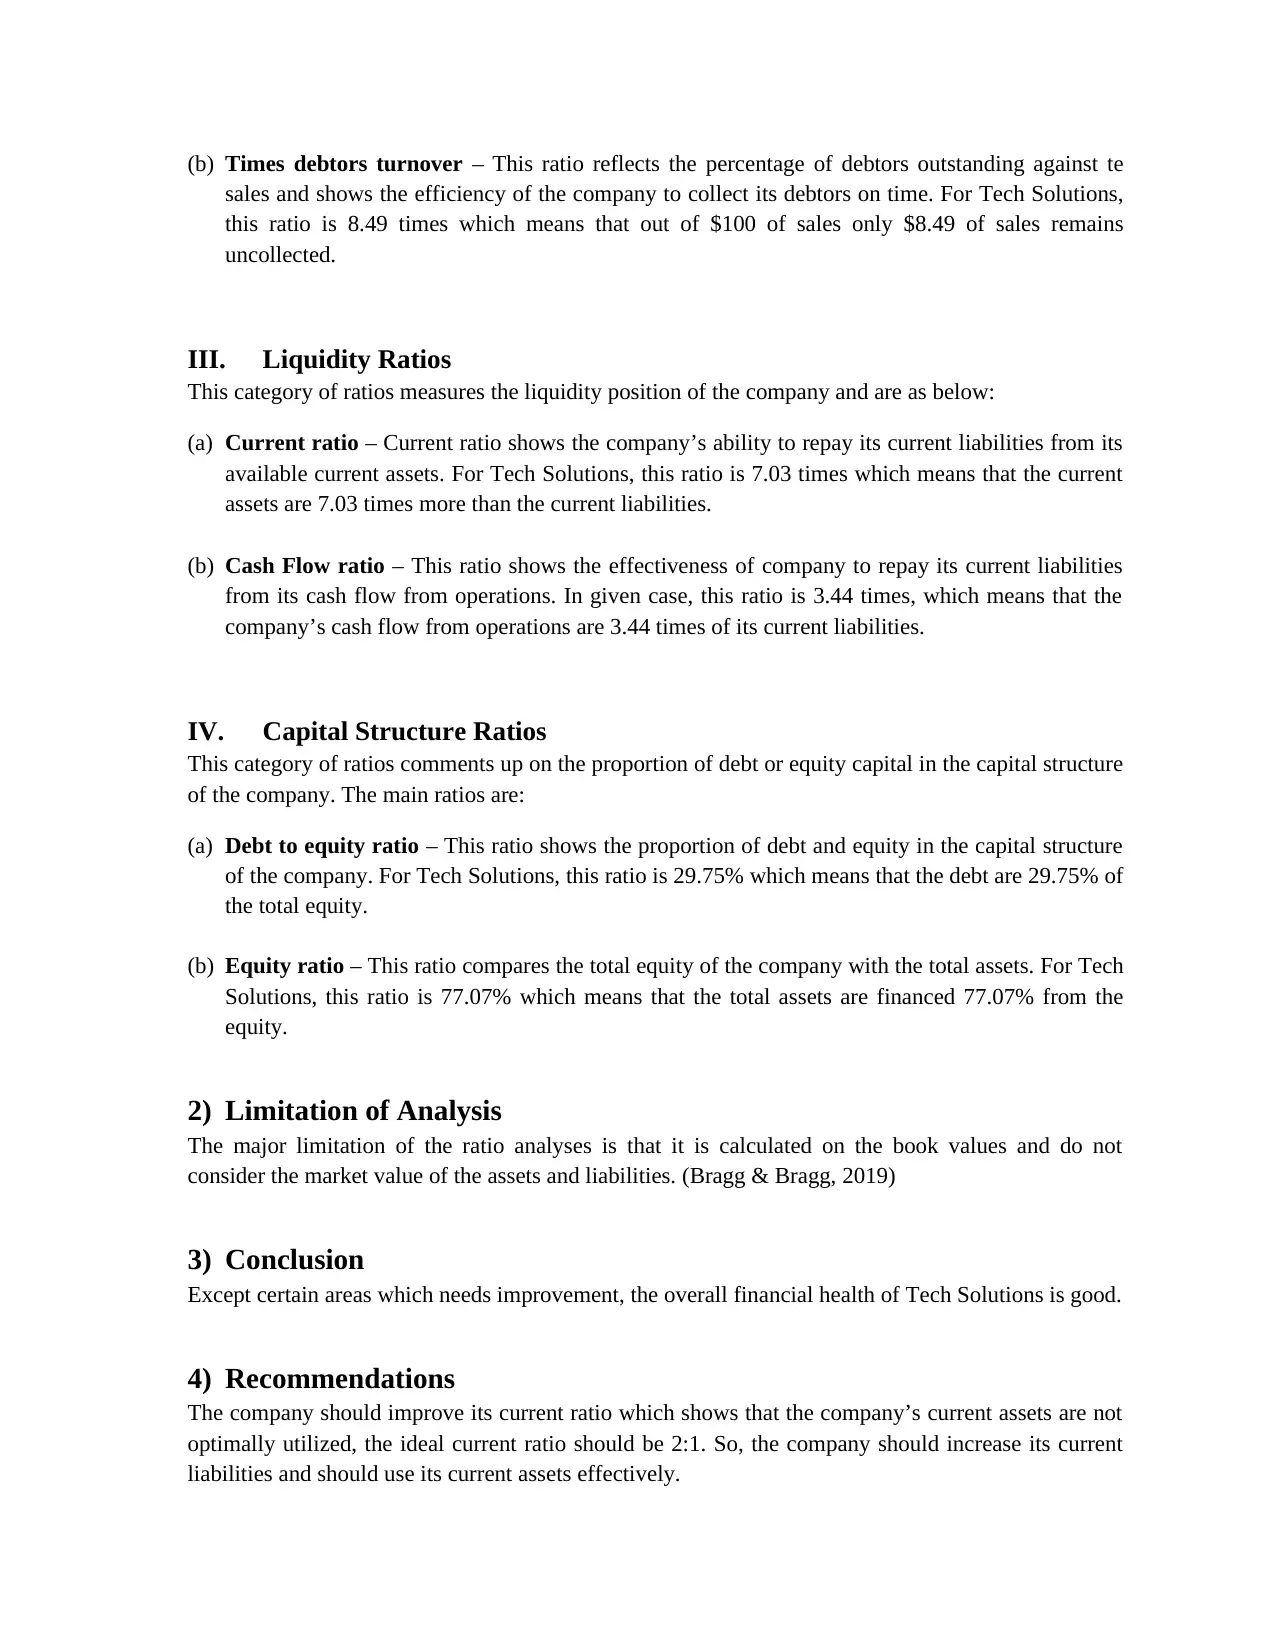
This report provides a financial analysis of Tech Solutions, evaluating its performance through various financial ratios. The report begins with an executive summary and then delves into the evaluation and comparison of profitability ratios (return on equity and profit margin), asset efficiency ratios (asset turnover and times debtors turnover), liquidity ratios (current ratio and cash flow ratio), and capital structure ratios (debt to equity and equity ratio). The analysis provides insights into the company's financial health, highlighting strengths and weaknesses. The report also discusses the limitations of ratio analysis and concludes with recommendations for improvement, specifically suggesting that the company improve its current ratio by optimizing its current assets and liabilities. The report is supported by references to relevant financial resources.

Report on Evaluation of Ratio
Ratios comparison and recommendations
08/May/2019
Tech Solutions
Ratios comparison and recommendations
08/May/2019
Tech Solutions
Paraphrase This Document
Need a fresh take? Get an instant paraphrase of this document with our AI Paraphraser

Contents
Executive Summary.....................................................................................................................................2
1) Evaluation and comparison of ratios calculated in Part C....................................................................2
I. Profitability Ratios...........................................................................................................................2
(a) Return on equity......................................................................................................................2
(b) Profit margin ratio....................................................................................................................2
II. Asset Efficiency Ratios....................................................................................................................2
(a) Assets turnover ratio................................................................................................................2
(b) Times debtors turnover............................................................................................................3
III. Liquidity Ratios...........................................................................................................................3
(a) Current ratio.............................................................................................................................3
(b) Cash Flow ratio........................................................................................................................3
IV. Capital Structure Ratios...............................................................................................................3
(a) Debt to equity ratio..................................................................................................................3
(b) Equity ratio..............................................................................................................................3
2) Limitation of Analysis.........................................................................................................................3
3) Conclusion...........................................................................................................................................3
4) Recommendations...............................................................................................................................3
5) References...........................................................................................................................................4

Executive Summary
The report is prepared for Jessican Smith on the financial health of Tech Solutions for the 2019 financial
year. The report highlights the analysis of various ratios calculated in the part c and explains their
meaning and impact on the financial performance of the company. The evaluation and comparison of the
ratios are as below:
1) Evaluation and comparison of ratios calculated in Part C
Ratios are an important aspect for analyzing the financial performance of any company. The ratios
provide instant analyses of the financial numbers and are easily understandable for the layman’s point of
view. The ratio analyses are mainly conduct for the management to enable them to take important
decisions and developing understandability of the financial performance.
The analyses of the financial ratios of Tech Solutions is as below:
I. Profitability Ratios
These categories of ratios are used to evaluate and compare the profit earning capability of the
company. It not only compares the income but also the expenses and costs. The two types of ratios of
this category are: ("Profitability Ratios - Calculate Margin, Profits, Return on Equity (ROE)", 2019)
(a) Return on equity – This ratio is used by the stakeholder’s as it shows the return earned by them
for the equity invested in the company. ROE is calculated by dividing profit of the company with
the equity of the stakeholders. For Tech Solutions, the return on equity is 36.31% which means
that by introducing $100 of the capital in the company, the investors can earn a profit of $36.31.
(b) Profit margin ratio – Profit margin is an important profitability ratio and shows the percentage
of net profit earned over the sales revenue. For Tech Solutions, the profit margin ratio is 61.41%.
it means that for every sale of $1, the company is generating the net profit of $0.6141 cents.
II. Asset Efficiency Ratios
This category of ratio measures the operating and profitability efficiency of the company’s assets. It
shows that whether the company’s assets are optimally used and are generating efficient results. The
two types of ratios in this category are: ("Efficiency Ratios | Example | My Accounting Course",
2019)
(a) Assets turnover ratio – This ratio shows the return generated by the company’s assets and is
measured by dividing sales with the total assets employed in the business. For Tech Solutions, the
assets turnover ratio is 0.46 times that means that for every asset investment of $1, the company
can generate $0.46 cents of return over it.
⊘ This is a preview!⊘
Do you want full access?
Subscribe today to unlock all pages.

Trusted by 1+ million students worldwide

(b) Times debtors turnover – This ratio reflects the percentage of debtors outstanding against te
sales and shows the efficiency of the company to collect its debtors on time. For Tech Solutions,
this ratio is 8.49 times which means that out of $100 of sales only $8.49 of sales remains
uncollected.
III. Liquidity Ratios
This category of ratios measures the liquidity position of the company and are as below:
(a) Current ratio – Current ratio shows the company’s ability to repay its current liabilities from its
available current assets. For Tech Solutions, this ratio is 7.03 times which means that the current
assets are 7.03 times more than the current liabilities.
(b) Cash Flow ratio – This ratio shows the effectiveness of company to repay its current liabilities
from its cash flow from operations. In given case, this ratio is 3.44 times, which means that the
company’s cash flow from operations are 3.44 times of its current liabilities.
IV. Capital Structure Ratios
This category of ratios comments up on the proportion of debt or equity capital in the capital structure
of the company. The main ratios are:
(a) Debt to equity ratio – This ratio shows the proportion of debt and equity in the capital structure
of the company. For Tech Solutions, this ratio is 29.75% which means that the debt are 29.75% of
the total equity.
(b) Equity ratio – This ratio compares the total equity of the company with the total assets. For Tech
Solutions, this ratio is 77.07% which means that the total assets are financed 77.07% from the
equity.
2) Limitation of Analysis
The major limitation of the ratio analyses is that it is calculated on the book values and do not
consider the market value of the assets and liabilities. (Bragg & Bragg, 2019)
3) Conclusion
Except certain areas which needs improvement, the overall financial health of Tech Solutions is good.
4) Recommendations
The company should improve its current ratio which shows that the company’s current assets are not
optimally utilized, the ideal current ratio should be 2:1. So, the company should increase its current
liabilities and should use its current assets effectively.
Paraphrase This Document
Need a fresh take? Get an instant paraphrase of this document with our AI Paraphraser

5) References
Bragg, S., & Bragg, S. (2019). The limitations of ratio analysis. Retrieved from
https://www.accountingtools.com/articles/what-are-the-limitations-of-ratio-analysis.html
Efficiency Ratios | Example | My Accounting Course. (2019). Retrieved from
https://www.myaccountingcourse.com/financial-ratios/efficiency-ratios
Profitability Ratios - Calculate Margin, Profits, Return on Equity (ROE). (2019). Retrieved from
https://corporatefinanceinstitute.com/resources/knowledge/finance/profitability-ratios/
Financial Analysis and Accounting Book of Reference: Statement of Financial Position | IFRS Statements
| IFRS Reports | ReadyRatios.com. (2019). Retrieved from
https://www.readyratios.com/reference/liquidity/
1 out of 5
Related Documents

Your All-in-One AI-Powered Toolkit for Academic Success.
+13062052269
info@desklib.com
Available 24*7 on WhatsApp / Email
Unlock your academic potential
Copyright © 2020–2025 A2Z Services. All Rights Reserved. Developed and managed by ZUCOL.