BUS106 Accounting for Business: Worley Parsons Financial Report
VerifiedAdded on  2024/05/29
|13
|2278
|300
Report
AI Summary
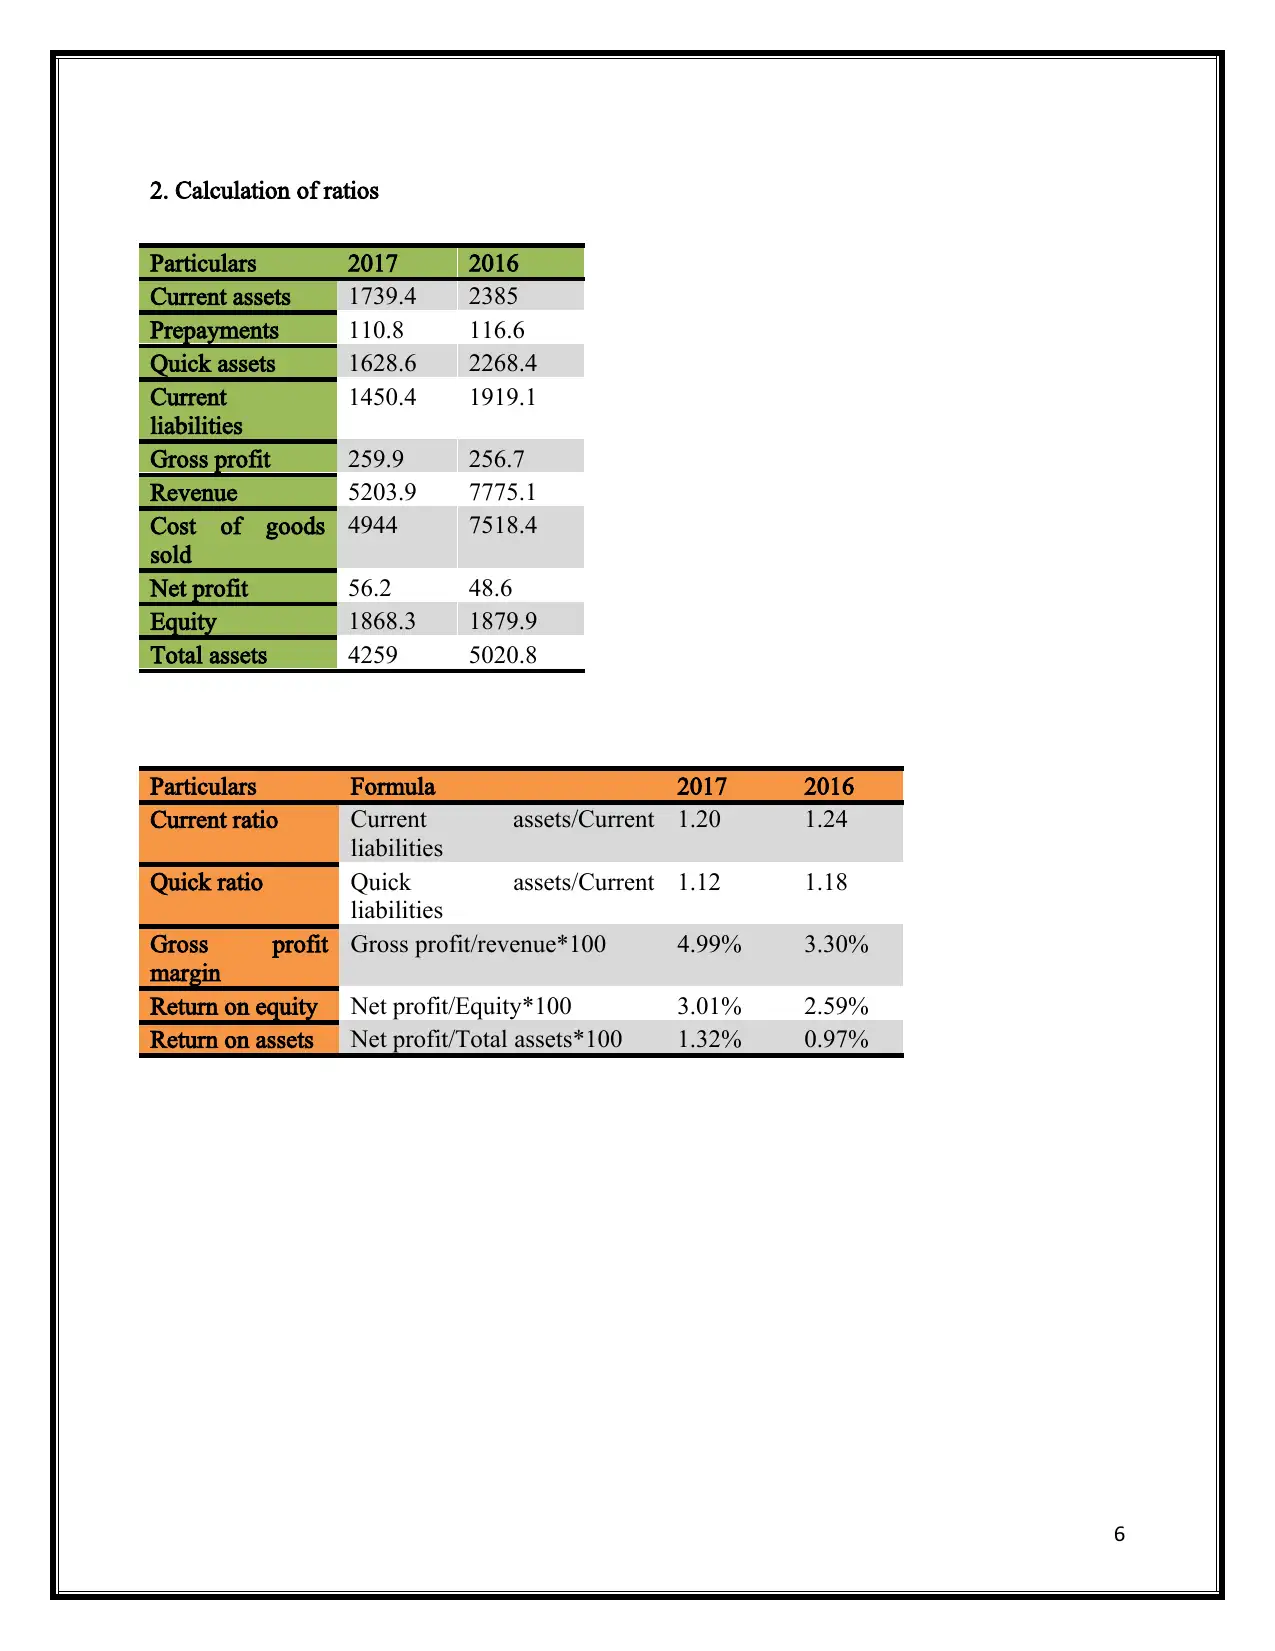
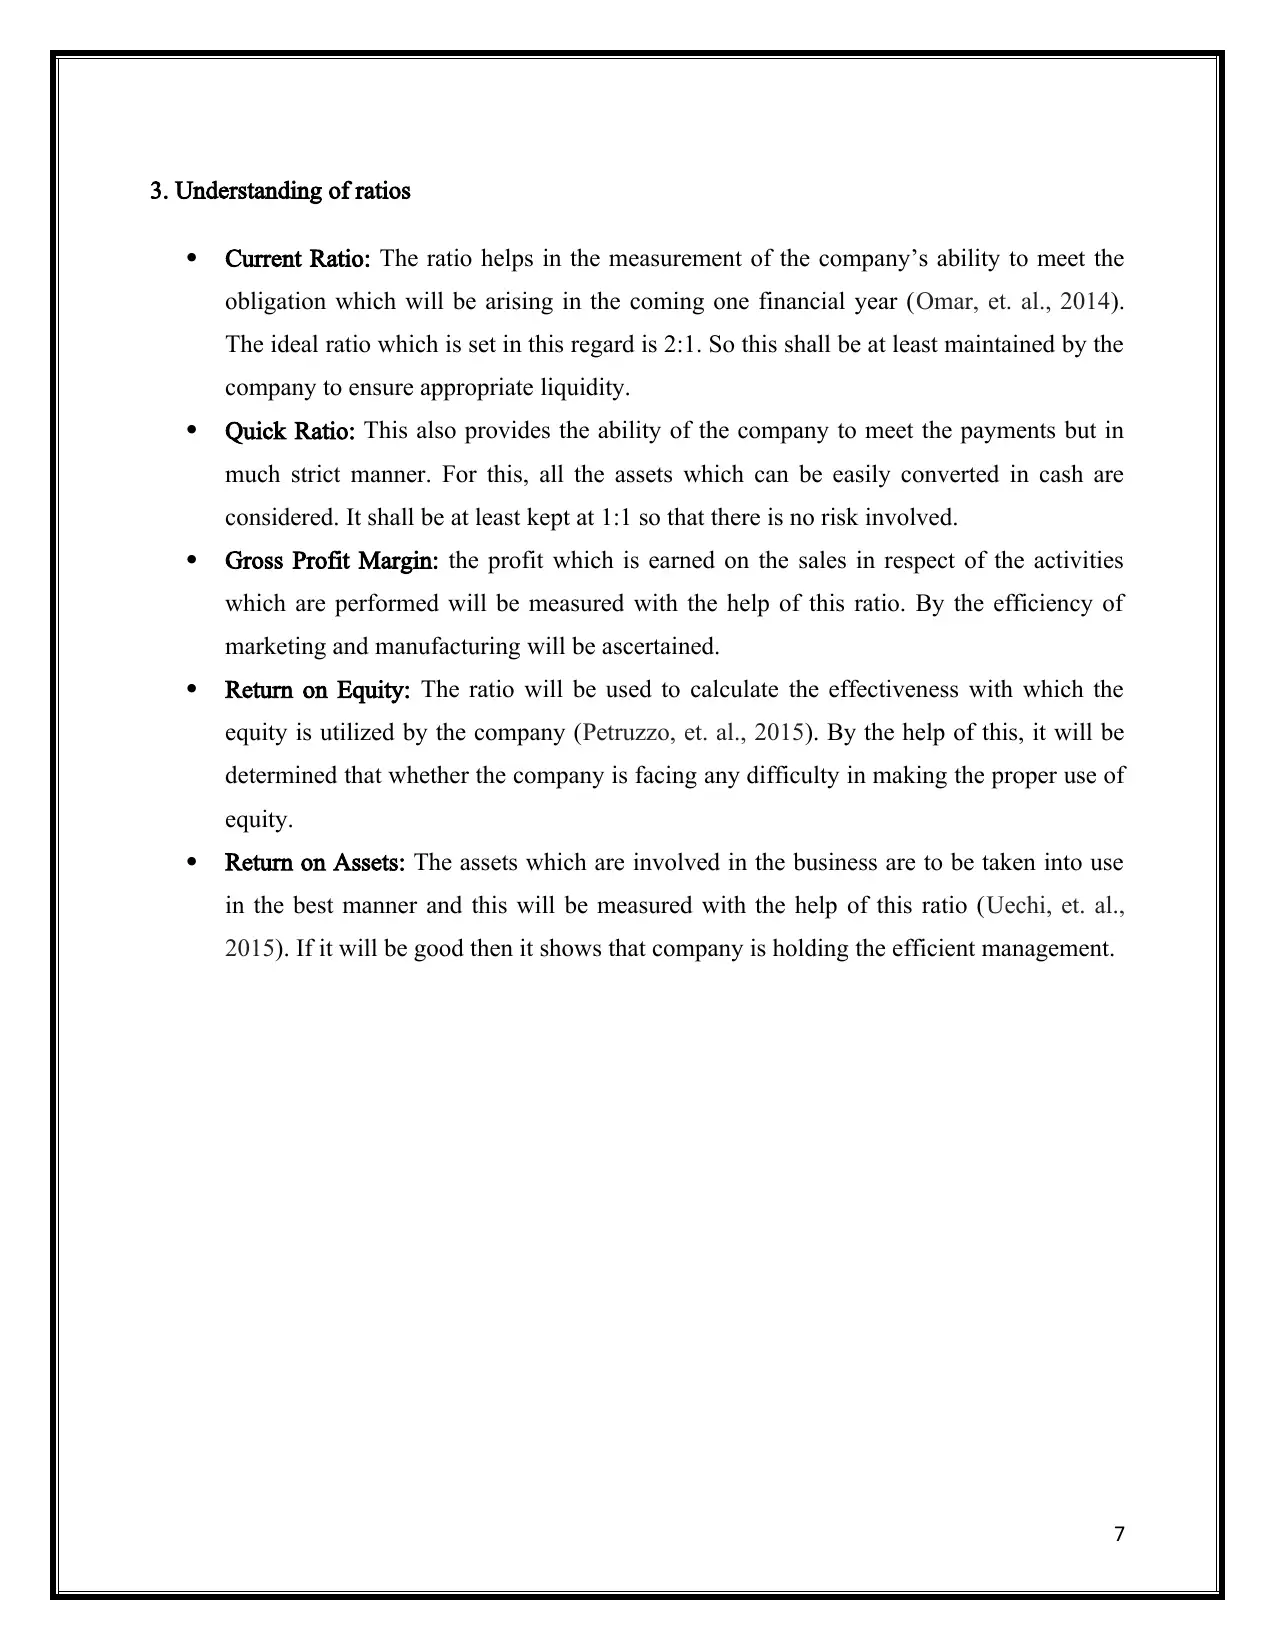
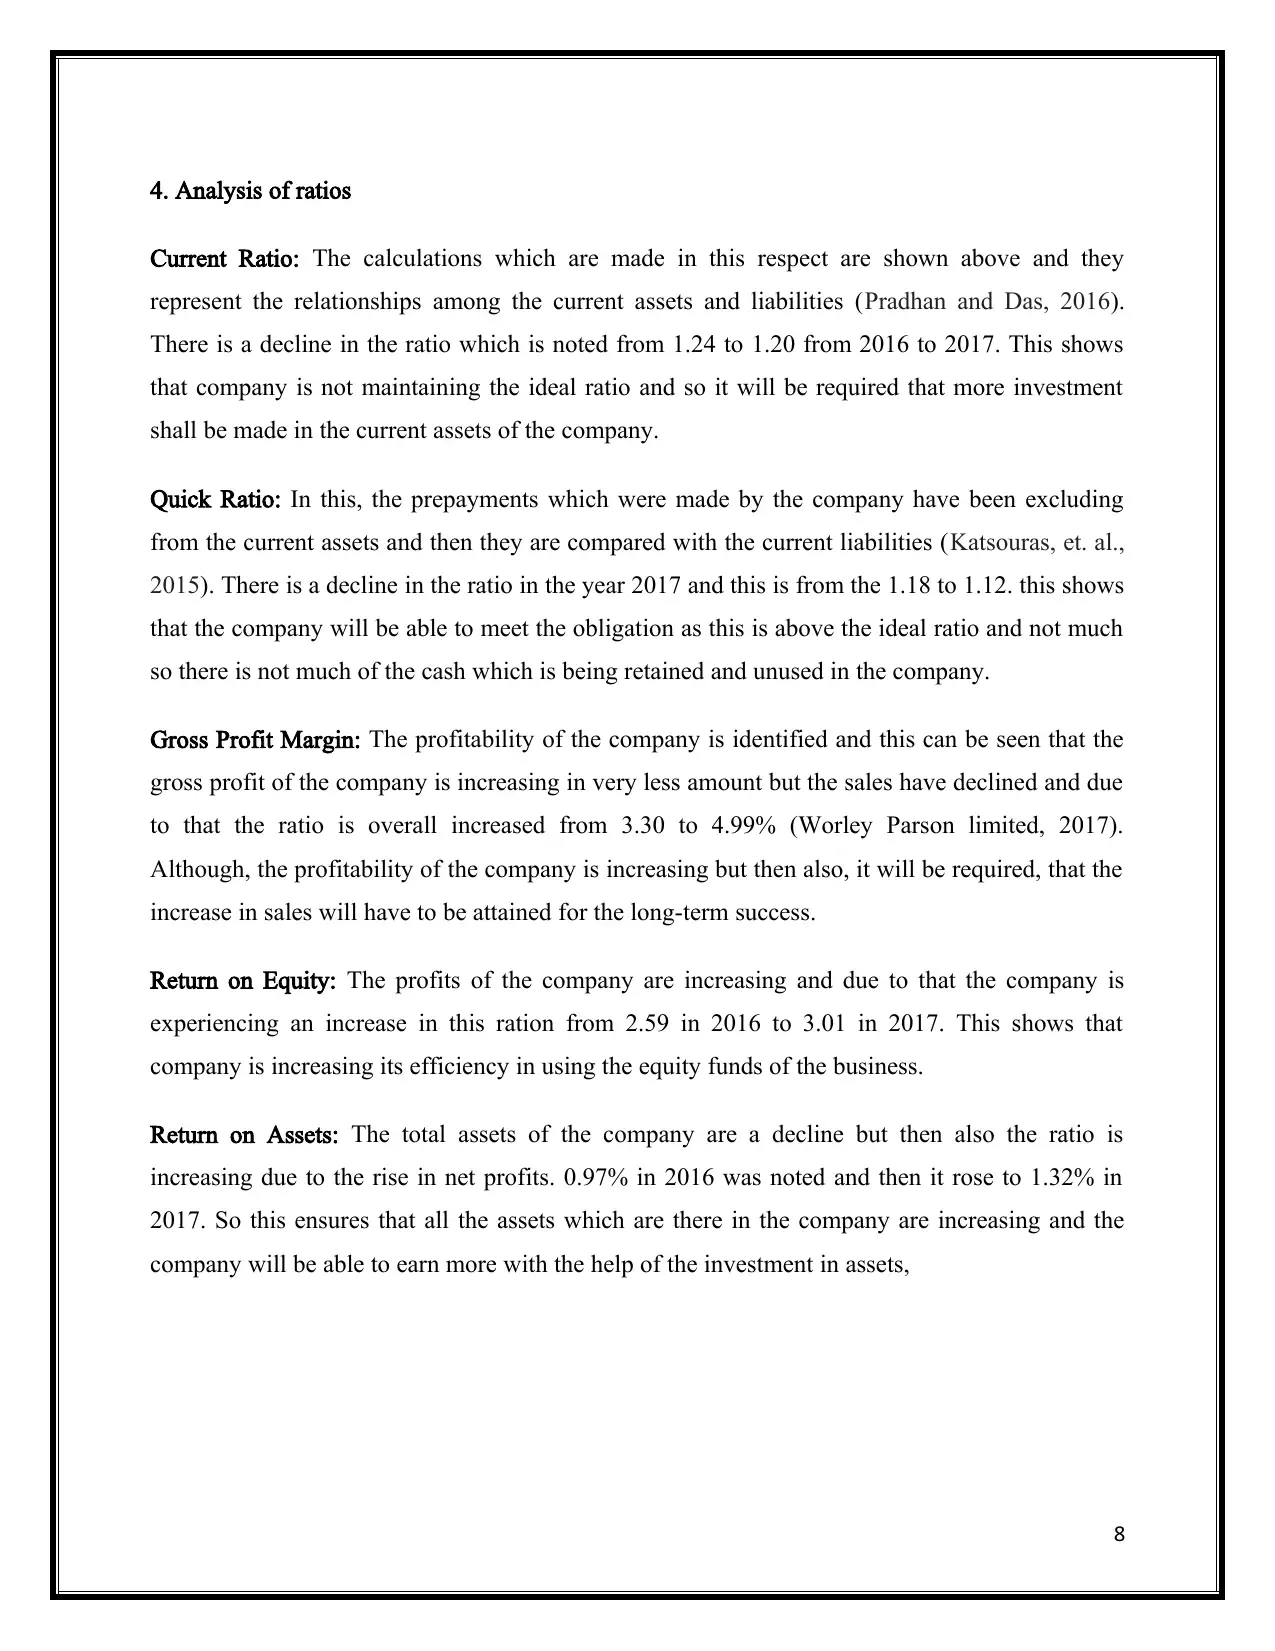
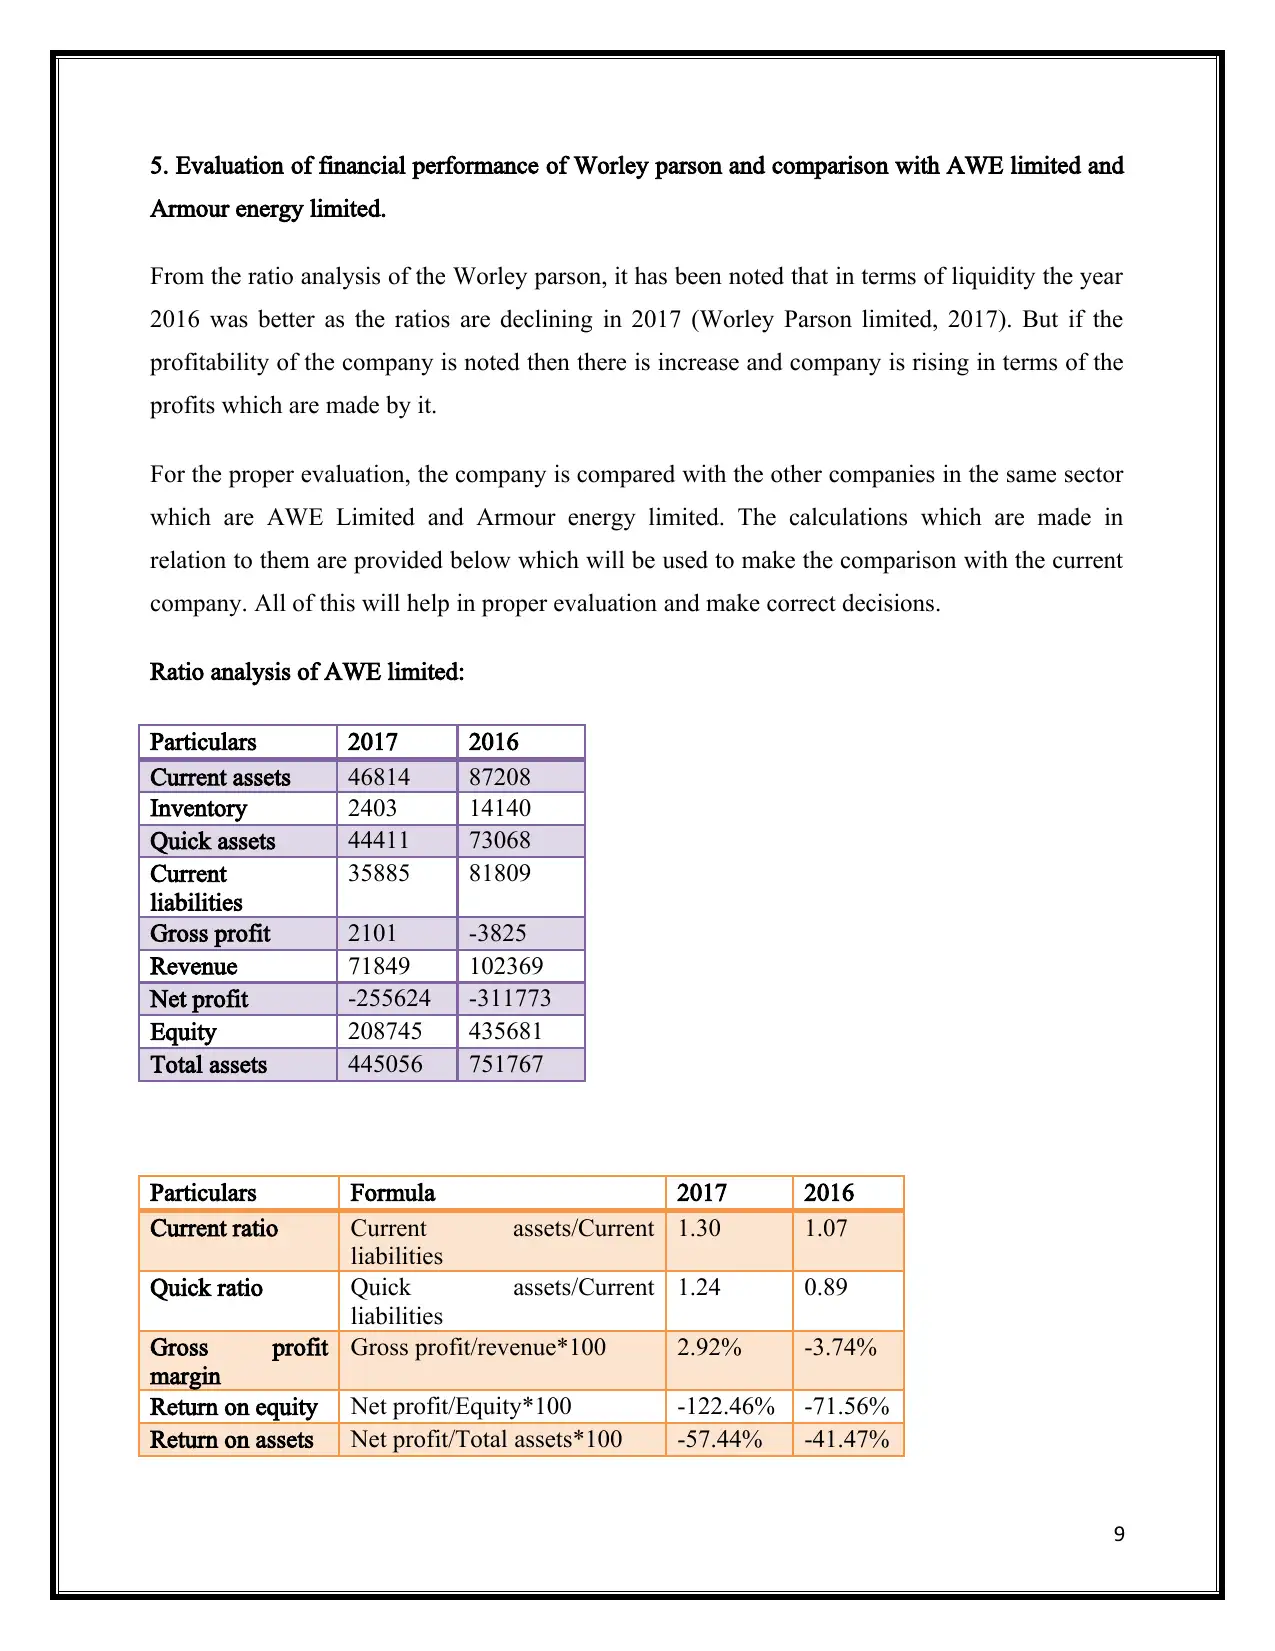
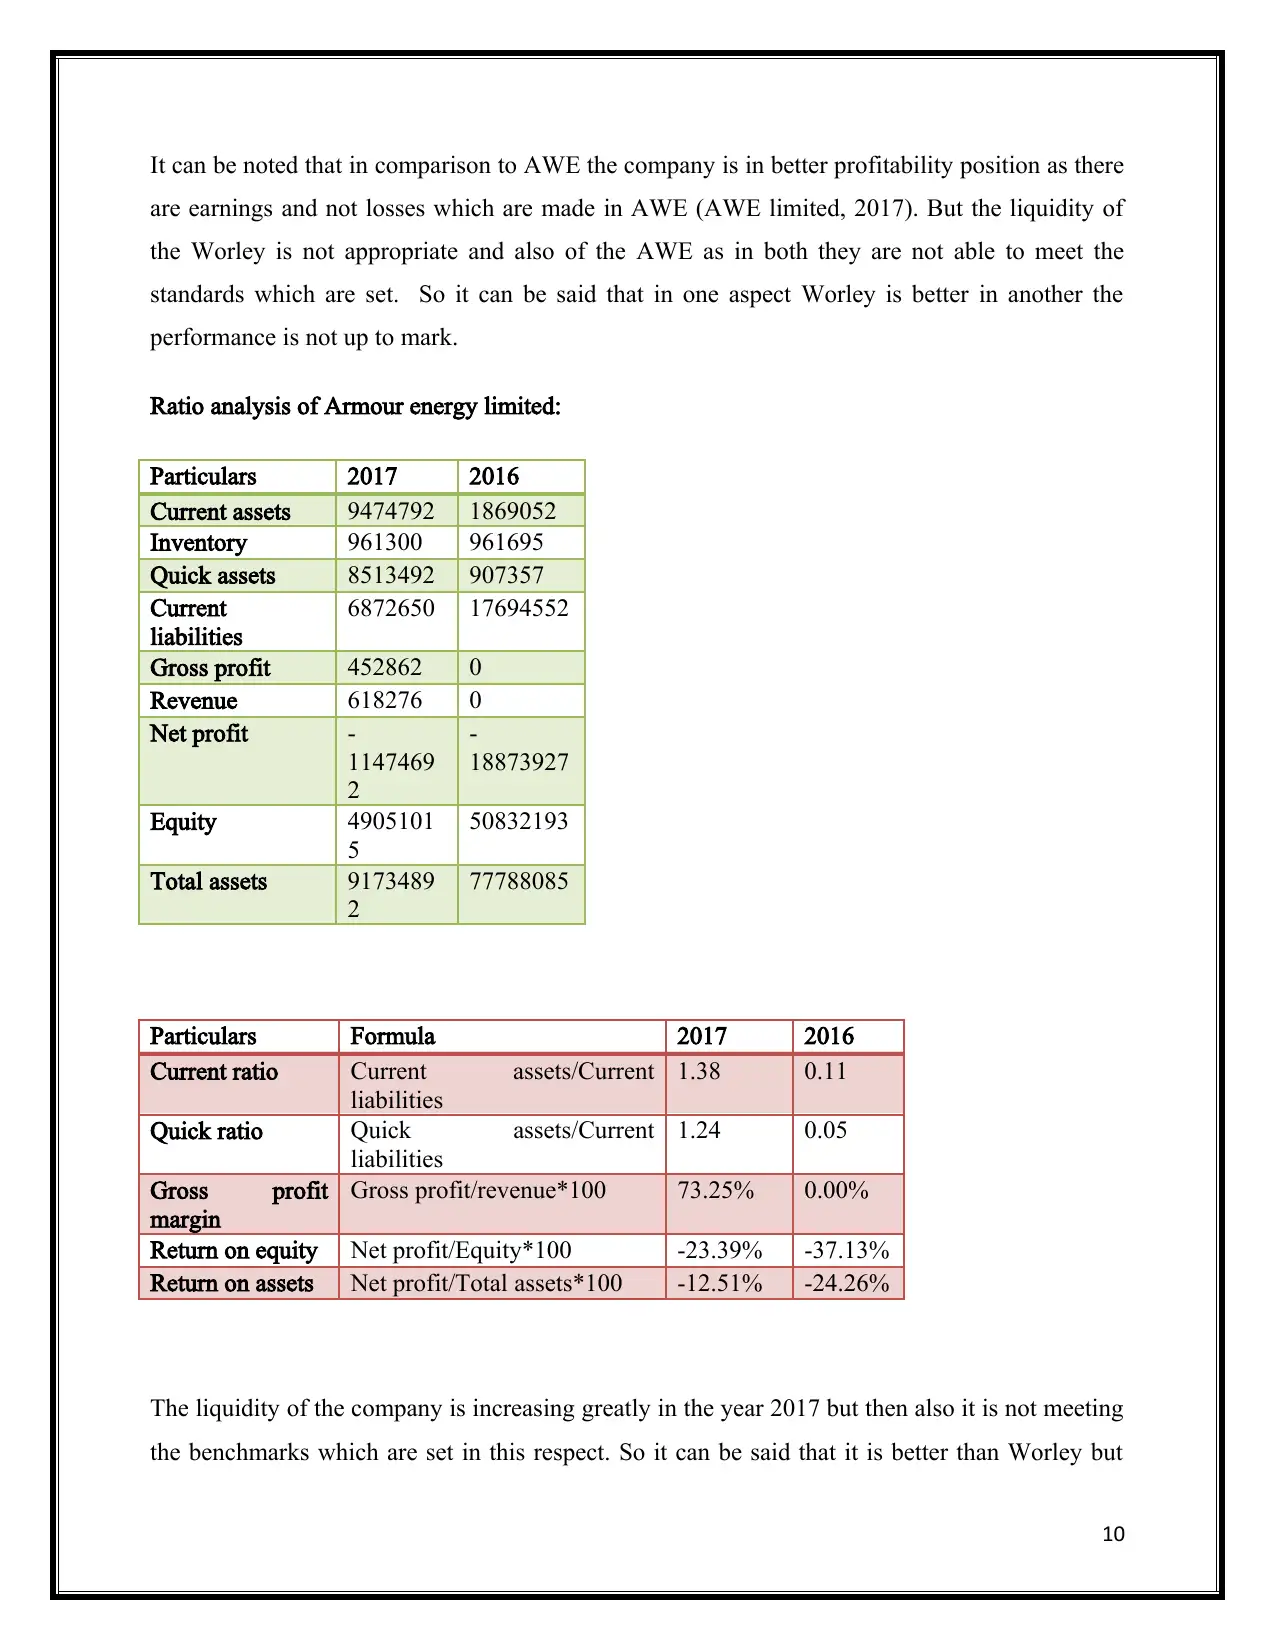
This report provides a financial analysis of Worley Parsons Limited, focusing on ratio analysis to evaluate the company's financial health. Various financial ratios, including current ratio, quick ratio, gross profit margin, return on equity, and return on assets, are calculated for the years 2016 and 2017 and compared to assess the company's performance over time. Furthermore, Worley Parsons is compared to AWE Limited and Armour Energy Limited to benchmark its financial standing within the industry. The analysis reveals insights into the company's liquidity and profitability, highlighting areas for improvement. The report concludes that while Worley Parsons demonstrates better profitability than its peers, its liquidity needs improvement, emphasizing the importance of considering financial policies and cash flow before making investment decisions. Desklib provides students access to similar past papers and solved assignments.

BUS106 Accounting for Business
1
1
Paraphrase This Document
Need a fresh take? Get an instant paraphrase of this document with our AI Paraphraser

Executive summary
The report that is presented below, shows all the aspects which are related to the financial
analysis of the company. For that, the understanding of the ratios is gained and their basic
knowledge is achieved. Then the calculations are made for the company which is Worley
Parsons Limited in which various ratios are determined. They are done for two years and
comparison is made among them. The other two companies are selected for which also the ratio
analysis is performed and then it is compared with the Worley and the results help in making of
the best decisions in respect of the investments to be made or not.
2

Table of Contents
Executive summary.....................................................................................................................................2
Introduction.................................................................................................................................................4
1. Overview of Worley parson limited.....................................................................................................5
2. Calculation of ratios.............................................................................................................................6
3. Understanding of ratios........................................................................................................................7
4. Analysis of ratios.................................................................................................................................8
5. Evaluation of financial performance of Worley parson and comparison with AWE limited and
Armour energy limited............................................................................................................................9
Conclusion.................................................................................................................................................12
References.................................................................................................................................................13
3
⊘ This is a preview!⊘
Do you want full access?
Subscribe today to unlock all pages.

Trusted by 1+ million students worldwide

Introduction
In the business, there is the need for the carrying out of proper counting so that it is possible to
have all the information and then it can be used for the purpose of evaluation. In the given report
also the company Worley parson limited will be used and all the financial data related to it will
be considered so that its position can be checked. For this ratios will be used and they will be
compared to the company as well as with other entities so that proper understanding can be
gained and conclusion can be drawn in an effective manner.
4
Paraphrase This Document
Need a fresh take? Get an instant paraphrase of this document with our AI Paraphraser

1. Overview of Worley parson limited.
Worley parson is the company which is situated in Australia and is involved in providing the
services related to the energy, resources and industrial sector. There are several services which
are involved in this and they include delivery services of the project, engineering design. In this
reliability, maintenance and support services are also provided in addition (Worley Parson
limited, 2017). The company operates at global scope and has about 150 offices in the whole
world. The services are also provided in locations such as arctic, dessert, and deep sea. There are
advisory services also which are provided to the customers by the company. The areas which are
covered by it include Asia, Australia, Pacific, Europe, China, America, and Africa.
5

2. Calculation of ratios
Particulars 2017 2016
Current assets 1739.4 2385
Prepayments 110.8 116.6
Quick assets 1628.6 2268.4
Current
liabilities
1450.4 1919.1
Gross profit 259.9 256.7
Revenue 5203.9 7775.1
Cost of goods
sold
4944 7518.4
Net profit 56.2 48.6
Equity 1868.3 1879.9
Total assets 4259 5020.8
Particulars Formula 2017 2016
Current ratio Current assets/Current
liabilities
1.20 1.24
Quick ratio Quick assets/Current
liabilities
1.12 1.18
Gross profit
margin
Gross profit/revenue*100 4.99% 3.30%
Return on equity Net profit/Equity*100 3.01% 2.59%
Return on assets Net profit/Total assets*100 1.32% 0.97%
6
⊘ This is a preview!⊘
Do you want full access?
Subscribe today to unlock all pages.

Trusted by 1+ million students worldwide

3. Understanding of ratios
 Current Ratio: The ratio helps in the measurement of the company’s ability to meet the
obligation which will be arising in the coming one financial year (Omar, et. al., 2014).
The ideal ratio which is set in this regard is 2:1. So this shall be at least maintained by the
company to ensure appropriate liquidity.
ï‚· Quick Ratio: This also provides the ability of the company to meet the payments but in
much strict manner. For this, all the assets which can be easily converted in cash are
considered. It shall be at least kept at 1:1 so that there is no risk involved.
ï‚· Gross Profit Margin: the profit which is earned on the sales in respect of the activities
which are performed will be measured with the help of this ratio. By the efficiency of
marketing and manufacturing will be ascertained.
ï‚· Return on Equity: The ratio will be used to calculate the effectiveness with which the
equity is utilized by the company (Petruzzo, et. al., 2015). By the help of this, it will be
determined that whether the company is facing any difficulty in making the proper use of
equity.
ï‚· Return on Assets: The assets which are involved in the business are to be taken into use
in the best manner and this will be measured with the help of this ratio (Uechi, et. al.,
2015). If it will be good then it shows that company is holding the efficient management.
7
Paraphrase This Document
Need a fresh take? Get an instant paraphrase of this document with our AI Paraphraser

4. Analysis of ratios
Current Ratio: The calculations which are made in this respect are shown above and they
represent the relationships among the current assets and liabilities (Pradhan and Das, 2016).
There is a decline in the ratio which is noted from 1.24 to 1.20 from 2016 to 2017. This shows
that company is not maintaining the ideal ratio and so it will be required that more investment
shall be made in the current assets of the company.
Quick Ratio: In this, the prepayments which were made by the company have been excluding
from the current assets and then they are compared with the current liabilities (Katsouras, et. al.,
2015). There is a decline in the ratio in the year 2017 and this is from the 1.18 to 1.12. this shows
that the company will be able to meet the obligation as this is above the ideal ratio and not much
so there is not much of the cash which is being retained and unused in the company.
Gross Profit Margin: The profitability of the company is identified and this can be seen that the
gross profit of the company is increasing in very less amount but the sales have declined and due
to that the ratio is overall increased from 3.30 to 4.99% (Worley Parson limited, 2017).
Although, the profitability of the company is increasing but then also, it will be required, that the
increase in sales will have to be attained for the long-term success.
Return on Equity: The profits of the company are increasing and due to that the company is
experiencing an increase in this ration from 2.59 in 2016 to 3.01 in 2017. This shows that
company is increasing its efficiency in using the equity funds of the business.
Return on Assets: The total assets of the company are a decline but then also the ratio is
increasing due to the rise in net profits. 0.97% in 2016 was noted and then it rose to 1.32% in
2017. So this ensures that all the assets which are there in the company are increasing and the
company will be able to earn more with the help of the investment in assets,
8

5. Evaluation of financial performance of Worley parson and comparison with AWE limited and
Armour energy limited.
From the ratio analysis of the Worley parson, it has been noted that in terms of liquidity the year
2016 was better as the ratios are declining in 2017 (Worley Parson limited, 2017). But if the
profitability of the company is noted then there is increase and company is rising in terms of the
profits which are made by it.
For the proper evaluation, the company is compared with the other companies in the same sector
which are AWE Limited and Armour energy limited. The calculations which are made in
relation to them are provided below which will be used to make the comparison with the current
company. All of this will help in proper evaluation and make correct decisions.
Ratio analysis of AWE limited:
Particulars 2017 2016
Current assets 46814 87208
Inventory 2403 14140
Quick assets 44411 73068
Current
liabilities
35885 81809
Gross profit 2101 -3825
Revenue 71849 102369
Net profit -255624 -311773
Equity 208745 435681
Total assets 445056 751767
Particulars Formula 2017 2016
Current ratio Current assets/Current
liabilities
1.30 1.07
Quick ratio Quick assets/Current
liabilities
1.24 0.89
Gross profit
margin
Gross profit/revenue*100 2.92% -3.74%
Return on equity Net profit/Equity*100 -122.46% -71.56%
Return on assets Net profit/Total assets*100 -57.44% -41.47%
9
⊘ This is a preview!⊘
Do you want full access?
Subscribe today to unlock all pages.

Trusted by 1+ million students worldwide

It can be noted that in comparison to AWE the company is in better profitability position as there
are earnings and not losses which are made in AWE (AWE limited, 2017). But the liquidity of
the Worley is not appropriate and also of the AWE as in both they are not able to meet the
standards which are set. So it can be said that in one aspect Worley is better in another the
performance is not up to mark.
Ratio analysis of Armour energy limited:
Particulars 2017 2016
Current assets 9474792 1869052
Inventory 961300 961695
Quick assets 8513492 907357
Current
liabilities
6872650 17694552
Gross profit 452862 0
Revenue 618276 0
Net profit -
1147469
2
-
18873927
Equity 4905101
5
50832193
Total assets 9173489
2
77788085
Particulars Formula 2017 2016
Current ratio Current assets/Current
liabilities
1.38 0.11
Quick ratio Quick assets/Current
liabilities
1.24 0.05
Gross profit
margin
Gross profit/revenue*100 73.25% 0.00%
Return on equity Net profit/Equity*100 -23.39% -37.13%
Return on assets Net profit/Total assets*100 -12.51% -24.26%
The liquidity of the company is increasing greatly in the year 2017 but then also it is not meeting
the benchmarks which are set in this respect. So it can be said that it is better than Worley but
10
Paraphrase This Document
Need a fresh take? Get an instant paraphrase of this document with our AI Paraphraser

overall not positive. The profitability is increasing in terms of the gross profit but there is
negative net profit (Armour energy limited, 2017). So it can be said that Worley is better as there
are no losses which are made by the company.
So it can be said that overall the investment can be made as a company is better than others and
profits are being made. In addition to the financial statements the policies of the company will
have to be checked and also the cash flow of the business will have to be evaluated before
making any decision in respect of the investment to be made.
11

Conclusion
From the report that is presented above, it can be concluded that the company will have to
maintain its position and for that evaluation is to be made so that improvement can be
considered. For this the financial analysis had been carried out in relation to Worley parson and
ratios are considered for the same. The comparison between two years is made and also with the
similar companies that are carrying business. The liquidity is to be improved in the business and
it is not meeting the parameter which has been set as per the standards.
12
⊘ This is a preview!⊘
Do you want full access?
Subscribe today to unlock all pages.

Trusted by 1+ million students worldwide
1 out of 13
Related Documents
Your All-in-One AI-Powered Toolkit for Academic Success.
 +13062052269
info@desklib.com
Available 24*7 on WhatsApp / Email
Unlock your academic potential
Copyright © 2020–2025 A2Z Services. All Rights Reserved. Developed and managed by ZUCOL.


