Financial Performance Analysis of Reckitt Benckiser (2010-2014)
VerifiedAdded on 2019/12/28
|10
|3699
|72
Report
AI Summary
This report provides a comprehensive financial analysis of Reckitt Benckiser (RB), a multinational consumer goods company, focusing on its performance from 2010 to 2014. The analysis includes an examination of various financial ratios, such as profitability, liquidity, working capital management, capital structure, and stock market performance. The report delves into the rationale behind selecting RB, highlighting its global presence and the importance of ratio analysis in understanding its financial position relative to competitors. The performance analysis covers key ratios like gross profit margin, current ratio, and debt-to-equity ratio, providing insights into RB's ability to generate profits, manage short-term obligations, and finance its operations. The report concludes with an assessment of RB's financial strengths and weaknesses, offering recommendations for future financial strategies and improvements. The findings reveal fluctuations in profitability, challenges in meeting short-term obligations, and varying trends in leverage and working capital, providing a detailed picture of RB's financial health during the analyzed period.

Financial Analysis
Paraphrase This Document
Need a fresh take? Get an instant paraphrase of this document with our AI Paraphraser

Table of Contents
INTRODUCTION................................................................................................................................3
RATIONALE .......................................................................................................................................3
PERFORMANCE ANALYSIS ...........................................................................................................4
Summary of the analysis..................................................................................................................7
LIMITATIONS.....................................................................................................................................7
CONCLUSION ...................................................................................................................................8
RECOMMENDATION .......................................................................................................................9
REFERENCES...................................................................................................................................10
INTRODUCTION
Reckitt Benckiser is a multinational organisation headquartered in London. It produces
consumer goods in the area of hygiene, health and home care. It was formed in 1999 by a merger of
Reckitt & Colman plc and Benckiser NV. The company visions to make the lifestyle of people
better and healthier. Reckitt Benckiser i.e. RB wants to make a difference in the lifestyle of
consumers by generating innovative alternatives for them. It is among the most fast pace growing
company in the world. In the year 2014 particularly RB has generated greater performance. This
was achieved by a purpose driven strategy to enhance revenue and sales for the company. The
purpose of this report is to conduct a study on the financial rations of the company (Uechi and et.al.,
2015). RB is selected for the project as operates around 60 countries and have vast international
presence. Study and comparison of financial ratios is done in order to identify competencies of the
company over the competitors. Financial analysis consists of evaluating figures acquired from
profitability, debt paying ability, liquidity, efficiency and various other factors. The report discusses
about viability, profitability and stability of Reckitt Benckiser over a span of five years. Thus, in
order to do that financial figures ranging from 2010-2012 are assessed and analysed.
RATIONALE
Globalization today has reached to a new height. RB wants to create new products and
provide better services to the consumers. In order to that company have formulated various
strategies over the time. Some of them have proved to be beneficial and raised profitability for the
company. On the other hand, at many instances company failed to achieve desired financial figures
at the end of the year. Reckitt Benckiser is a big name in the United Kingdom as well as other
international markets. It is among the leading organisation that manufactures wide variety of
consumer goods for the public. This company is selected for the research as it is a widely
proclaimed brand and has created various benefits for the economy of UK as well. The main
products are classified under health, home and hygiene. The company has brought great innovations
in the field of pharmaceuticals as well. This company is selected for ratio analysis as it generates
huge revenues and profits. It is important to analyse these ratios to identify the true financial
position of RB in the consumer good industry (Brigham and Ehrhardt, 2013). The rising pressure of
competition and pricing strategies of the companies has created greater pressure for Rb to operate
its business prospects. Company has made profits and incurred losses in many quadrants as well.
RB is responsible to shape the economy of United Kingdom by raising its standard to international
boundary. The company is known to provide employment to thousands of individuals in the United
Kingdom itself. Thus, it is viable to select this company in order to evaluate the financial aspects
and money making strategies of the company. Although the company has a good goodwill in the
⊘ This is a preview!⊘
Do you want full access?
Subscribe today to unlock all pages.
Trusted by 1+ million students worldwide
market, one can analyse financial strengths and loopholes only by studying the ratios of the
organisation. Hence, to identify the feasibility for future prospects of Rb ratios analysis is done on
the company.
PERFORMANCE ANALYSIS
1. Profitability Ratio- It is a measure to evaluate companies’ profile. It is the main objective
of a company to make profit. Each year RB must aim to increase the profits made from last
year. Profit is the left over part after sailing has been performed in an organisation. Any
organization has to decide for a cost price which includes manufacturing charges of the
product. When a company sells certain products it receives amount. This amount is termed
as the selling price. Profitability ratio is used to analyse the income generated from selling a
product. It shows the capacity of an organization to make profits for the company. In order
to that income statement are compared to calculate the amount yielded from the operations
conducted by the business. It also shows how good a company is performing. For example,
if RB is registering consecutive profits in years (Dokas, Giokas and Tsamis, 2014). This
means that the company is making good profits and all the expenses incurred are been
recovered by the organisation. There are various different ratios used to analyse the
profitability of an organisation. Like gross profit margin, operating margin, return on equity
and many more. This ratio particularly tells about the cost incurred and revenue received by
the company for sale of goods and services.
2. Liquidity Ratio- The relation of liquid assets of a company with the liability to be paid are
used under liquidity ratio. Liquidity for an organisation is defined as the ability of an
organisation to pay its financial debts to the respective party. Thus, it can be stated that
liquidity ratios is used to identify RB's capability to pay for its short term debt. It is very
relevant for an enterprise to pay for its debt within a period. This is done to not let the debts
or liabilities become due for a longer period of time. Liquidity ratios shows the cash
available for the company in terms of current assets. This cash or assets are used to pay the
debts incurred by the organisation. It is considered good for the brand image of an
organisation to be quickly able to convert its current assets into cash to pay of any urgent
dues or liability (Jarrow and Chatterjea, 2013). If the company is not able to raise enough
cash in a shorter period then it is not considered idle for the financial position of a company.
In a business the firm may require to anytime sale its assets like trading securities or
inventory to get cash. If the organisation is able to generate cash out of current assets, only
then it is able to meet with liquidity requirements.
3. Working Capital Management- These ratios is calculated to ensure that the organization is
Paraphrase This Document
Need a fresh take? Get an instant paraphrase of this document with our AI Paraphraser
able to meet with the objectives and goals of its operations. Working capital management
refers to the ability of the organization to manage its inventories, cash, accounts receivables
etc. These ratios are also calculated to identify the maturity of upcoming operational
expenses and short term debt that has to be paid by the company. Any organisation is
required to have sufficient cash flow to meet the requirements of various business activity of
an organisation. Working capital turnover ratio, accounts receivables turnover ratio,
inventory turnover ratio etc. are used to identify the working capital of the company. In
basic working capital is calculated on the basis of the difference between current assets and
liabilities. Here current assets do not include cash (Adrian and Shin, 2014). An ideal
working capital cycle consists of 12 months and it is very critical for a company to pay its
long term debts in that period. An increased working capital ratios depicts that business has
increased its current assets or decreased its current liabilities. For example, if RB has paid its
creditors then the liability side of the balance sheet will reduce.
4. Capital Structure- A capital structure is the ability of the firm to finance its business
prospects to increase growth and profitability for itself. In general capital structure consists
of long term debt, equity and short term debt. This is because these are the sources from
where Reckitt Benckiser can raise its finances. While studying capital structure of a
company it is important to analyse the long term debt proportion to short term. This is
because when a company shows its capital structure it depicts debt to equity ratio (Brigham
and Ehrhardt, 2013). For example if a company raises $10 billion through equity and $90
billion through debt. It will be said that particular company is 10% financed by equity and
90% financed by debt. Thus, capital structure of a company is made up of debt and equity
proportions. The long term dent in capital structure refers to permanent financing. Each
component in capital structure has different cost associated to them. For example, capital
raised through equity is referred to as the capital raised to conduct business operations.
Whereas borrowings are the liabilities for a business. The cost incurred for both the
elements are different in respect to the business particulars of Reckitt Benckiser.
5. Stock Market Performance- These are also refereed to as market measure ratios as these
measures the invested stock by investors in the company. The shareholders are the
individuals who invest their money in shares of a company. They expect a return on
investment on the respective amount bought through shares. The basic relationship with
market and company is the return on value invested in the company. They also demonstrate
the price per share or earnings, assets or growth (Rose and Hudgins, 2014). The ratios used
to analyse stick market performance of a company are earning per share, dividend payout
and price earning share. These ratios are proved to be beneficial for the investors as they like
to know how much profit is generated by each share.
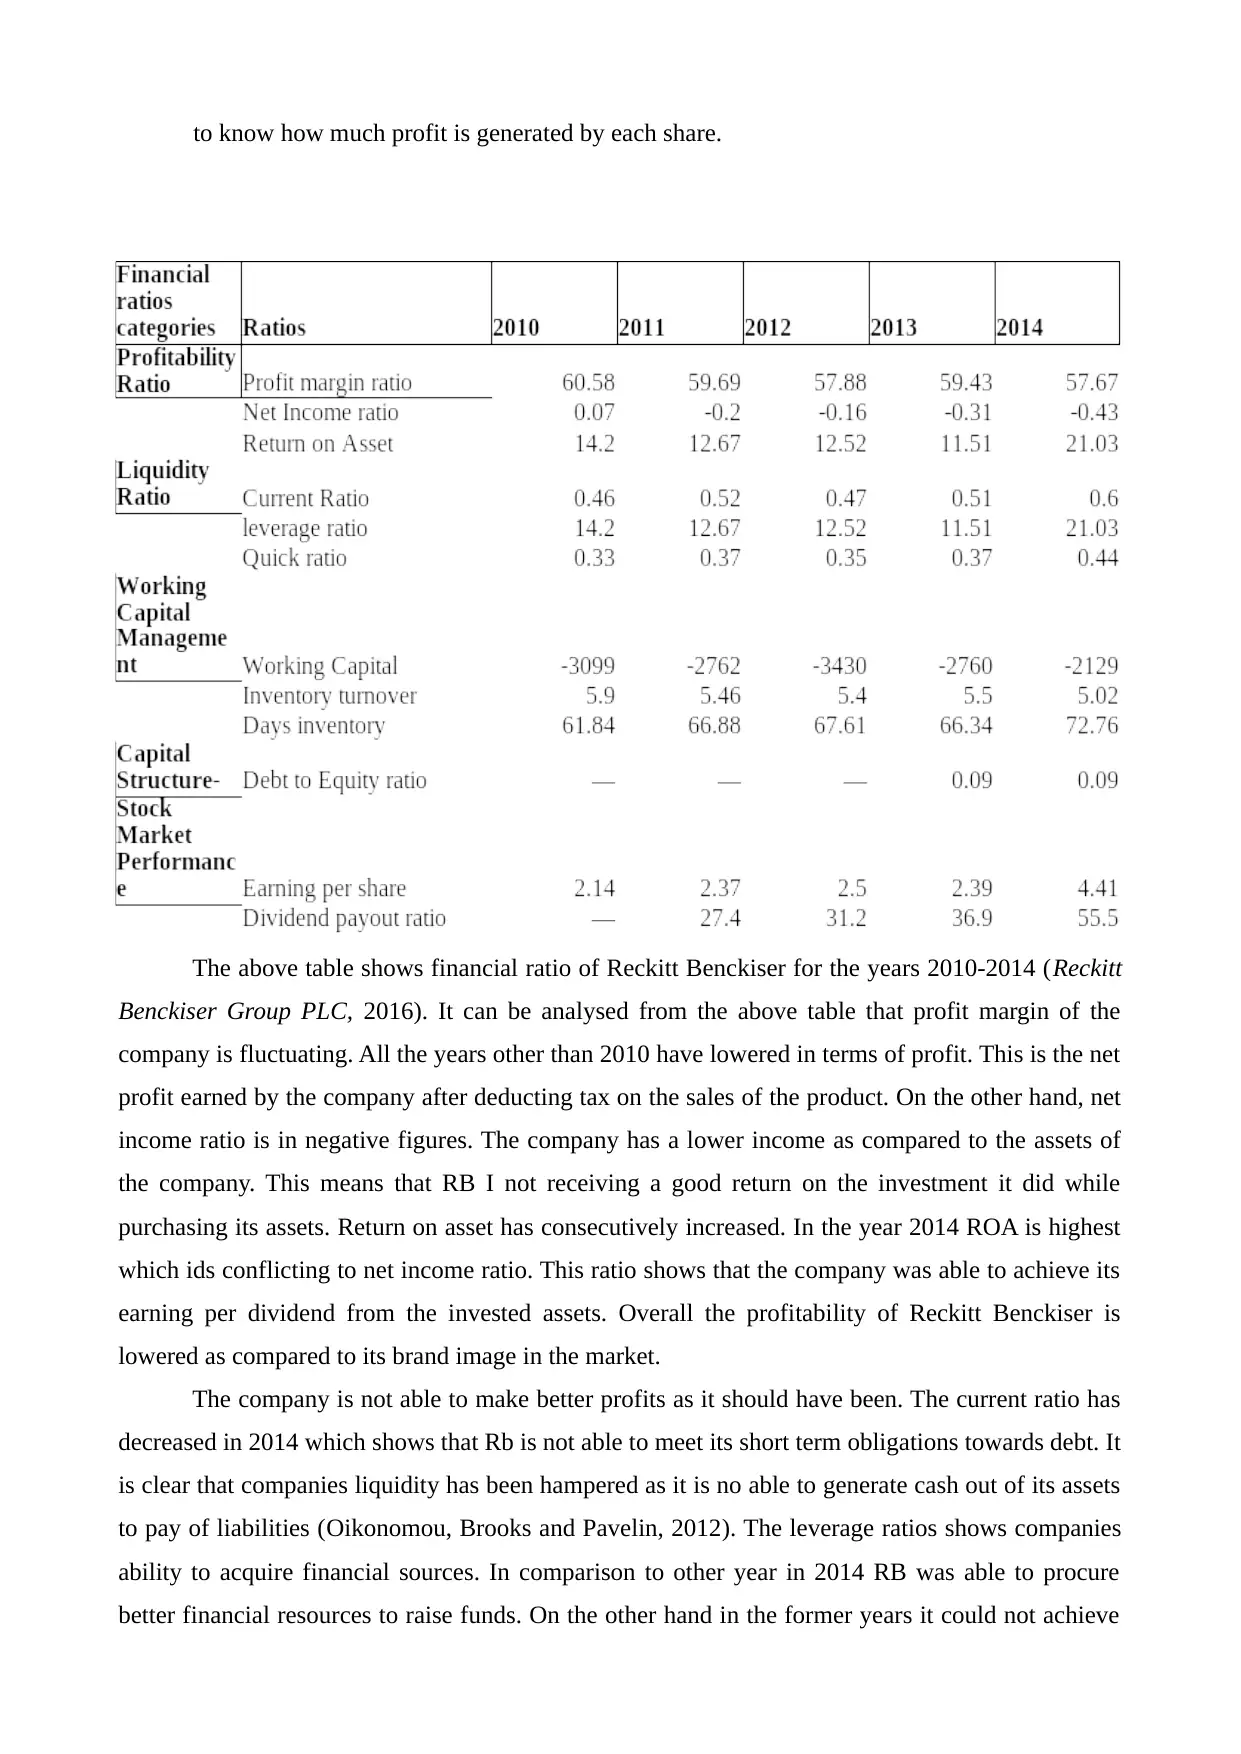
The above table shows financial ratio of Reckitt Benckiser for the years 2010-2014 (Reckitt
Benckiser Group PLC, 2016). It can be analysed from the above table that profit margin of the
company is fluctuating. All the years other than 2010 have lowered in terms of profit. This is the net
profit earned by the company after deducting tax on the sales of the product. On the other hand, net
income ratio is in negative figures. The company has a lower income as compared to the assets of
the company. This means that RB I not receiving a good return on the investment it did while
purchasing its assets. Return on asset has consecutively increased. In the year 2014 ROA is highest
which ids conflicting to net income ratio. This ratio shows that the company was able to achieve its
earning per dividend from the invested assets. Overall the profitability of Reckitt Benckiser is
lowered as compared to its brand image in the market.
The company is not able to make better profits as it should have been. The current ratio has
decreased in 2014 which shows that Rb is not able to meet its short term obligations towards debt. It
is clear that companies liquidity has been hampered as it is no able to generate cash out of its assets
to pay of liabilities (Oikonomou, Brooks and Pavelin, 2012). The leverage ratios shows companies
ability to acquire financial sources. In comparison to other year in 2014 RB was able to procure
better financial resources to raise funds. On the other hand in the former years it could not achieve
⊘ This is a preview!⊘
Do you want full access?
Subscribe today to unlock all pages.
Trusted by 1+ million students worldwide
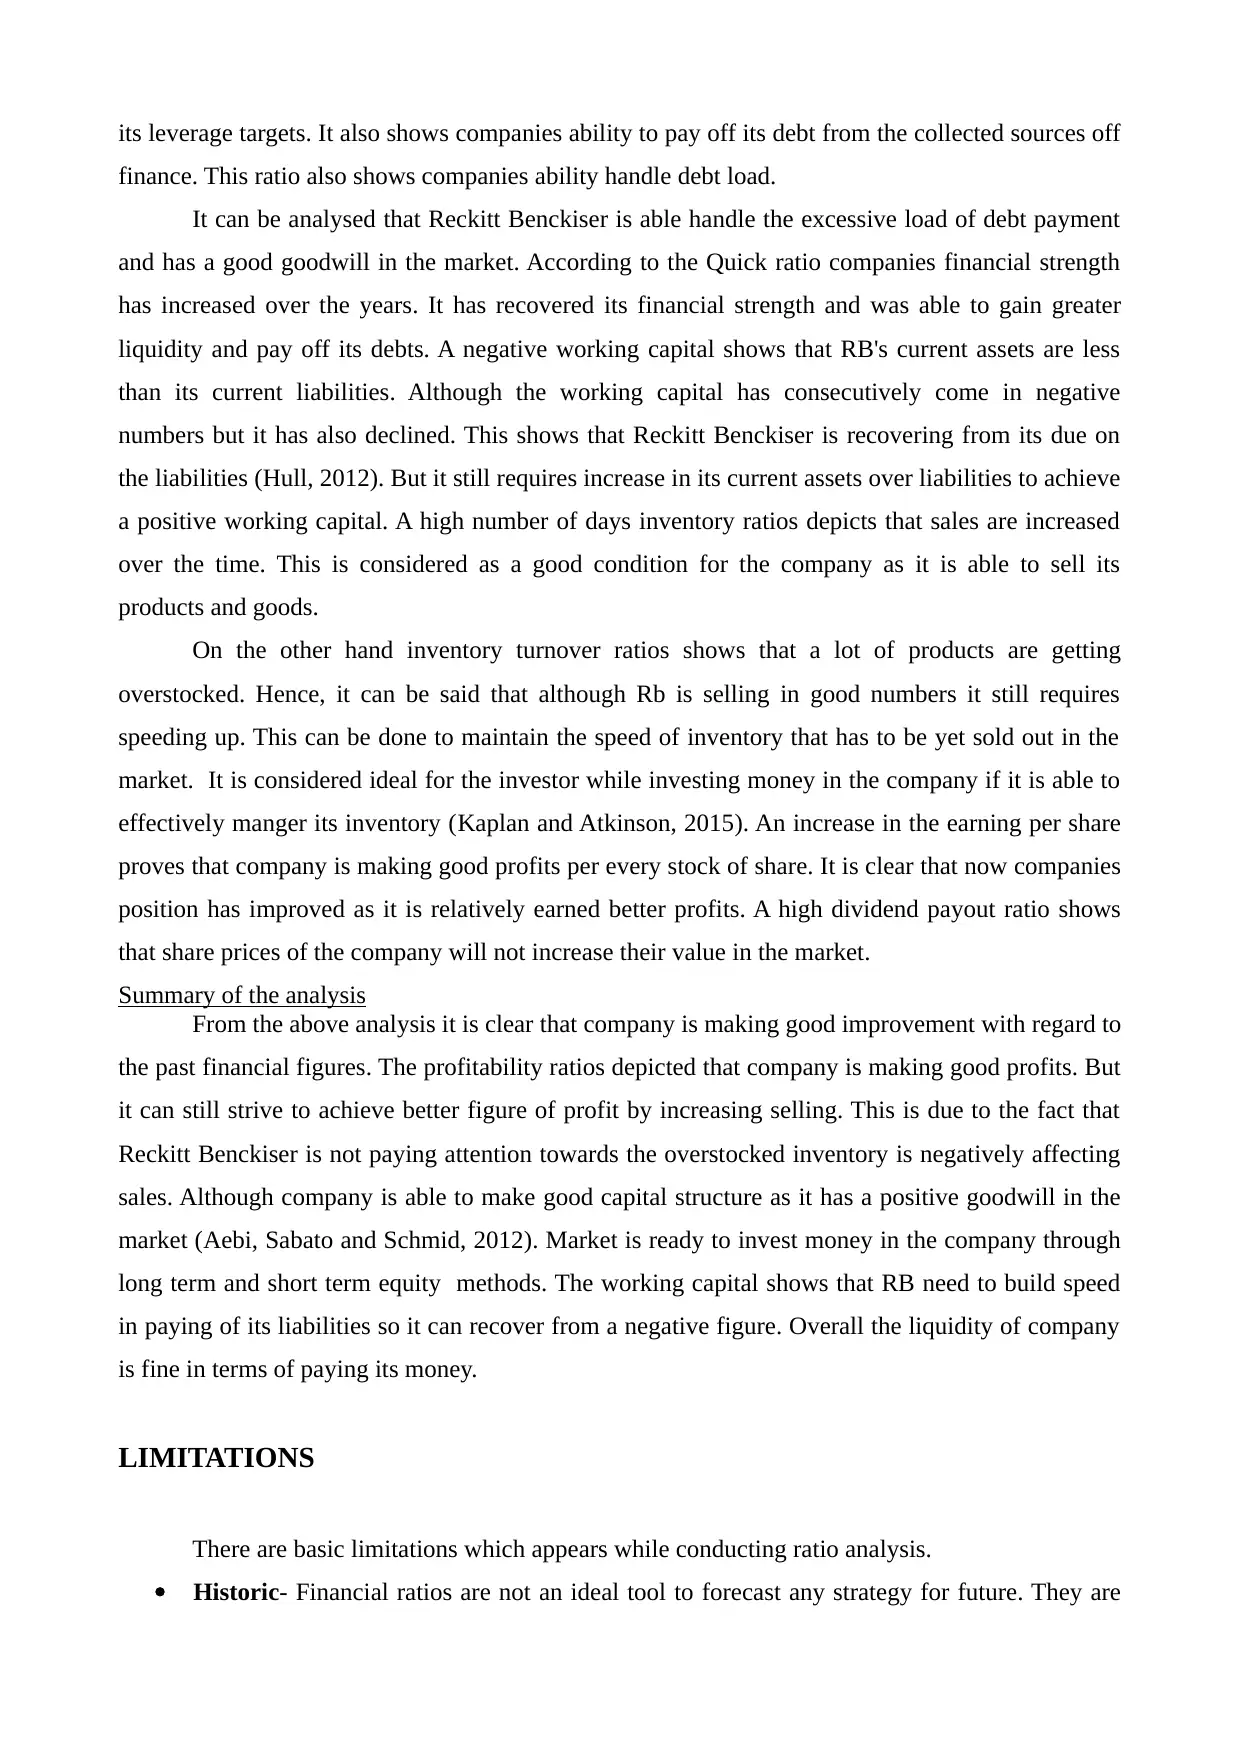
its leverage targets. It also shows companies ability to pay off its debt from the collected sources off
finance. This ratio also shows companies ability handle debt load.
It can be analysed that Reckitt Benckiser is able handle the excessive load of debt payment
and has a good goodwill in the market. According to the Quick ratio companies financial strength
has increased over the years. It has recovered its financial strength and was able to gain greater
liquidity and pay off its debts. A negative working capital shows that RB's current assets are less
than its current liabilities. Although the working capital has consecutively come in negative
numbers but it has also declined. This shows that Reckitt Benckiser is recovering from its due on
the liabilities (Hull, 2012). But it still requires increase in its current assets over liabilities to achieve
a positive working capital. A high number of days inventory ratios depicts that sales are increased
over the time. This is considered as a good condition for the company as it is able to sell its
products and goods.
On the other hand inventory turnover ratios shows that a lot of products are getting
overstocked. Hence, it can be said that although Rb is selling in good numbers it still requires
speeding up. This can be done to maintain the speed of inventory that has to be yet sold out in the
market. It is considered ideal for the investor while investing money in the company if it is able to
effectively manger its inventory (Kaplan and Atkinson, 2015). An increase in the earning per share
proves that company is making good profits per every stock of share. It is clear that now companies
position has improved as it is relatively earned better profits. A high dividend payout ratio shows
that share prices of the company will not increase their value in the market.
Summary of the analysis
From the above analysis it is clear that company is making good improvement with regard to
the past financial figures. The profitability ratios depicted that company is making good profits. But
it can still strive to achieve better figure of profit by increasing selling. This is due to the fact that
Reckitt Benckiser is not paying attention towards the overstocked inventory is negatively affecting
sales. Although company is able to make good capital structure as it has a positive goodwill in the
market (Aebi, Sabato and Schmid, 2012). Market is ready to invest money in the company through
long term and short term equity methods. The working capital shows that RB need to build speed
in paying of its liabilities so it can recover from a negative figure. Overall the liquidity of company
is fine in terms of paying its money.
LIMITATIONS
There are basic limitations which appears while conducting ratio analysis.
Historic- Financial ratios are not an ideal tool to forecast any strategy for future. They are
Paraphrase This Document
Need a fresh take? Get an instant paraphrase of this document with our AI Paraphraser
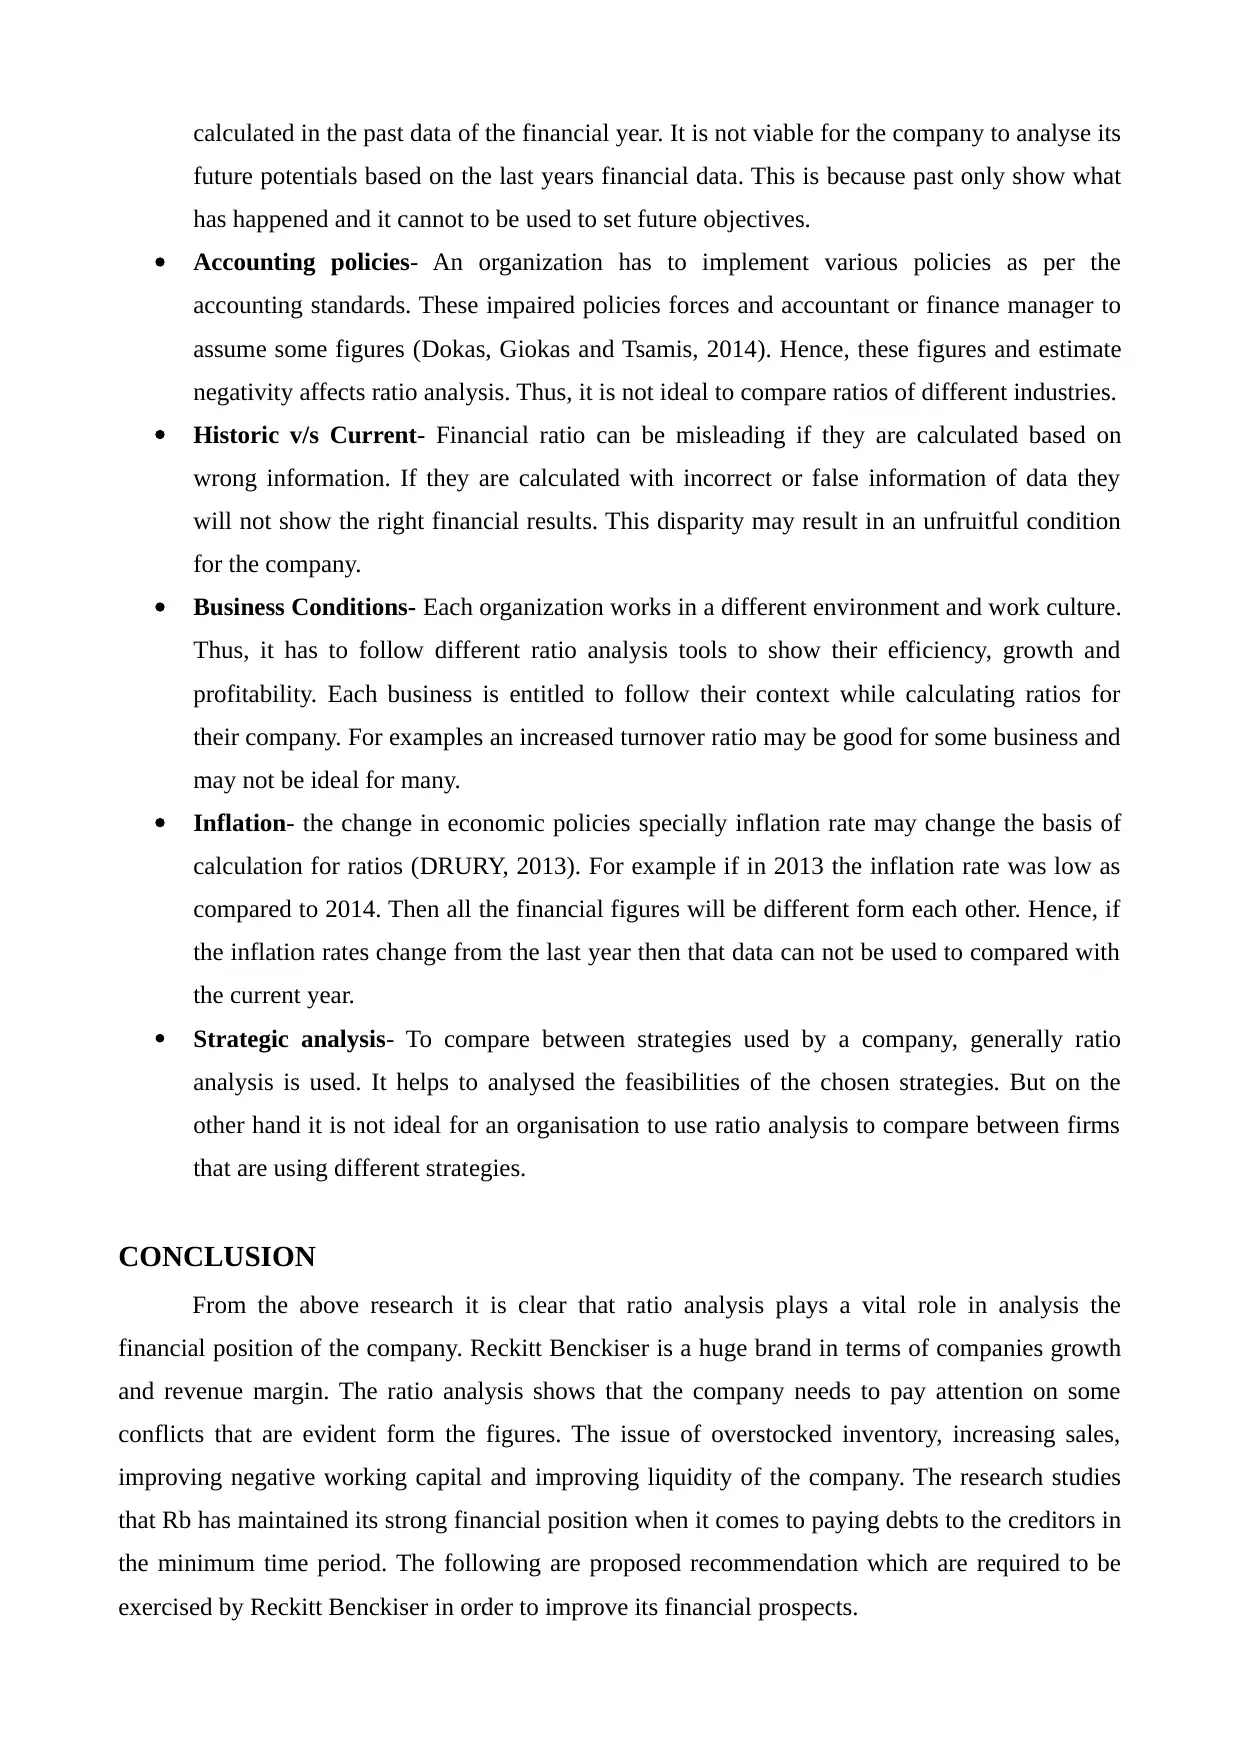
calculated in the past data of the financial year. It is not viable for the company to analyse its
future potentials based on the last years financial data. This is because past only show what
has happened and it cannot to be used to set future objectives.
Accounting policies- An organization has to implement various policies as per the
accounting standards. These impaired policies forces and accountant or finance manager to
assume some figures (Dokas, Giokas and Tsamis, 2014). Hence, these figures and estimate
negativity affects ratio analysis. Thus, it is not ideal to compare ratios of different industries.
Historic v/s Current- Financial ratio can be misleading if they are calculated based on
wrong information. If they are calculated with incorrect or false information of data they
will not show the right financial results. This disparity may result in an unfruitful condition
for the company.
Business Conditions- Each organization works in a different environment and work culture.
Thus, it has to follow different ratio analysis tools to show their efficiency, growth and
profitability. Each business is entitled to follow their context while calculating ratios for
their company. For examples an increased turnover ratio may be good for some business and
may not be ideal for many.
Inflation- the change in economic policies specially inflation rate may change the basis of
calculation for ratios (DRURY, 2013). For example if in 2013 the inflation rate was low as
compared to 2014. Then all the financial figures will be different form each other. Hence, if
the inflation rates change from the last year then that data can not be used to compared with
the current year.
Strategic analysis- To compare between strategies used by a company, generally ratio
analysis is used. It helps to analysed the feasibilities of the chosen strategies. But on the
other hand it is not ideal for an organisation to use ratio analysis to compare between firms
that are using different strategies.
CONCLUSION
From the above research it is clear that ratio analysis plays a vital role in analysis the
financial position of the company. Reckitt Benckiser is a huge brand in terms of companies growth
and revenue margin. The ratio analysis shows that the company needs to pay attention on some
conflicts that are evident form the figures. The issue of overstocked inventory, increasing sales,
improving negative working capital and improving liquidity of the company. The research studies
that Rb has maintained its strong financial position when it comes to paying debts to the creditors in
the minimum time period. The following are proposed recommendation which are required to be
exercised by Reckitt Benckiser in order to improve its financial prospects.
RECOMMENDATION
It is recommended for Reckitt Benckiser to the following.
Increase sale of inventory stocked- Reckitt Benckiser must pay attention to improve its
inventory which is getting overstocked. The personnels must aim to first sale all the stocked
goods before producing the new goods and services. This way there will more sales and less
wastage in terms of stocked inventory (Brigham and Ehrhardt, 2013). Discounts offers can
be provided to the consumers to lure them. If consumers are attracted more towards
purchasing there will be low chances of overstocked inventory.
Change the negative working capital- The organization have to consider alternative
methods to procure funds for the business. At many time's in shortage of funds company is
not able to conduct its operational prospects. On the other hand suppliers must be paid on
time as well (Hull, 2012). This way RB can negotiate better deals with suppliers and can
purchase raw materials at lowered prices. Management of cash flow must be done
effectively. Apart from this payment methods must be improved by initiating only cash sales
for the customers.
Improve liquidity position- this is very important for Reckitt Benckiser to improve its
liquidity position. Operating expense must be lowered so reduce cost of the products. This
way more profits can be incurred from the business. Business have to sell off those assets
which are of no use for the company (Uechi and et.al., 2015). By doing this it can liquidate
the value of assets in cash. Strategies must be formulated to increase profit making ability
of the company. Only more profits will generate revenue which will further improve
company financial capacities.
⊘ This is a preview!⊘
Do you want full access?
Subscribe today to unlock all pages.
Trusted by 1+ million students worldwide
REFERENCES
Books and Journal
Adrian, T. and Shin, H.S., 2014. Financial intermediary balance sheet management. In A Flow-of-
Funds Perspective on the Financial Crisis (pp. 177-202). Palgrave Macmillan UK.
Aebi, V., Sabato, G. and Schmid, M., 2012. Risk management, corporate governance, and bank
performance in the financial crisis. Journal of Banking & Finance, 36(12), pp.3213-3226.
Brigham, E. and Ehrhardt, M., 2013. Financial management: Theory & practice. Cengage
Learning.
Christoffersen, P.F., 2012. Elements of financial risk management. Academic Press.
Dokas, I., Giokas, D. and Tsamis, A., 2014. Liquidity efficiency in the Greek listed firms: a
financial ratio based on data envelopment analysis. International Journal of Corporate
Finance and Accounting (IJCFA), 1(1), pp.40-59.
DRURY, C.M., 2013. Management and cost accounting. Springer.
Hull, J., 2012. Risk Management and Financial Institutions,+ Web Site (Vol. 733). John Wiley &
Sons.Christoffersen, P.F., 2012. Elements of financial risk management. Academic Press.
Jarrow, R.A. and Chatterjea, A., 2013. An introduction to derivative securities, financial markets,
and risk management. WW Norton & Company.
Kaplan, R.S. and Atkinson, A.A., 2015. Advanced management accounting. PHI Learning.
Oikonomou, I., Brooks, C. and Pavelin, S., 2012. The impact of corporate social performance on
financial risk and utility: A longitudinal analysis. Financial Management, 41(2), pp.483-515.
Rose, P. and Hudgins, S., 2014. Bank Management & Financial Services, 9th.
Uechi, L. and et.al., 2015. Sector dominance ratio analysis of financial markets. Physica A:
Statistical Mechanics and its Applications, 421, pp.488-509.
Online
Reckitt Benckiser Group PLC. 2016. [Online]. Available through:
<http://financials.morningstar.com/ratios/r.html?t=RBGPF>. [Accessed on: 16th February, 2016].
1 out of 10
Related Documents


Your All-in-One AI-Powered Toolkit for Academic Success.
+13062052269
info@desklib.com
Available 24*7 on WhatsApp / Email
![[object Object]](/_next/static/media/star-bottom.7253800d.svg)
Unlock your academic potential
Copyright © 2020–2026 A2Z Services. All Rights Reserved. Developed and managed by ZUCOL.