Operations Analysis of Recycling Centre Corporation Report
VerifiedAdded on 2022/08/27
|16
|3941
|21
Report
AI Summary
This report provides a comprehensive operational analysis of Recycling Centre Corporation (RCC), focusing on the heavy-duty spreader plant and its impact on the company's financial performance. The analysis begins with a qualitative assessment of the plant's capacity, calculating its processing capabilities, annual revenue, production costs, and profit/loss. The report then delves into operations analysis, examining capacity management, waste generation, and the utilization of available running hours. A detailed financial analysis reveals that the company is currently operating at a loss, with production costs exceeding revenue. The report further explores customer requirements, highlighting the importance of quality, competitive pricing, and adherence to regulations. Finally, the report suggests strategic options for improving RCC's performance, including increasing capacity utilization, waste reduction, and a review of pricing strategies. The report concludes with recommendations for managerial actions to address the challenges identified and improve the company's profitability.
Supply Chain Operation 1
Supply Chain Operation
By [Name]
Course
Professor’s Name
Institution
Location Of Institution
Date
Supply Chain Operation
By [Name]
Course
Professor’s Name
Institution
Location Of Institution
Date
Paraphrase This Document
Need a fresh take? Get an instant paraphrase of this document with our AI Paraphraser
Supply Chain Operation 2
Contents
Executive Summary.............................................................................................................3
Introduction..........................................................................................................................4
Qualitative analysis of the heavy-duty spreader plant.........................................................4
Operations analysis..............................................................................................................6
Capacity Management.....................................................................................................6
Financial analysis.............................................................................................................8
Customer requirement Analysis......................................................................................9
Options for the strategic direction.....................................................................................10
Most Appropriate Managerial Actions..............................................................................12
Conclusion.........................................................................................................................13
References..........................................................................................................................14
Supply Chain Operation 3
Executive Summary
This report presents an operational analysis of a recycling center plant. The analysis is
presented in the form of a report to the RCC board. The report analyses the capacity and
profitability of the plant through qualitative analysis and goes ahead to further analyze the
operation from a qualitative perspective. The report analyses the current situation and presents an
analysis of possible managerial actions to take.
⊘ This is a preview!⊘
Do you want full access?
Subscribe today to unlock all pages.
Trusted by 1+ million students worldwide
Supply Chain Operation 4
Introduction
Recycling center Corporation is a public company that specializes in trading and
recycling of scrap metal. The management feels that the Earnings before interest and taxes
decrease in 2013 and 2014 as a result of low returns from metal recycling. The income from
metal recycling is majorly generated through the work done by a heavy-duty spreader and the
overall efficiency of the metal scrap recycling process.
PART A
Qualitative analysis of the heavy-duty spreader plant
Important data;
Process capacity of spreader = 70 tons per hour
Spreader output = 2150 Kw
Spreader running time = 52 weeks a year, 5 days a week, 11 hours a day.
a) The capacity of the heavy-duty spreader in ton per week.
Processing capacity = 70 tons per hour
Running time = 55hours per week * 52 weeks =2860 hours per year
Waiting time = 11hours * 52weeks = 572 hours per year.
Breakdown and other mechanical failures time = 3hours per week *52weeks =156 hours
per year
Total productive time =2860 – (572+156) = 2132 hours per year
Paraphrase This Document
Need a fresh take? Get an instant paraphrase of this document with our AI Paraphraser
Supply Chain Operation 5
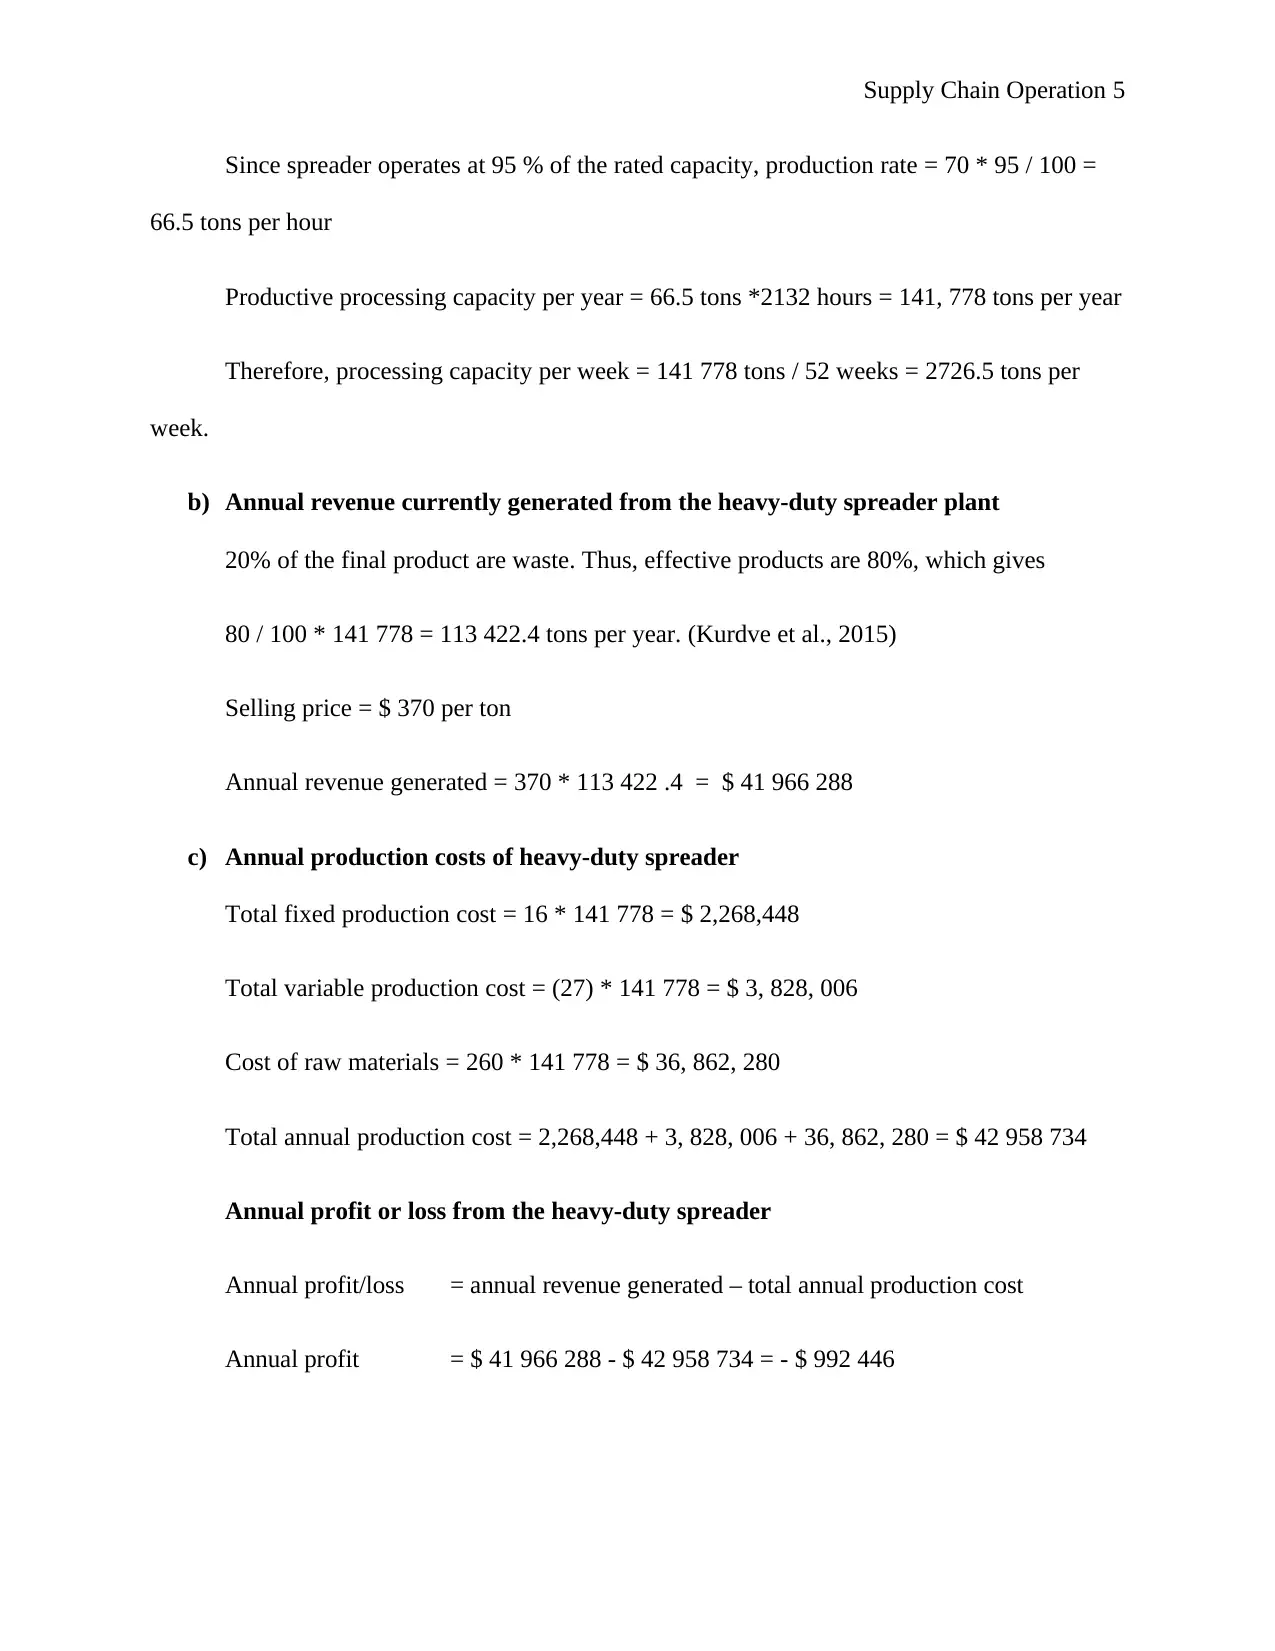
Since spreader operates at 95 % of the rated capacity, production rate = 70 * 95 / 100 =
66.5 tons per hour
Productive processing capacity per year = 66.5 tons *2132 hours = 141, 778 tons per year
Therefore, processing capacity per week = 141 778 tons / 52 weeks = 2726.5 tons per
week.
b) Annual revenue currently generated from the heavy-duty spreader plant
20% of the final product are waste. Thus, effective products are 80%, which gives
80 / 100 * 141 778 = 113 422.4 tons per year. (Kurdve et al., 2015)
Selling price = $ 370 per ton
Annual revenue generated = 370 * 113 422 .4 = $ 41 966 288
c) Annual production costs of heavy-duty spreader
Total fixed production cost = 16 * 141 778 = $ 2,268,448
Total variable production cost = (27) * 141 778 = $ 3, 828, 006
Cost of raw materials = 260 * 141 778 = $ 36, 862, 280
Total annual production cost = 2,268,448 + 3, 828, 006 + 36, 862, 280 = $ 42 958 734
Annual profit or loss from the heavy-duty spreader
Annual profit/loss = annual revenue generated – total annual production cost
Annual profit = $ 41 966 288 - $ 42 958 734 = - $ 992 446
Supply Chain Operation 6
PART B
Operations analysis
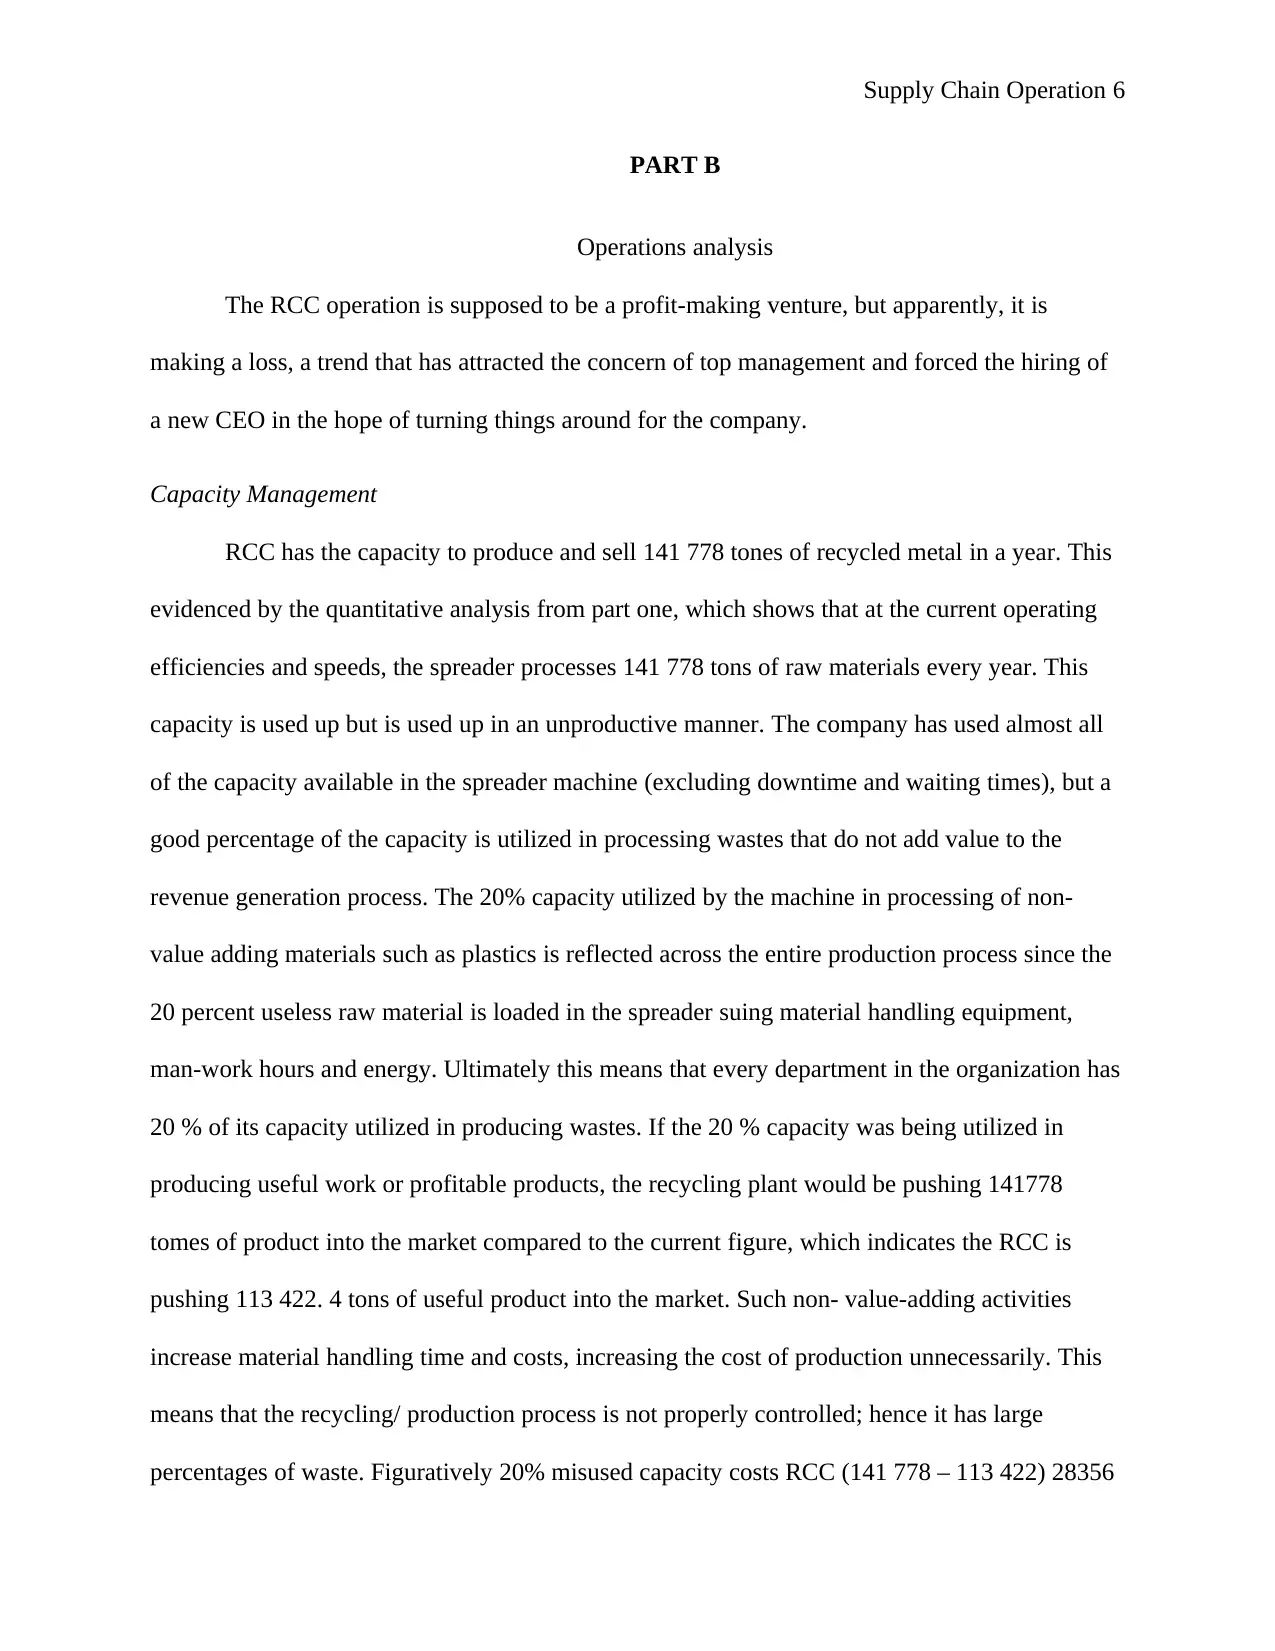
The RCC operation is supposed to be a profit-making venture, but apparently, it is
making a loss, a trend that has attracted the concern of top management and forced the hiring of
a new CEO in the hope of turning things around for the company.
Capacity Management
RCC has the capacity to produce and sell 141 778 tones of recycled metal in a year. This
evidenced by the quantitative analysis from part one, which shows that at the current operating
efficiencies and speeds, the spreader processes 141 778 tons of raw materials every year. This
capacity is used up but is used up in an unproductive manner. The company has used almost all
of the capacity available in the spreader machine (excluding downtime and waiting times), but a
good percentage of the capacity is utilized in processing wastes that do not add value to the
revenue generation process. The 20% capacity utilized by the machine in processing of non-
value adding materials such as plastics is reflected across the entire production process since the
20 percent useless raw material is loaded in the spreader suing material handling equipment,
man-work hours and energy. Ultimately this means that every department in the organization has
20 % of its capacity utilized in producing wastes. If the 20 % capacity was being utilized in
producing useful work or profitable products, the recycling plant would be pushing 141778
tomes of product into the market compared to the current figure, which indicates the RCC is
pushing 113 422. 4 tons of useful product into the market. Such non- value-adding activities
increase material handling time and costs, increasing the cost of production unnecessarily. This
means that the recycling/ production process is not properly controlled; hence it has large
percentages of waste. Figuratively 20% misused capacity costs RCC (141 778 – 113 422) 28356
PART B
Operations analysis
The RCC operation is supposed to be a profit-making venture, but apparently, it is
making a loss, a trend that has attracted the concern of top management and forced the hiring of
a new CEO in the hope of turning things around for the company.
Capacity Management
RCC has the capacity to produce and sell 141 778 tones of recycled metal in a year. This
evidenced by the quantitative analysis from part one, which shows that at the current operating
efficiencies and speeds, the spreader processes 141 778 tons of raw materials every year. This
capacity is used up but is used up in an unproductive manner. The company has used almost all
of the capacity available in the spreader machine (excluding downtime and waiting times), but a
good percentage of the capacity is utilized in processing wastes that do not add value to the
revenue generation process. The 20% capacity utilized by the machine in processing of non-
value adding materials such as plastics is reflected across the entire production process since the
20 percent useless raw material is loaded in the spreader suing material handling equipment,
man-work hours and energy. Ultimately this means that every department in the organization has
20 % of its capacity utilized in producing wastes. If the 20 % capacity was being utilized in
producing useful work or profitable products, the recycling plant would be pushing 141778
tomes of product into the market compared to the current figure, which indicates the RCC is
pushing 113 422. 4 tons of useful product into the market. Such non- value-adding activities
increase material handling time and costs, increasing the cost of production unnecessarily. This
means that the recycling/ production process is not properly controlled; hence it has large
percentages of waste. Figuratively 20% misused capacity costs RCC (141 778 – 113 422) 28356
⊘ This is a preview!⊘
Do you want full access?
Subscribe today to unlock all pages.
Trusted by 1+ million students worldwide
Supply Chain Operation 7
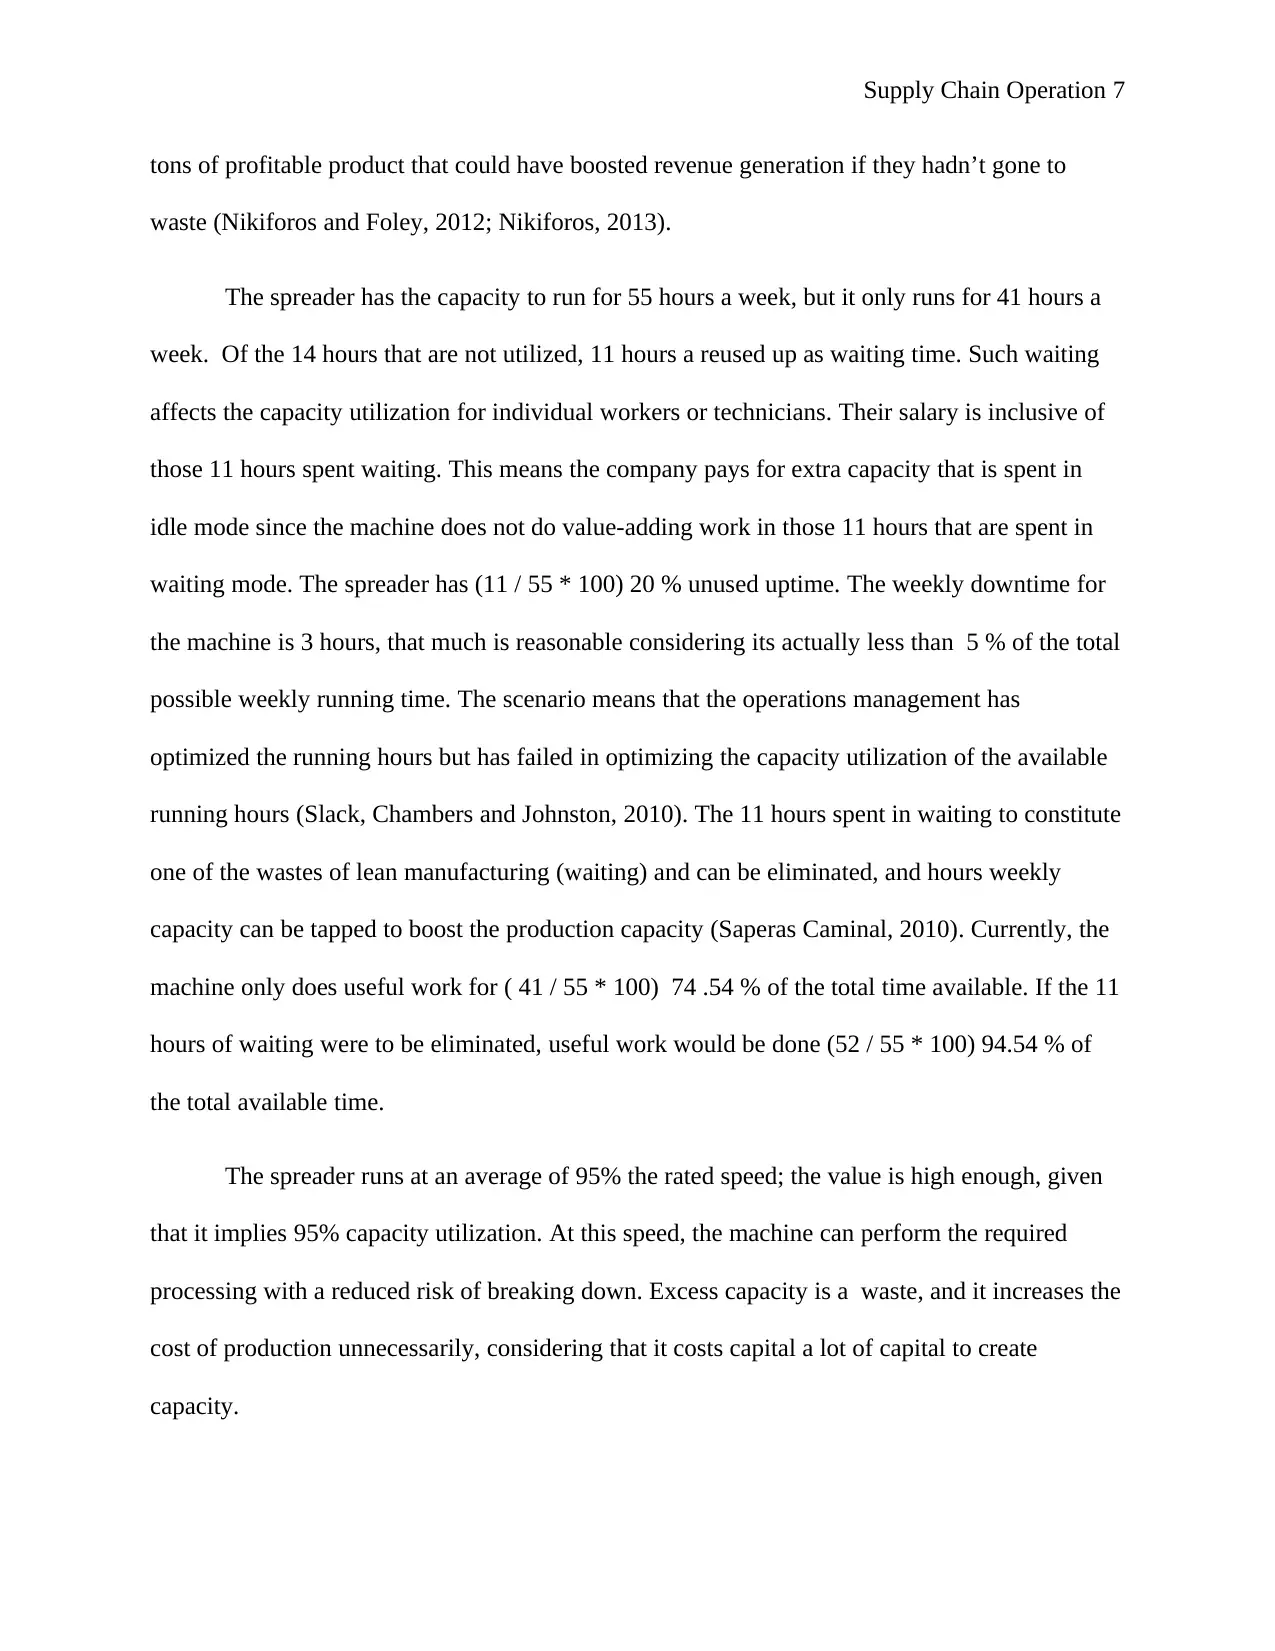
tons of profitable product that could have boosted revenue generation if they hadn’t gone to
waste (Nikiforos and Foley, 2012; Nikiforos, 2013).
The spreader has the capacity to run for 55 hours a week, but it only runs for 41 hours a
week. Of the 14 hours that are not utilized, 11 hours a reused up as waiting time. Such waiting
affects the capacity utilization for individual workers or technicians. Their salary is inclusive of
those 11 hours spent waiting. This means the company pays for extra capacity that is spent in
idle mode since the machine does not do value-adding work in those 11 hours that are spent in
waiting mode. The spreader has (11 / 55 * 100) 20 % unused uptime. The weekly downtime for
the machine is 3 hours, that much is reasonable considering its actually less than 5 % of the total
possible weekly running time. The scenario means that the operations management has
optimized the running hours but has failed in optimizing the capacity utilization of the available
running hours (Slack, Chambers and Johnston, 2010). The 11 hours spent in waiting to constitute
one of the wastes of lean manufacturing (waiting) and can be eliminated, and hours weekly
capacity can be tapped to boost the production capacity (Saperas Caminal, 2010). Currently, the
machine only does useful work for ( 41 / 55 * 100) 74 .54 % of the total time available. If the 11
hours of waiting were to be eliminated, useful work would be done (52 / 55 * 100) 94.54 % of
the total available time.
The spreader runs at an average of 95% the rated speed; the value is high enough, given
that it implies 95% capacity utilization. At this speed, the machine can perform the required
processing with a reduced risk of breaking down. Excess capacity is a waste, and it increases the
cost of production unnecessarily, considering that it costs capital a lot of capital to create
capacity.
Paraphrase This Document
Need a fresh take? Get an instant paraphrase of this document with our AI Paraphraser
Supply Chain Operation 8
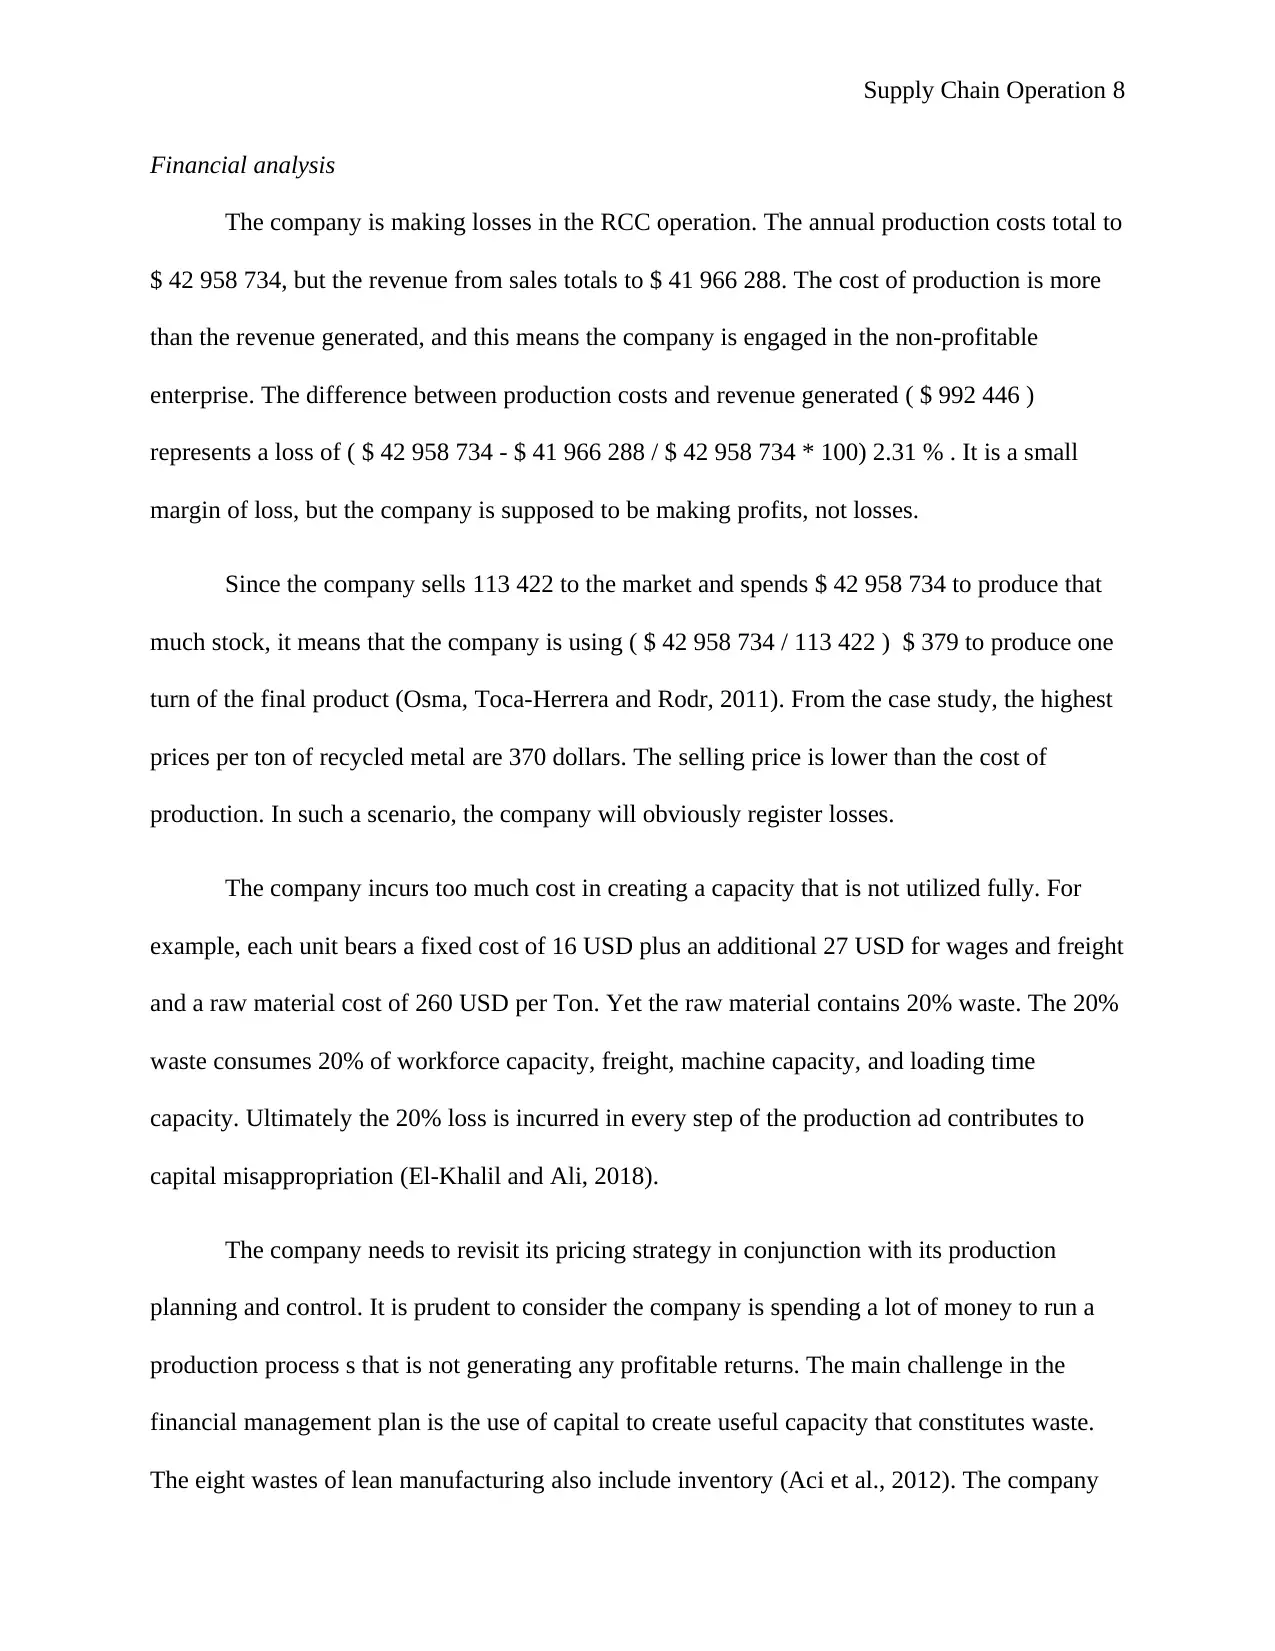
Financial analysis
The company is making losses in the RCC operation. The annual production costs total to
$ 42 958 734, but the revenue from sales totals to $ 41 966 288. The cost of production is more
than the revenue generated, and this means the company is engaged in the non-profitable
enterprise. The difference between production costs and revenue generated ( $ 992 446 )
represents a loss of ( $ 42 958 734 - $ 41 966 288 / $ 42 958 734 * 100) 2.31 % . It is a small
margin of loss, but the company is supposed to be making profits, not losses.
Since the company sells 113 422 to the market and spends $ 42 958 734 to produce that
much stock, it means that the company is using ( $ 42 958 734 / 113 422 ) $ 379 to produce one
turn of the final product (Osma, Toca-Herrera and Rodr, 2011). From the case study, the highest
prices per ton of recycled metal are 370 dollars. The selling price is lower than the cost of
production. In such a scenario, the company will obviously register losses.
The company incurs too much cost in creating a capacity that is not utilized fully. For
example, each unit bears a fixed cost of 16 USD plus an additional 27 USD for wages and freight
and a raw material cost of 260 USD per Ton. Yet the raw material contains 20% waste. The 20%
waste consumes 20% of workforce capacity, freight, machine capacity, and loading time
capacity. Ultimately the 20% loss is incurred in every step of the production ad contributes to
capital misappropriation (El-Khalil and Ali, 2018).
The company needs to revisit its pricing strategy in conjunction with its production
planning and control. It is prudent to consider the company is spending a lot of money to run a
production process s that is not generating any profitable returns. The main challenge in the
financial management plan is the use of capital to create useful capacity that constitutes waste.
The eight wastes of lean manufacturing also include inventory (Aci et al., 2012). The company
Supply Chain Operation 9
uses the money to purchase raw material, of which 20% ends up in the dustbin as waste. If this
money had been used to purchase useful raw material, it would steer the revenues in the right
direction. The company should set up expenditure guidelines to ensure that money is only spent
on value-adding processes; otherwise, it will continue making losses.
Customer requirement Analysis
RCC is a commodity-based industry; as such, its products are subject to price volatility
outside of the company’s control. The base prices for the products sold by RCC are determined
by commodity exchange brokers such as the Chicago Mercantile Exchange (COMEX), the
London Metal Exchange (LME), and the Shanghai Metal Exchange (SME). This Ultimately
mean s that the company has to offer its products at the prices that customers would be willing to
pay. These prices must be reasonably low. Otherwise, the customers will easily opt for freshly
processed metal rather than reprocessed metal. The company covers a range of products that
include ferrous scrap metal, non-ferrous crap, alternative scrap materials, and metals (both
secondary and primary) (Simpson, 2010). The pricing of thee commodities can easily be
influenced by factors beyond the metal recycling industry. In light of these factors, the customers
expect the company to adhere to pricing principles set out by both industry stakeholders and non-
industry stakeholders (Ji, 2010; Copenhagen business School, n.d.; Hilts et al., 2011).
The metal recycling process attracts the interest of other parties, such as environmental
regulatory bodies and municipal authorities (Graedel et al., 2011). In one way or the other, these
regulators are representing customers (Nahm, Ishikawa, and Inoue, 2013). The production
process is expected to conform to the environmental requirements governing the particular
region in which the factory is located. The company is also subject to scrap metal regulations
⊘ This is a preview!⊘
Do you want full access?
Subscribe today to unlock all pages.
Trusted by 1+ million students worldwide
Supply Chain Operation 10
Imposed by municipal squad teams (Bajare et al., 2012; Brooks, 2018). These regulations have
an impact on mobile and fixed scrap metal dealers to curb the circulation of stolen metal.
Despite the fact that customers purchase recycled metal, they always expect it to conform
to international standards in terms of quality strength, physical and chemical properties. This
means n that the RCC recycling process must be standardized and subjected to quality control
systems to ensure that all products fall within a certain range. In summary, customers of recycled
metal expect quality, friendly priced, and legally manufactured metal products, all of which
impose certain requirements on the product (Wang and Tseng, 2011).
Options for the strategic direction
The first strategy to be employed should be to increase the capacity utilization of the
spreader machine. The machine is idle for 11 hours every week; in a year, the machine loses 572
hours in idle state. These hours should be tapped and used to process an extra ( 65 * 572 ) 37180
tons of scrap metal. This means eliminating all idle time in between batches of scrap metal
processing or at least reducing it to a minimal value. In essence, this is the elimination of non-
value, adding processes from the material flow process.
Another strategy would be to improve the quality of the inputs to the recycling process.
The inputs determine the quantity and quality of the outputs. In the case of RCC, 20 % of the
input has no useful value and should be eliminated. The production planning team should ensure
that no machine capacity is wasted crashing and shredding plastics that are not useful in the scrap
metal production process. The idea behind this approach is to ensure that whatever the spreader
consumes energy to process is value adding to the final product. From the perspective of
Paraphrase This Document
Need a fresh take? Get an instant paraphrase of this document with our AI Paraphraser
Supply Chain Operation 11
inventory, this strategy is eliminating the handling of unnecessary inventory as a nonvalue
adding process.
Human resources are a key requirement in the production process. The main reason why
the spreader stays idle for 11 hours is that it takes the personnel a lot of time to load the machine.
In light of this, there is a need to mechanize the loading mechanisms. This can be done by using
conveyors from the scrap yard and increasing the number of technicians in the scrapyards to
keep the conveyor belts constantly full. With this arrangement, the spreader will have no
downtime and can run from 7 am7 am to 6 pm6 pm without stopping. Additional people will be
required to sort the supplied raw material before it is fed to the spreader. This will require
human resource management to reconsider its personnel strategy and either hire new technicians
or reassign some.
RCC can also change its sourcing strategy. Rather than acquire raw materials with 20%
wastes in volume/mass, the company can buy semi sorted raw material with a lower waste
percentage. This will see the company gain value for its monetary improvement and minimize
several wastes of lean such as inventory, excess capacity, and over-processing.
From the computational analysis, the company as been selling its products at 9 USD less
than the production cost per unit tone. This has greatly impacted the revenue structures. The
company should, therefore, consider its production cost to set a price for their products. A
compromise between profitable pricing and competitive pricing must be realized.
The company could also embark on the value addition process. Rather than trading in
plain reprocessed metal, the company can go the extra mile and form structure using the
reprocessed metal. Customers will give the specifics of their desired end product, and RCC will
Supply Chain Operation 12
make it for them then charge for both the recycling and structure creation. In so doing, more
revenue will be generated from value addition.
Most Appropriate Managerial Actions
There are a number of approaches that RCC can adopt to improve its operations.
Ansoff Matrix: Market Penetration- RCC can improve its operating efficiency by
increasing its capacity utilization. If the company operates at an overall efficiency of 95%, its
enterprise would automatically turn into a profit-making venture with the current resources. The
company can further cut on unnecessary costs like the cost of purchasing plastics embedded in
metal by buying pure metallic scrap. The expenditure incurred in the purchase of wastes
embedded in the raw material, yet it is accounted for as raw material incurs an unnecessary cost
that reduces financial efficiency (Schawel and Billing, 2011).
Ansoff matrix: Product Development- the company can introduce definite structures into
its product mix. Rather than just providing plane metal, RCC can supply its markets with more
complex structures, for example, rails, pots, hinges, doors, and such other products. This strategy
is more of adding value to an existing product than developing a new product (Kaplan Financial
Knowledge Bank, 2020).
Ansoff Matrix: Market Development:- the case study reveals that RCC generates
plastic waste. The are other companies that recycle plastics. RCC can partner with them to
become a supplier of waste plastic (Richard et al., 2011; Reck and Graedel, 2012; Raed and Ali,
n.d.). The company can also have a mobile industry for hire where it can operate at private sites
like construction sites to make metallic structures for individuals and companies on contract
labor and material basis. Since the company also requires scrap metal, it can offer demolition
⊘ This is a preview!⊘
Do you want full access?
Subscribe today to unlock all pages.
Trusted by 1+ million students worldwide
1 out of 16
Related Documents


Your All-in-One AI-Powered Toolkit for Academic Success.
+13062052269
info@desklib.com
Available 24*7 on WhatsApp / Email
![[object Object]](/_next/static/media/star-bottom.7253800d.svg)
Unlock your academic potential
Copyright © 2020–2026 A2Z Services. All Rights Reserved. Developed and managed by ZUCOL.