FIN600/FINA6017 Financial Management Report: REA Group Ltd Performance

Verified

Added on  2022/12/15

|8
|1961
|365
Report
AI Summary
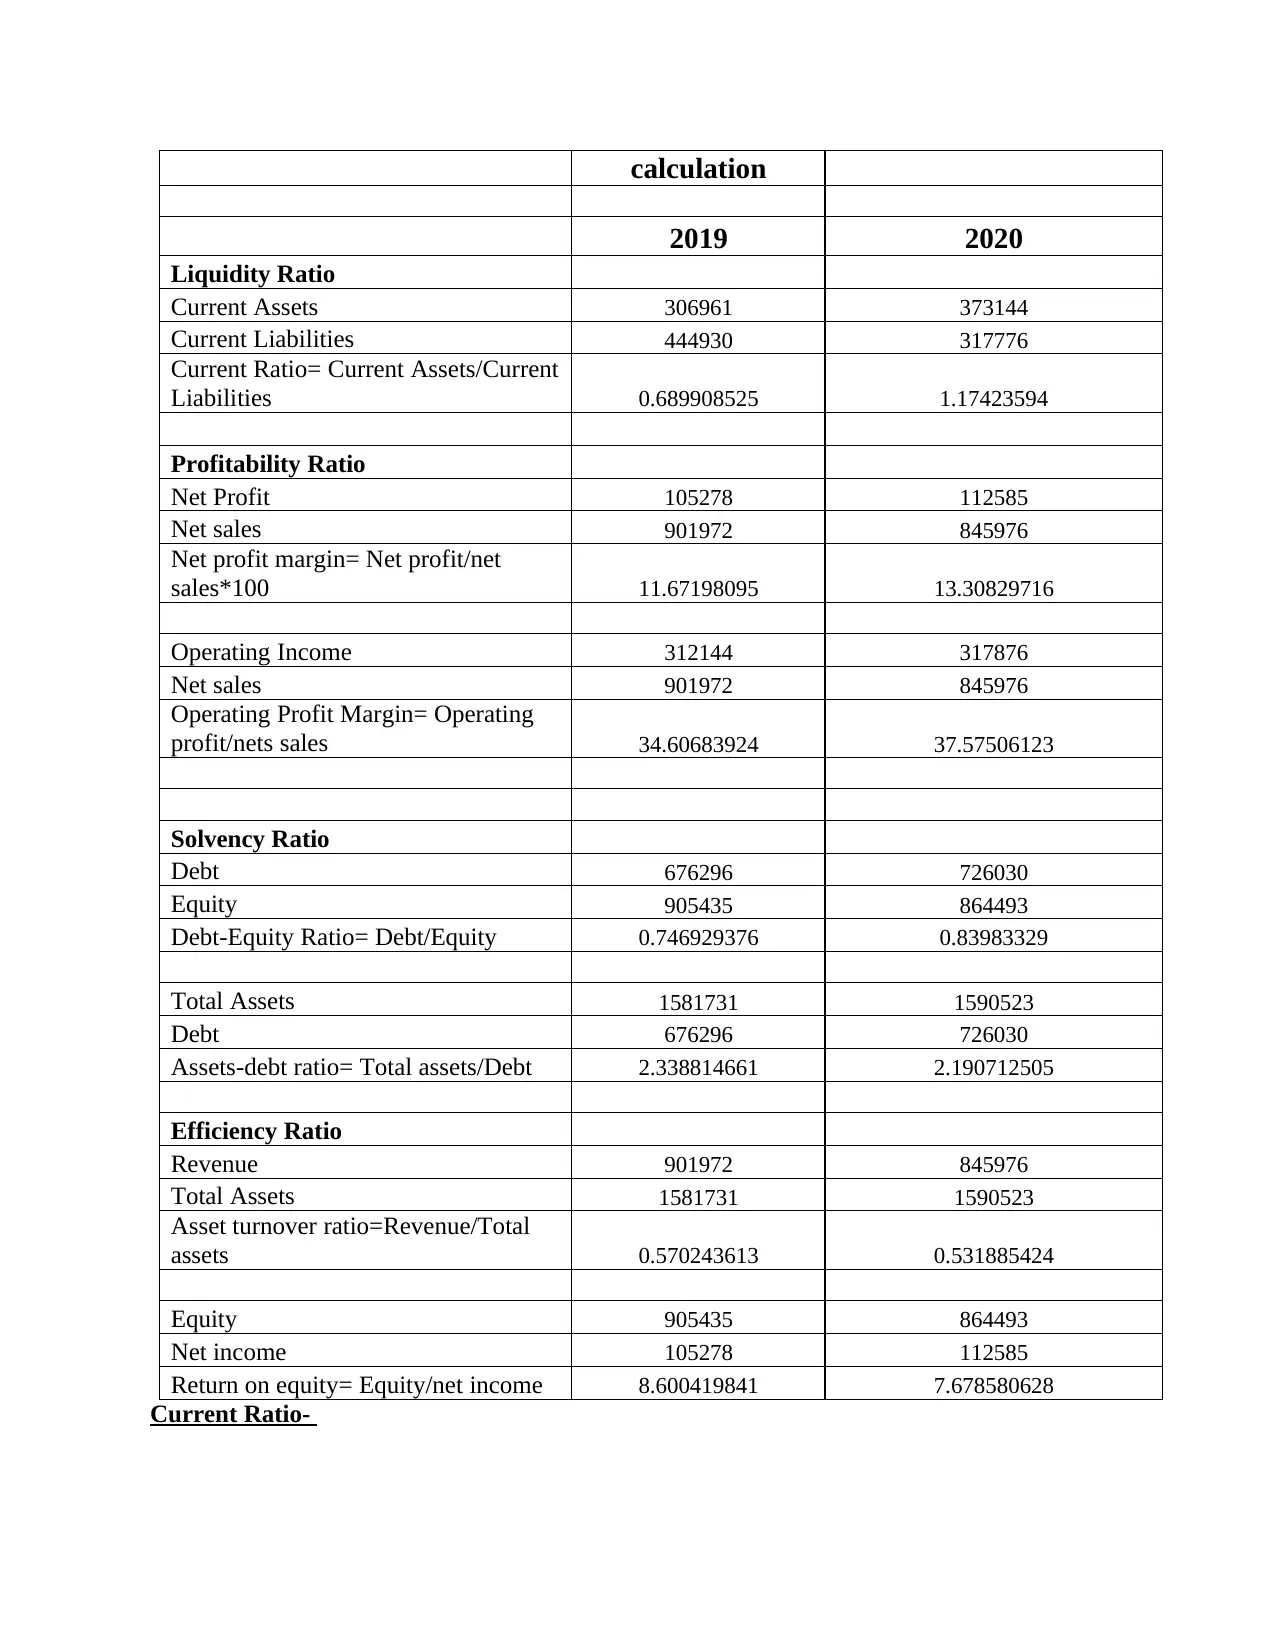
This report provides a comprehensive analysis of the financial management of REA Group Ltd. It begins with an introduction to financial management principles and the objectives of financial management within a company. The report then delves into the specifics of REA Group Ltd, a real estate company, discussing its background, operations, and financial performance. The core of the report focuses on ratio analysis, including liquidity, profitability, solvency, and efficiency ratios. Each ratio is calculated and analyzed for the years 2019 and 2020, with interpretations and comparisons to industry standards. The analysis covers current ratio, net profit margin, operating profit margin, debt-equity ratio, asset-debt ratio, asset turnover ratio, and return on equity. The report concludes with an overall assessment of REA Group Ltd's financial performance, highlighting strengths and weaknesses, and offering recommendations for improvement. The report is based on the company's financial statements and provides insights into the company's ability to manage its finances effectively and its potential for future growth. The report is intended to provide insights into financial performance and is suitable for students and analysts.
Document Page
Financial Management
tabler-icon-diamond-filled.svg

Paraphrase This Document

Need a fresh take? Get an instant paraphrase of this document with our AI Paraphraser
Document Page
Table of Contents
Introduction.................................................................................................................................................3
Ratio Analysis-............................................................................................................................................4
Conclusion-.................................................................................................................................................6
References-..................................................................................................................................................7
Document Page
Introduction-
This report is based on financial management of REA group Ltd. Financial management plays
an important role in managing business. It means planning, controlling, directing and organizing
financial activities. Objectives of financial management are as follows-
It maintains supply of funds for the company.
Ensures that investors are getting good return on their investments.
Funds should be utilized efficiently.
Company should create real and safe investment options.
Financial management department of a company is handled by its financial manager. Financial
management department works on various functions-
Financial manager needs to calculate the requirement of funds. It depends upon the
company’s policies related to profits and expenses.
After estimation of requirement of funds, formation of capital structure needs to be done.
It includes debt equity analysis in both long and short term.
Financial manager invest firm’s money in safe and beneficial ventures in order to raise
funds.
After earning good amount of net profit, financial manager allocate it efficiently.
This department is also responsible to efficiently manage firm’s money like- payments
and salaries.
Financial manager is also responsible for controlling and analyzing firm’s money.
REA group is a real estate company. It is founded in 1995 by Owen Wilson and headquartered in
Melbourne, Australia. It is a public company which is listed on Australian stock exchange. It is
owned by new corp. Australia and had revenue of $820.3 million in fiscal year20. Company
operates property websites in 10 countries and it is used by over 19000 agents and has 8.8
million visitors per month. Company announced its first acquisition in Asia on 11th September
2007. REA group acquired UK property shop in July, 2008.
Ratio Analysis-
REA ratio
Document Page
calculation
2019 2020
Liquidity Ratio
Current Assets 306961 373144
Current Liabilities 444930 317776
Current Ratio= Current Assets/Current
Liabilities 0.689908525 1.17423594
Profitability Ratio
Net Profit 105278 112585
Net sales 901972 845976
Net profit margin= Net profit/net
sales*100 11.67198095 13.30829716
Operating Income 312144 317876
Net sales 901972 845976
Operating Profit Margin= Operating
profit/nets sales 34.60683924 37.57506123
Solvency Ratio
Debt 676296 726030
Equity 905435 864493
Debt-Equity Ratio= Debt/Equity 0.746929376 0.83983329
Total Assets 1581731 1590523
Debt 676296 726030
Assets-debt ratio= Total assets/Debt 2.338814661 2.190712505
Efficiency Ratio
Revenue 901972 845976
Total Assets 1581731 1590523
Asset turnover ratio=Revenue/Total
assets 0.570243613 0.531885424
Equity 905435 864493
Net income 105278 112585
Return on equity= Equity/net income 8.600419841 7.678580628
Current Ratio-
tabler-icon-diamond-filled.svg

Paraphrase This Document

Need a fresh take? Get an instant paraphrase of this document with our AI Paraphraser
Document Page
Current ratio is a liquidity ratio. It gives information about company’s ability to meet its short-
term obligations. Current ratio can be calculated by dividing current assets and current liabilities.
Ideal current ratio lies between 1.5 to 2. If current ratio is less than 1 it means company will be
facing difficulties in paying its short term obligations. If current ratio is greater than 2 then it can
be said that company is not able to manage its funds properly.
As mentioned in the above table, current ratio in the year 2019 is only 0.68 which is less than 1.
It says that company faced problems in meeting its short term obligations. On the other hand, in
the year 2020 current ratio is 1.17. It is greater than1 so company did not face any problems in
paying off short term obligations.
Like current ratio there are two more liquidity ratios which are quick ratio and cash ratio. Quick
ratio tells about company’s liquidity with its most liquid assets.
Net Profit Margin-
Net profit margin is defined as net profit generated by company in relation to its sales. Net profit
margin of 10% is considered as average margin. 5% of net profit margin as poor and 20% net
profit margin is considered as good.
Net profit margin can be calculated as->Net profit/Revenue*100
It can be analyzed from above table that in 2019 net profit margin was around 11.60 and in 2020
it is increased and becomes 13.30. Increase in net profit margin clearly shows that company
performed better than previous year. Profit generated from its revenue is increased. Hence, it can
be said that overall performance of the company is good but still company needs to work more
on increasing its net profit margin and should reach to the threshold of 20%.
Operating Profit Margin-
It is a profitability ratio. It tell the profit percentage company earns from its operations before
subtracting taxes and interest charges. It can be calculated by dividing operating income by
revenue. Operating profit margin is different from net profit margin as a measure of company’s
ability to be profitable. It shows how efficiently a company can manage its expenses so as to
Document Page
maximize its profitability. Operating profit margin can be calculated as- Operating
income/revenue*100
REA Company’s operating profit margin is more than expected. Hence, it can be said that
company is managing its operating expenses properly.
Debt-Equity Ratio-
It is a solvency ratio. It is used to evaluate company’s leverage. It tells how much percentage of
debt and equity company is using in financing its operations. Ideal debt to equity ratio is 1:1.
Debt to equity ratio can be calculated by dividing total liabilities by shareholder’s equity. It is a
type of gearing ratio. It is difficult to compare across industries where ideal amounts of debts
will vary.
Information regarding debt to equity ratio can be found in balance sheet of the company. Debt to
equity ratio should not be higher than two. If company has debt to ratio higher than two then it
means company is financing its growth with debt.
In can of REA group debt to equity ratio in both the years is less than one which is good sign. In
2019 it is 0.74 and in 2020 it is 0.84. In 2020 company has more liabilities when compared to
2019.
Asset-Debt ratio-
It is interpreted as the proportion of company’s assets that are financed by asset. Ratio greater
than one shows that considerable portion of debt is funded by assets. Debt ratio can be calculated
as- Total assets/debt
Calculation considers company’s all debt not just loans and bonds payable and including all the
assets (intangible assets also).
From the above table it can be figured out that company is using its debts in order to fund its
assets. In the year 2019 ratio was 2.33 and in 2020 it was 2.19.
Asset Turnover Ratio-
Document Page
It is an efficiency ratio. Company uses this ratio to check that how efficiently company is using
its assets in order to generate sales. An asset turnover ratio between 0.25 and 0.5 is considered as
good. Investors use asset turnover ratio to compare companies of same industry or group.
Company’s turnover ratio can be impacted by large asset sales as well as significant asset
purchases in a given year. Higher the asset turnover ratio, the better the company is performing.
Company’s asset turnover ratio in both the year is good. In 2019 it is 0.57 and 0.53. It is quite
near to ideal ratio. It means company is handling its assets in order to generate sales.
Return on equity-
Financial performance of the company is measured with the help of return on equity. It measures
profitability of the company in relation to the shareholder’s equity. If return on equity is higher,
then it boosts investor’s confidence. Higher ROE attracts investors. 14% return on equity
considered as acceptable ratio and anything less than 10% is considered as poor. Return on
equity can be calculated by dividing the shareholder’s equity by net income.
Company’s return on equity in both years is not up to the mark. In 2019 it was 8.6 and in 2020 it
is just 7.6. It means company is not able to keep its investors happy and not giving good returns
to the investors.
Conclusion-
From the above report, it can be concluded that financial management of the company can be
done by the ratio. Financial ratios give information about the performance of the company.
Financial management is the key of business growth. If company manage its financials in proper
way then it becomes easy for company to grow. Ratio analysis gives insights to financial analyst
about company’s performance. It gives information whether company is managing its funds
properly or not. It gives answer of many questions like what are the requirements of company.
Company’s performance in the year 2020 was average. Company’s current ratio is higher than
previous year. Net profit margin and operating profit margin of the company is also higher. On
the other hand, debt to equity ratio is slightly higher than previous year. It means company has
more liabilities than assets.
tabler-icon-diamond-filled.svg

Paraphrase This Document

Need a fresh take? Get an instant paraphrase of this document with our AI Paraphraser
Document Page
Return on equity of the company is also poor. Company should attract investors in order to raise
more funds. Company is using its assets properly in order to generate sales. But most of the
assets of the company are funded by debt. Company needs to focus on its assets and should
decrease liabilities. Company’s net profit margin is good but company should focus on
increasing its assets. Assets should not be funded by debt. After analyzing all the ratios it can be
concluded that company’s overall performance is average.
References-
Pringle, J.J. and Solomon, E., 1980. An introduction to financial management. Santa
Monica, Calif.: Goodyear Publishing Company.
Grable, J.E., Park, J.Y. and Joo, S.H., 2009. Explaining financial management behavior
for Koreans living in the United States. Journal of Consumer Affairs, 43(1), pp.80-107.
Gundersen, C.G. and Garasky, S.B., 2012. Financial management skills are associated
with food insecurity in a sample of households with children in the United States. The
Journal of nutrition, 142(10), pp.1865-1870.
Falahati, L. and Paim, L.H., 2011. Toward a framework of determinants of financial
management and financial problems among university students. African Journal of
Business Management, 5(22), pp.9600-9606.
Abanis, T., Sunday, A., Burani, A. and Eliabu, B., 2013. Financial Management Practices
In Small And Medium Enterprises in Selected Districts In Western Uganda.
John, K., 1993. Managing financial distress and valuing distressed securities: A survey
and a research agenda. Financial Management, pp.60-78.
Pringle, J.J. and Solomon, E., 1980. An introduction to financial management. Santa
Monica, Calif.: Goodyear Publishing Company.
Brigham, E.F. and Houston, J.F., 2021. Fundamentals of financial management. Cengage
Learning.
chevron_up_icon
1 out of 8
circle_padding
hide_on_mobile
zoom_out_icon
[object Object]