Investigating Reaction Time: A Lab Report on Age & Gender (20-60)

Verified

Added on  2023/04/23

|12
|2073
|439
Report
AI Summary
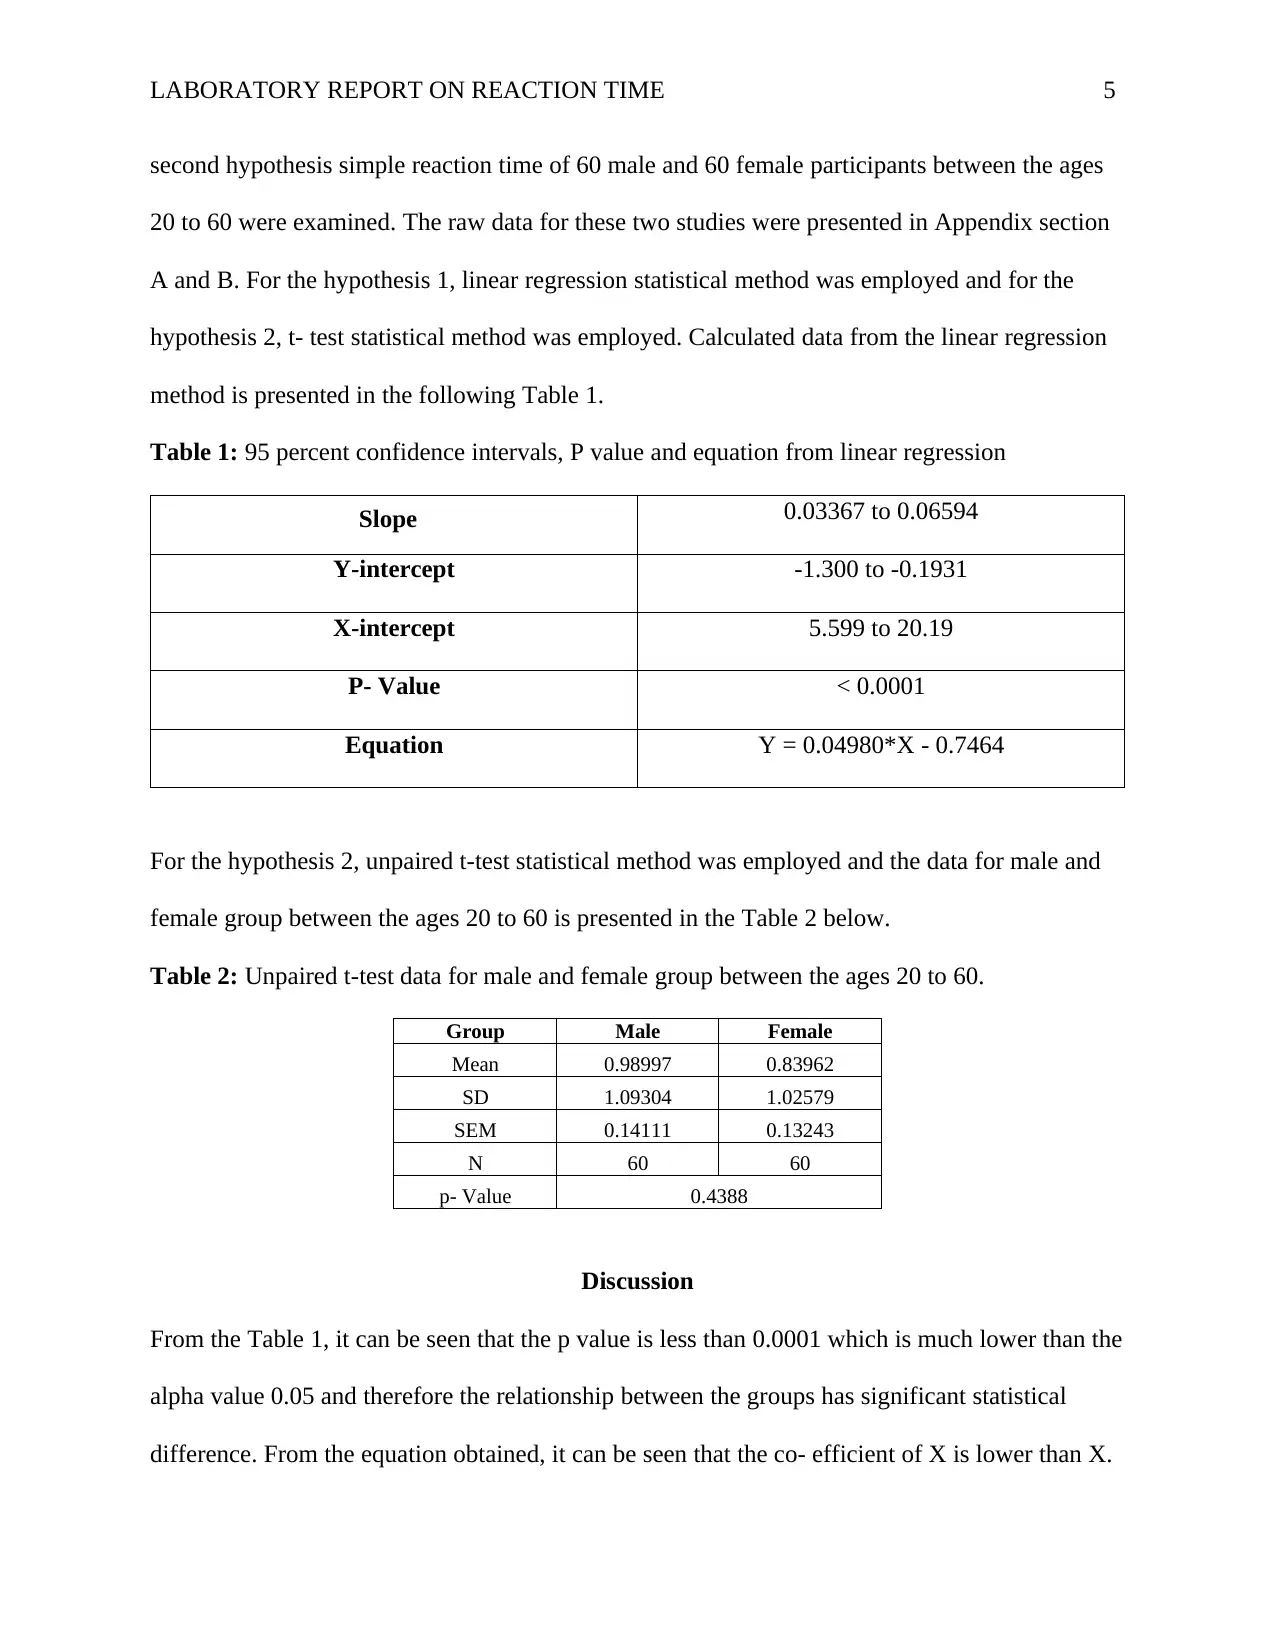
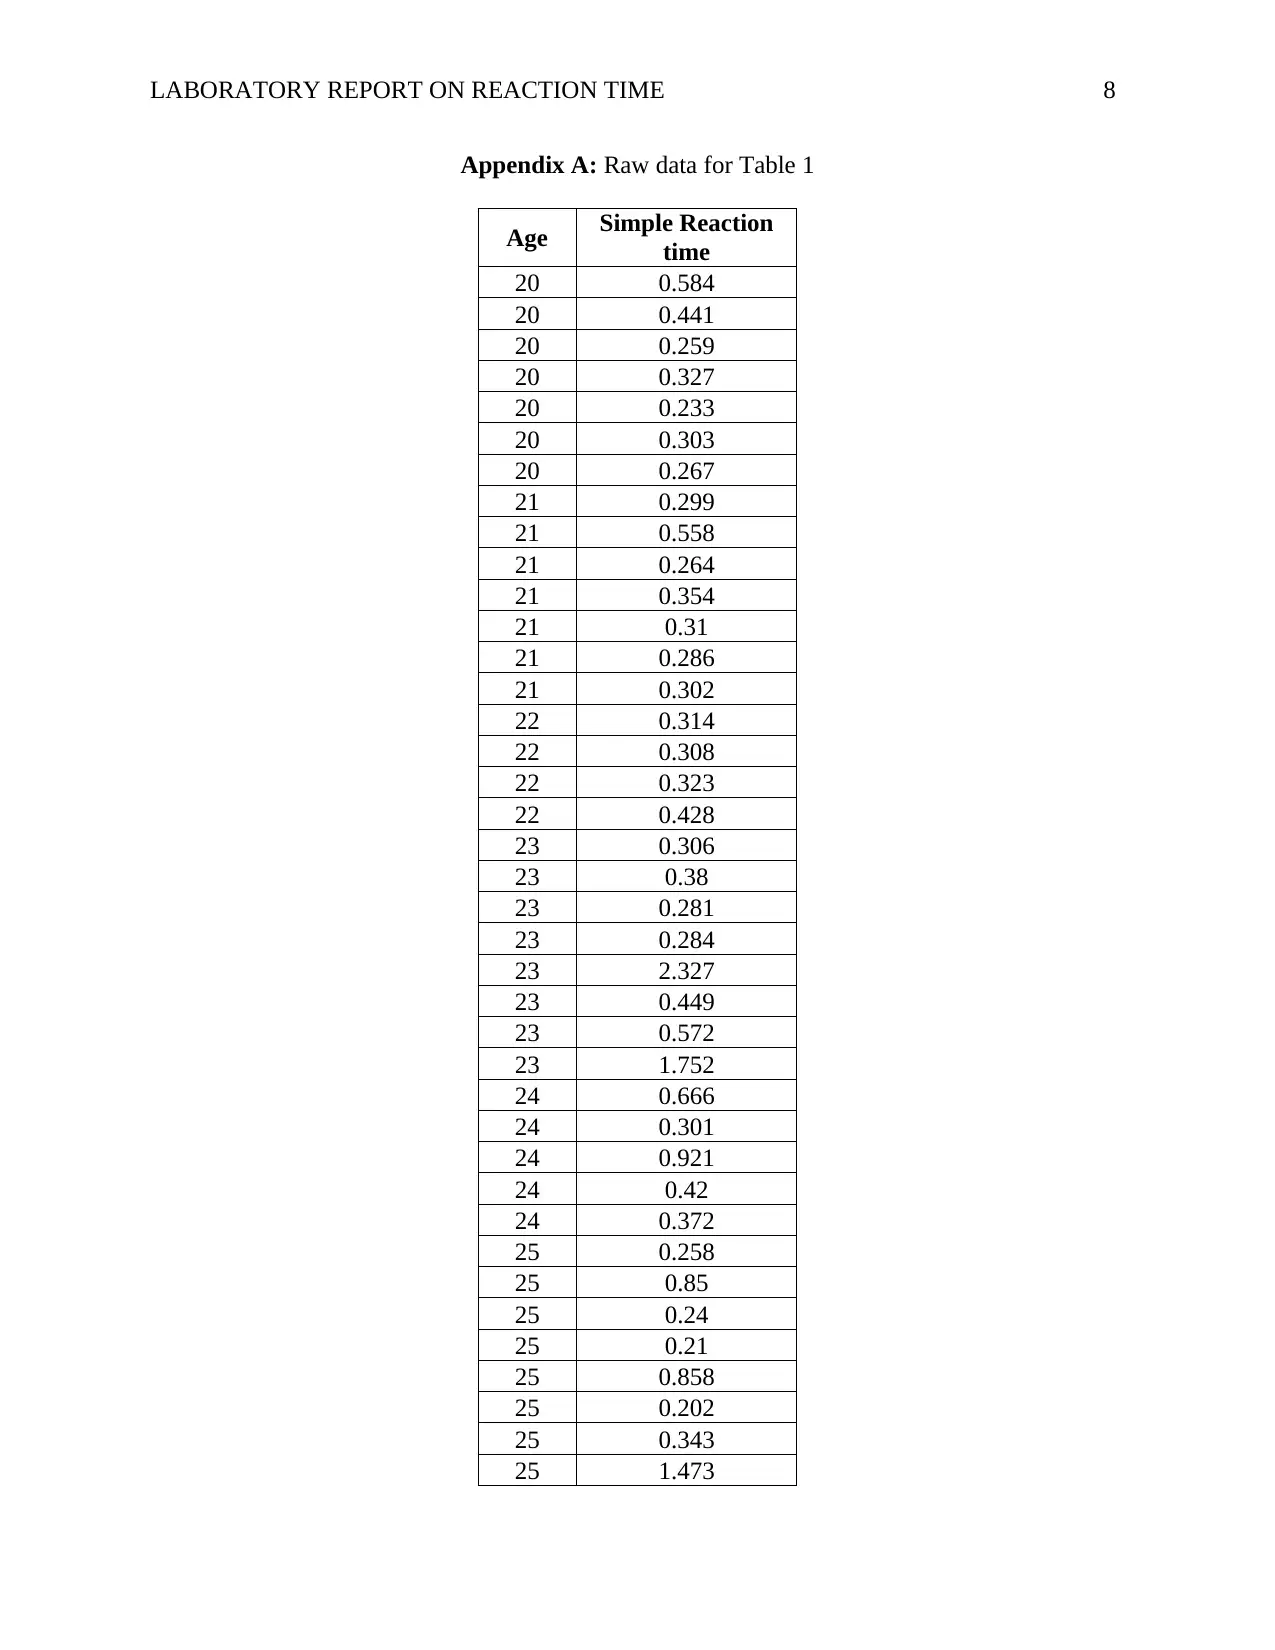
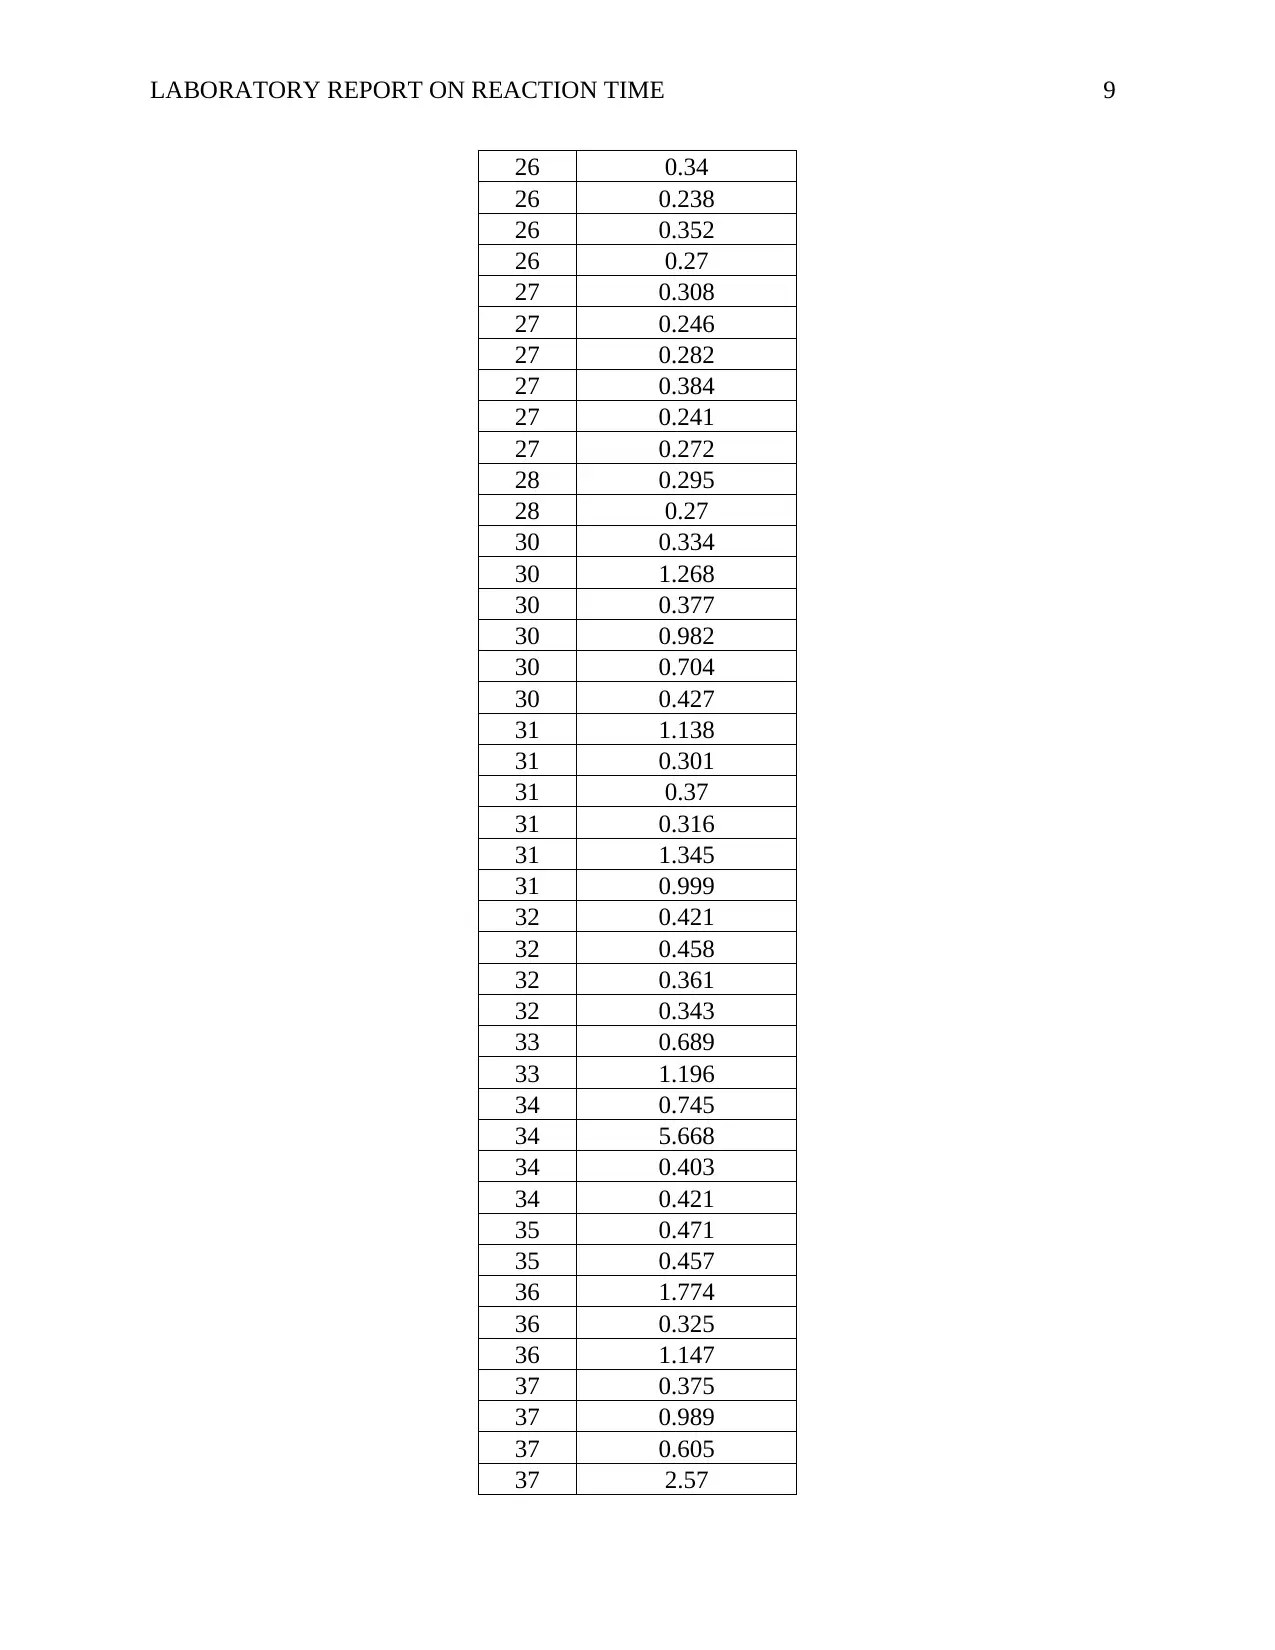
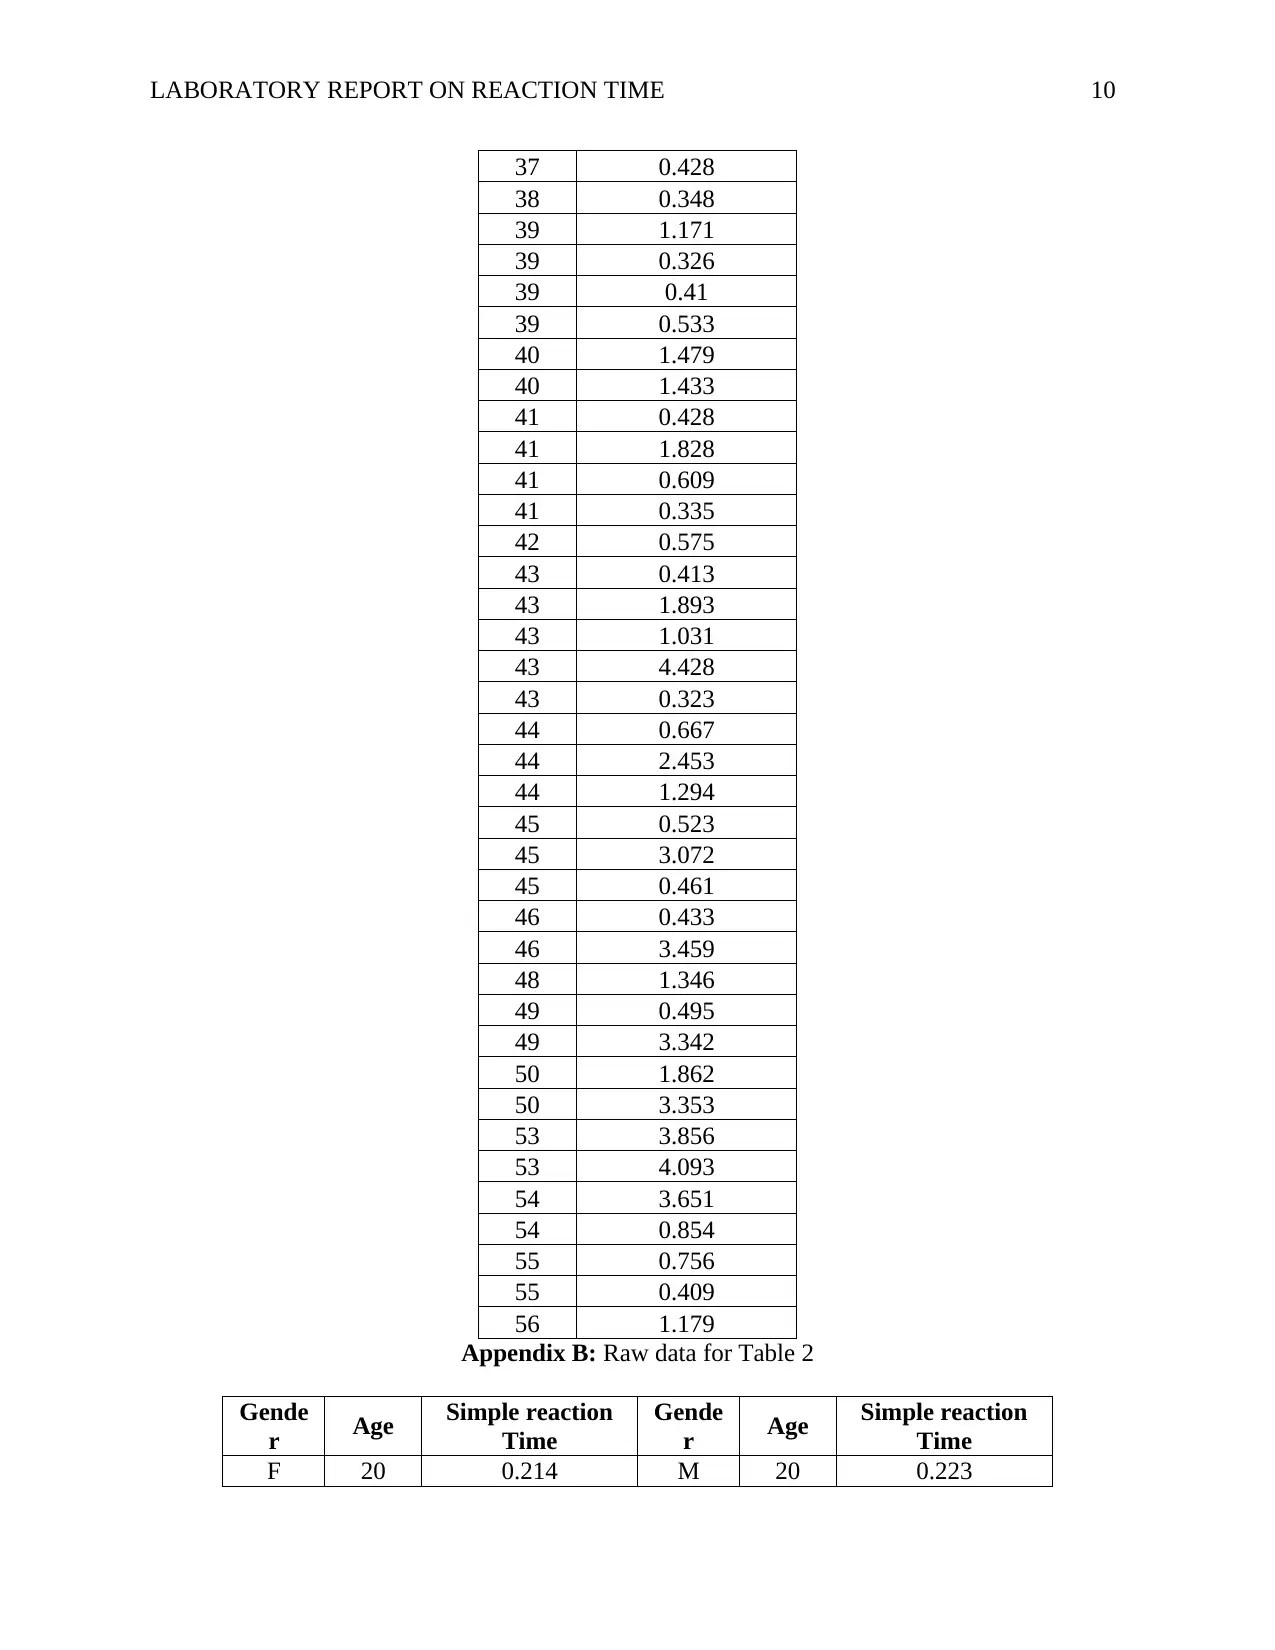
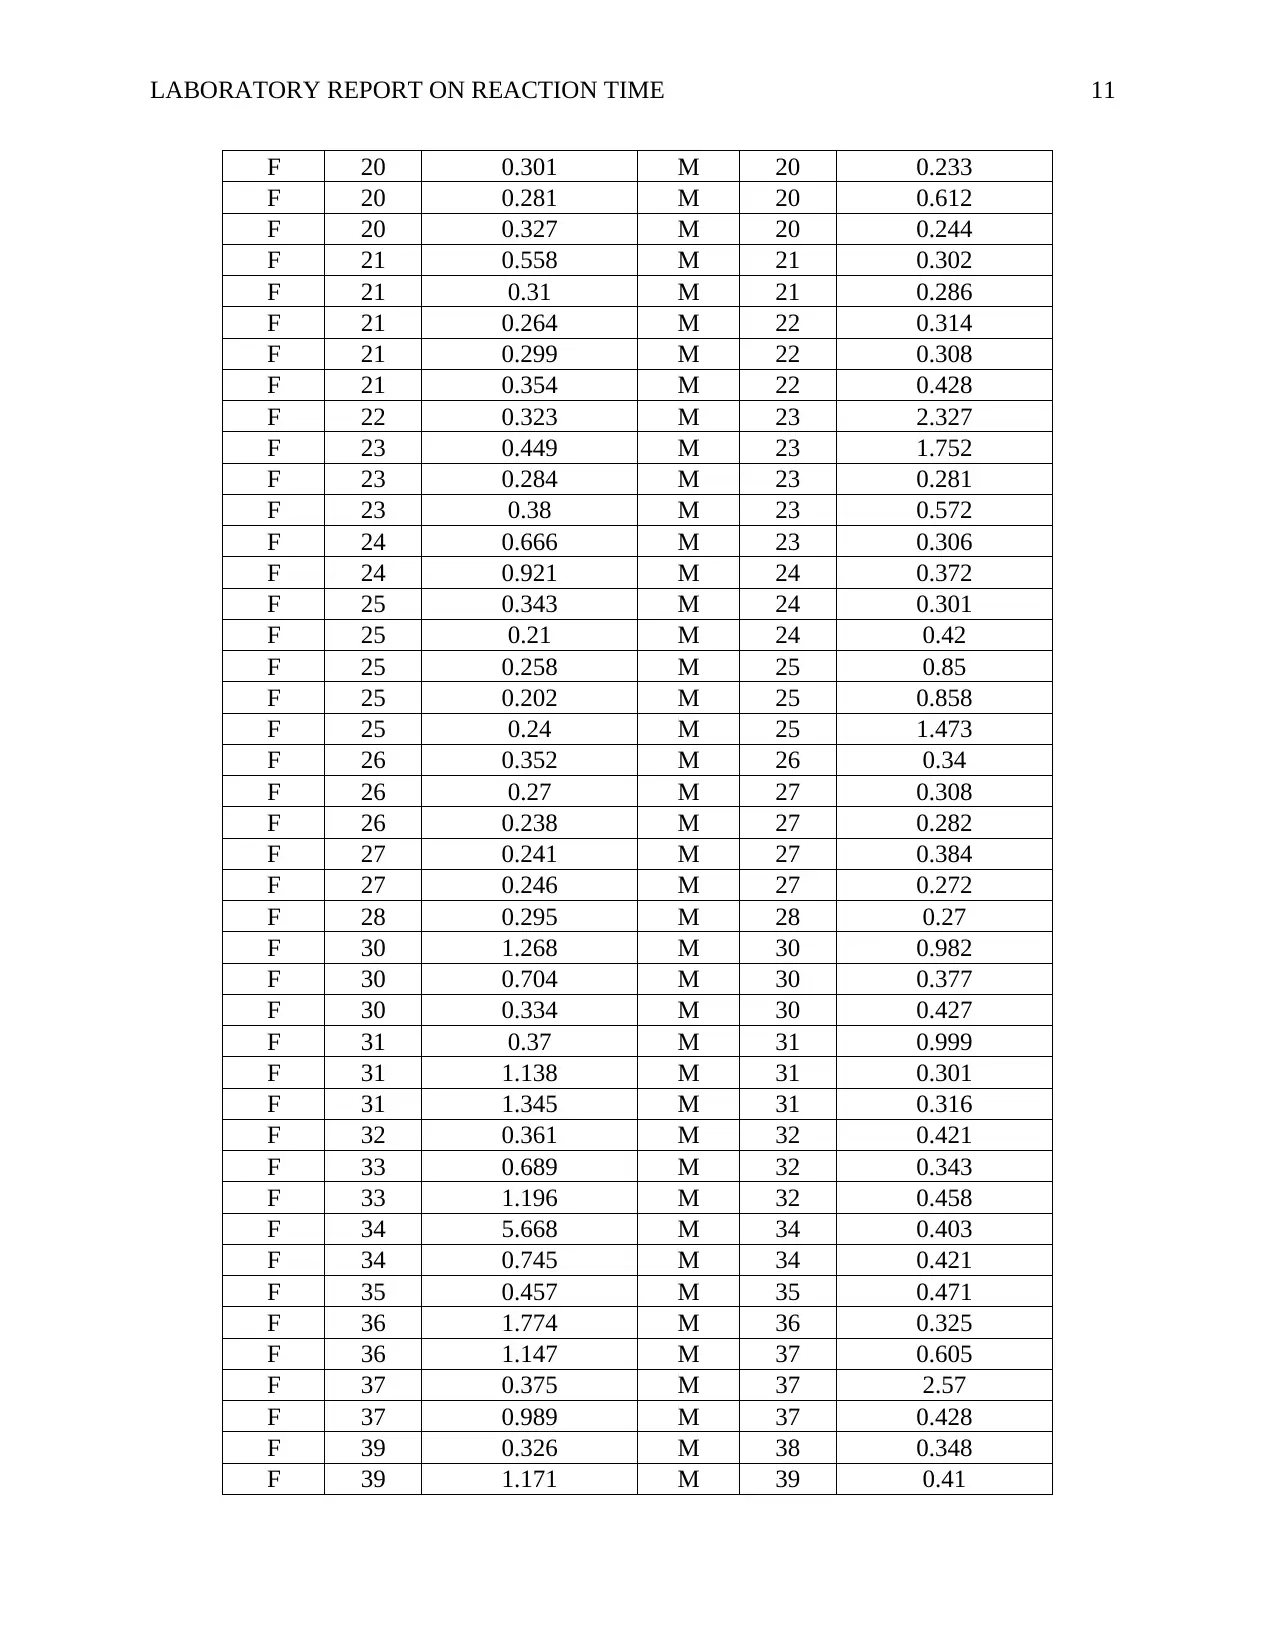
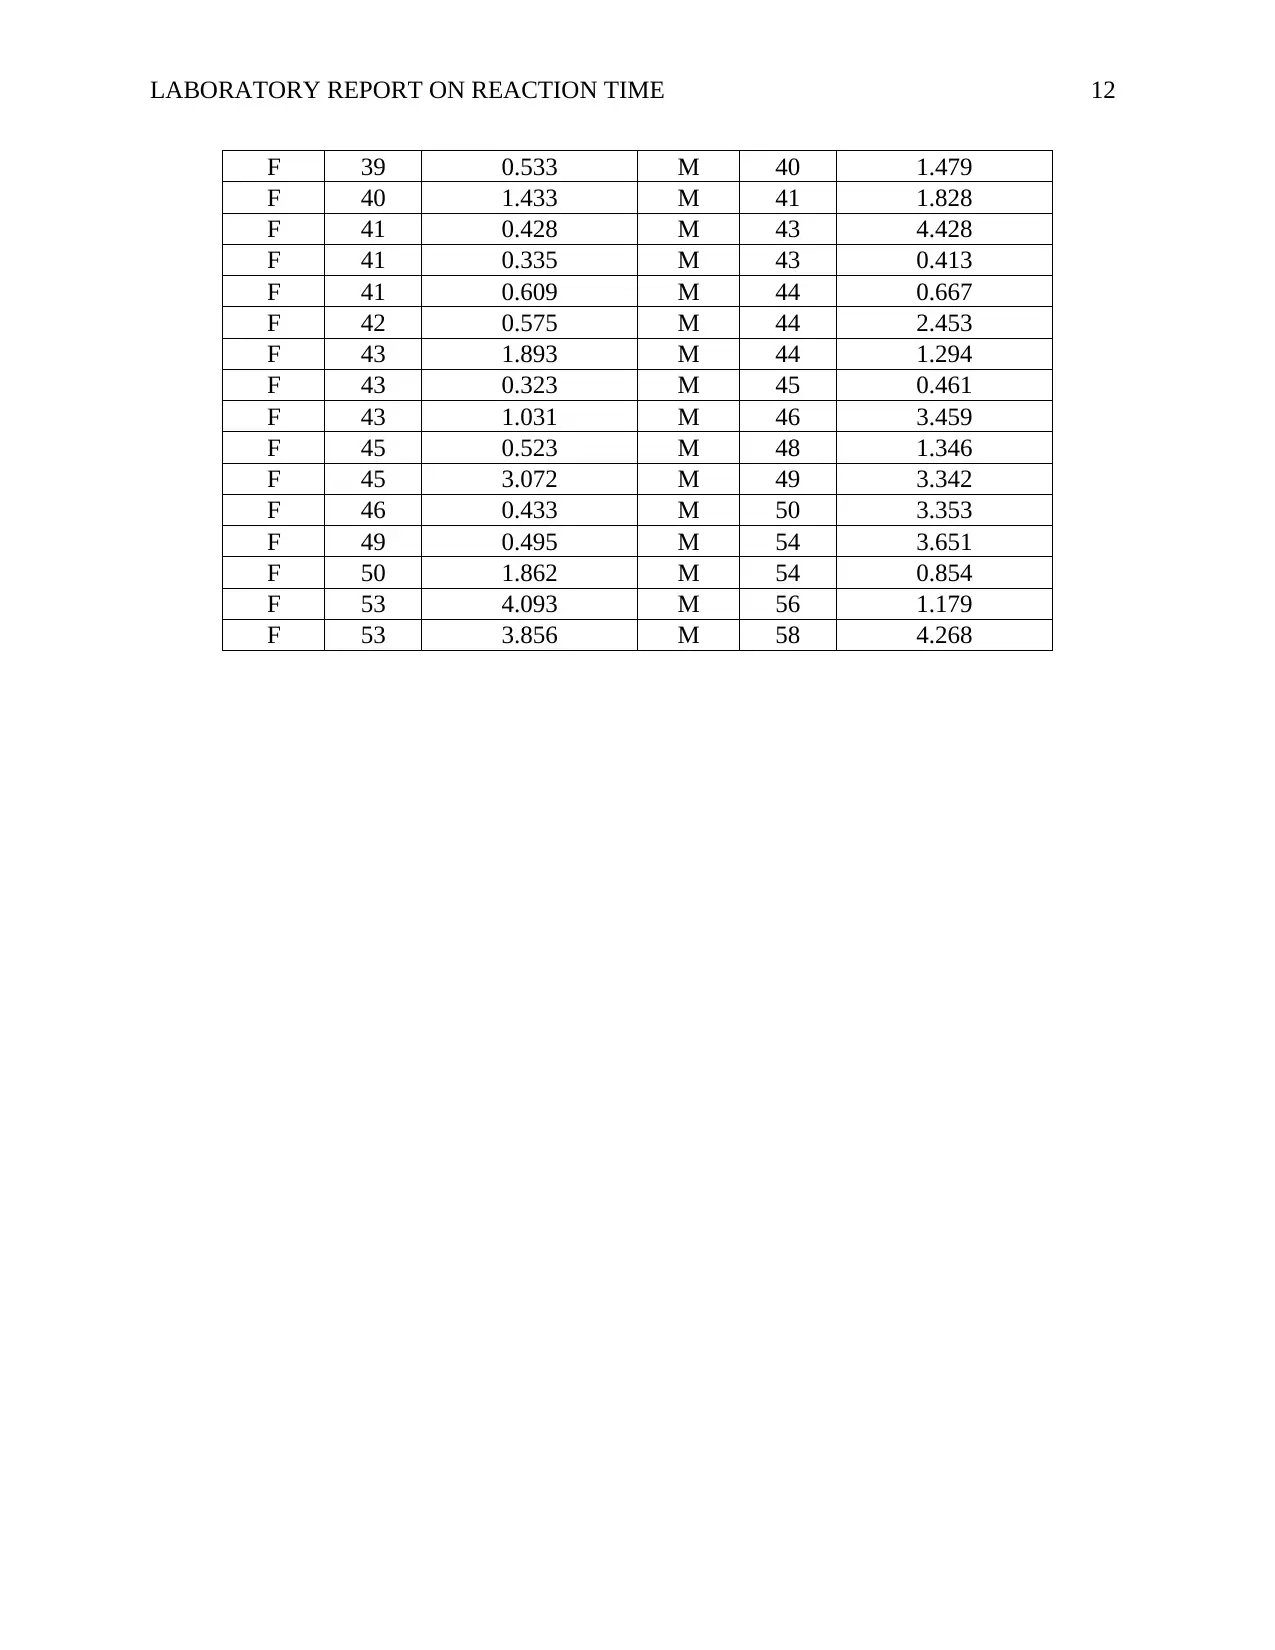
This laboratory report investigates the impact of age and gender on reaction time in individuals between 20 and 60 years old. The study involved 60 male and 60 female participants and employed a simple reaction time task to measure reflexes. Two hypotheses were tested: first, that reaction time decreases with increasing age, and second, that males have a faster reaction time than females. Linear regression and t-tests were used to analyze the data. The results supported the first hypothesis, showing a statistically significant inverse relationship between age and reaction time. However, the second hypothesis was not supported, as no significant difference in reaction time was found between males and females. The report includes detailed methodology, results, and a discussion of the findings, along with raw data presented in the appendix. Desklib provides students access to similar reports and solved assignments for further study.
Document Page
Running head: LABORATORY REPORT ON REACTION TIME 1
Is reaction time affected by gender and age between 20 and 60 years?
Name of the Student
Name of the University Name
tabler-icon-diamond-filled.svg

Paraphrase This Document

Need a fresh take? Get an instant paraphrase of this document with our AI Paraphraser
Document Page
LABORATORY REPORT ON REACTION TIME 2
Abstract
The brain’s aging process begins after a person ages beyond 20 years. The aim of this
investigation was to identifying whether the aging of a person between 20 and 60 years actually
impacts their reflexes or reaction time. To hypothesis were developed for this purpose.
Participants of the study was included 60 male and 60 females whose ages were in the range
from 20 and 60.Hypothesis 1(It is expected that the reaction time reduces as the age increases)
has been proven correct and Hypothesis 2 (Throughout the ages between 20 and 60 years, the
male gender is expected to have a higher reaction time than the female gender) has been proven
wrong in this experiment.
Document Page
LABORATORY REPORT ON REACTION TIME 3
Introduction
Research indicates that as a person ages beyond 20 years, the brain’s aging process
begins. Aging of the brain means that it the number of neurons decreases as the years increase
(Wyss-Coray, 2016). Neurons are cells that constitute the nervous system and the brain. With the
shrinkage of neurons in the brain, a person might take longer to respond to various stimulus. The
longer duration impacts the reflexes and perceptual motor skills. As such, the research was
directed at identifying whether, the aging of a person between 20 and 60 years actually impacts
their reflexes or reaction time (Lodato et al., 2018). Most importantly, the study aimed to
conceptualizing whether there are differences in these reflexes between the genders. A study
conducted on teenage boys and girls found out that boys generally had a faster reflex than girls
(Podrigalo et al., 2017). It is not clear whether that differences are replicated in later years,
especially between 20 and 60 years.
Hypothesis
H A 1- It is expected that the reaction time reduces as the age increases.
H A 2- Throughout the ages between 20 and 60 years, the male gender is expected to have a higher
reaction time than the female gender
Method
The methodology that was involves in determining the reaction time of the participants
using either of the three reaction time tasks which were simple reaction, go/no go reaction, and
choice reaction time tasks. The chosen reaction time task was uniform among all the participants
so that the variation in the independent and dependent variables can be observed. Further, the
study had one dependent variable (reaction time) and two independent variables (age and
gender). Therefore, the variables were form an expression of the form:
Document Page
LABORATORY REPORT ON REACTION TIME 4
Y =a X1 +b X2 +c
Where Y and X represent the dependent variable and dependent variables respectively.
Further, analyses were employed using statistical test such as unpaired t –test and linear
regression.
Participants
Participants of the study included 60 male and 60 females whose ages range from 20 and
60. The ages of the participants was assumed to be normally distributed. The participants were
physically fit and in good health so that the difference between their reaction time is assumed to
be due to their age and gender only.
Materials and Procedures
The materials utilized in this experiment were a stop watch, table, chair, meter ruler, and
a reaction time chart. The simple reaction time experiment was chosen for the experiment. In
case of the simple reaction time experiment, the subject was required to sit on a chair and extend
their forearm on the table edges. A ruler was dropped and the participants were required to catch
the ruler using their forefinger and thumb. The experimenter dropped the ruler on top of the
participants thumb and forefinger. The measurements of the ruler just above the fingers were
recorded. A reaction table was used, and the reaction time in meters per second was read. This
step was repeated severally in case of each participant. Prior to the experiment, the participants
were required to stay at least 6 hours without food to ensure a uniform physiology.
Results
The data for the reaction time, age, and gender of each participant has been recorded. To
evaluate the relationship between age and reaction time (hypothesis 1) 60 male and 60 female
participants were chosen against their reaction time simple reaction time test. To evaluate the
tabler-icon-diamond-filled.svg

Paraphrase This Document

Need a fresh take? Get an instant paraphrase of this document with our AI Paraphraser
Document Page
LABORATORY REPORT ON REACTION TIME 5
second hypothesis simple reaction time of 60 male and 60 female participants between the ages
20 to 60 were examined. The raw data for these two studies were presented in Appendix section
A and B. For the hypothesis 1, linear regression statistical method was employed and for the
hypothesis 2, t- test statistical method was employed. Calculated data from the linear regression
method is presented in the following Table 1.
Table 1: 95 percent confidence intervals, P value and equation from linear regression
Slope 0.03367 to 0.06594
Y-intercept -1.300 to -0.1931
X-intercept 5.599 to 20.19
P- Value < 0.0001
Equation Y = 0.04980*X - 0.7464
For the hypothesis 2, unpaired t-test statistical method was employed and the data for male and
female group between the ages 20 to 60 is presented in the Table 2 below.
Table 2: Unpaired t-test data for male and female group between the ages 20 to 60.
Group Male Female
Mean 0.98997 0.83962
SD 1.09304 1.02579
SEM 0.14111 0.13243
N 60 60
p- Value 0.4388
Discussion
From the Table 1, it can be seen that the p value is less than 0.0001 which is much lower than the
alpha value 0.05 and therefore the relationship between the groups has significant statistical
difference. From the equation obtained, it can be seen that the co- efficient of X is lower than X.
Document Page
LABORATORY REPORT ON REACTION TIME 6
Therefore, the relationship between Y and X in inversely proportional. Hence, the hypothesis 1 is
correct and their reaction time does reduce while age increases and vice versa. From the Table 2,
it can be seen that the p – value is 0.44 which is much higher than the alpha value 0.05. This
signifies that the there is no significant difference between the groups. In the Table 2, reaction
time of male and female between the ages of 20 to 60 were evaluated. Therefore, it can be said
that the hypothesis 2 is not correct and male gender does not have higher reaction rate compared
to female gender.
Therefore, to conclude, it can be said that the Hypothesis 1(It is expected that the reaction
time reduces as the age increases) has been proven correct and Hypothesis 2 (Throughout the
ages between 20 and 60 years, the male gender is expected to have a higher reaction time than
the female gender) has been proven wrong in this experiment.
Document Page
LABORATORY REPORT ON REACTION TIME 7
References
Lodato, M. A., Rodin, R. E., Bohrson, C. L., Coulter, M. E., Barton, A. R., Kwon, M., ... &
Yang, P. (2018). Aging and neurodegeneration are associated with increased mutations in
single human neurons. Science, 359(6375), 555-559.
Podrigalo, L., Iermakov, S., Potop, V., Romanenko, V., Boychenko, N., Rovnaya, O., &Tropin,
Y. (2017). Special aspects of psycho-physiological reactions of different skillfulness
athletes, practicing martial arts. Journal of Physical Education and Sport, 17(1), 519.
Wyss-Coray, T. (2016). Ageing, neurodegeneration and brain rejuvenation. Nature, 539(7628),
180.
tabler-icon-diamond-filled.svg

Paraphrase This Document

Need a fresh take? Get an instant paraphrase of this document with our AI Paraphraser
Document Page
LABORATORY REPORT ON REACTION TIME 8
Appendix A: Raw data for Table 1
Age Simple Reaction
time
20 0.584
20 0.441
20 0.259
20 0.327
20 0.233
20 0.303
20 0.267
21 0.299
21 0.558
21 0.264
21 0.354
21 0.31
21 0.286
21 0.302
22 0.314
22 0.308
22 0.323
22 0.428
23 0.306
23 0.38
23 0.281
23 0.284
23 2.327
23 0.449
23 0.572
23 1.752
24 0.666
24 0.301
24 0.921
24 0.42
24 0.372
25 0.258
25 0.85
25 0.24
25 0.21
25 0.858
25 0.202
25 0.343
25 1.473
Document Page
LABORATORY REPORT ON REACTION TIME 9
26 0.34
26 0.238
26 0.352
26 0.27
27 0.308
27 0.246
27 0.282
27 0.384
27 0.241
27 0.272
28 0.295
28 0.27
30 0.334
30 1.268
30 0.377
30 0.982
30 0.704
30 0.427
31 1.138
31 0.301
31 0.37
31 0.316
31 1.345
31 0.999
32 0.421
32 0.458
32 0.361
32 0.343
33 0.689
33 1.196
34 0.745
34 5.668
34 0.403
34 0.421
35 0.471
35 0.457
36 1.774
36 0.325
36 1.147
37 0.375
37 0.989
37 0.605
37 2.57
Document Page
LABORATORY REPORT ON REACTION TIME 10
37 0.428
38 0.348
39 1.171
39 0.326
39 0.41
39 0.533
40 1.479
40 1.433
41 0.428
41 1.828
41 0.609
41 0.335
42 0.575
43 0.413
43 1.893
43 1.031
43 4.428
43 0.323
44 0.667
44 2.453
44 1.294
45 0.523
45 3.072
45 0.461
46 0.433
46 3.459
48 1.346
49 0.495
49 3.342
50 1.862
50 3.353
53 3.856
53 4.093
54 3.651
54 0.854
55 0.756
55 0.409
56 1.179
Appendix B: Raw data for Table 2
Gende
r Age Simple reaction
Time
Gende
r Age Simple reaction
Time
F 20 0.214 M 20 0.223
tabler-icon-diamond-filled.svg

Paraphrase This Document

Need a fresh take? Get an instant paraphrase of this document with our AI Paraphraser
Document Page
LABORATORY REPORT ON REACTION TIME 11
F 20 0.301 M 20 0.233
F 20 0.281 M 20 0.612
F 20 0.327 M 20 0.244
F 21 0.558 M 21 0.302
F 21 0.31 M 21 0.286
F 21 0.264 M 22 0.314
F 21 0.299 M 22 0.308
F 21 0.354 M 22 0.428
F 22 0.323 M 23 2.327
F 23 0.449 M 23 1.752
F 23 0.284 M 23 0.281
F 23 0.38 M 23 0.572
F 24 0.666 M 23 0.306
F 24 0.921 M 24 0.372
F 25 0.343 M 24 0.301
F 25 0.21 M 24 0.42
F 25 0.258 M 25 0.85
F 25 0.202 M 25 0.858
F 25 0.24 M 25 1.473
F 26 0.352 M 26 0.34
F 26 0.27 M 27 0.308
F 26 0.238 M 27 0.282
F 27 0.241 M 27 0.384
F 27 0.246 M 27 0.272
F 28 0.295 M 28 0.27
F 30 1.268 M 30 0.982
F 30 0.704 M 30 0.377
F 30 0.334 M 30 0.427
F 31 0.37 M 31 0.999
F 31 1.138 M 31 0.301
F 31 1.345 M 31 0.316
F 32 0.361 M 32 0.421
F 33 0.689 M 32 0.343
F 33 1.196 M 32 0.458
F 34 5.668 M 34 0.403
F 34 0.745 M 34 0.421
F 35 0.457 M 35 0.471
F 36 1.774 M 36 0.325
F 36 1.147 M 37 0.605
F 37 0.375 M 37 2.57
F 37 0.989 M 37 0.428
F 39 0.326 M 38 0.348
F 39 1.171 M 39 0.41
Document Page
LABORATORY REPORT ON REACTION TIME 12
F 39 0.533 M 40 1.479
F 40 1.433 M 41 1.828
F 41 0.428 M 43 4.428
F 41 0.335 M 43 0.413
F 41 0.609 M 44 0.667
F 42 0.575 M 44 2.453
F 43 1.893 M 44 1.294
F 43 0.323 M 45 0.461
F 43 1.031 M 46 3.459
F 45 0.523 M 48 1.346
F 45 3.072 M 49 3.342
F 46 0.433 M 50 3.353
F 49 0.495 M 54 3.651
F 50 1.862 M 54 0.854
F 53 4.093 M 56 1.179
F 53 3.856 M 58 4.268
chevron_up_icon
1 out of 12
circle_padding
hide_on_mobile
zoom_out_icon
[object Object]