Business Analysis Report: Hikins and Main Real Estate Agency Review
VerifiedAdded on 2020/02/24
|11
|2199
|78
Report
AI Summary
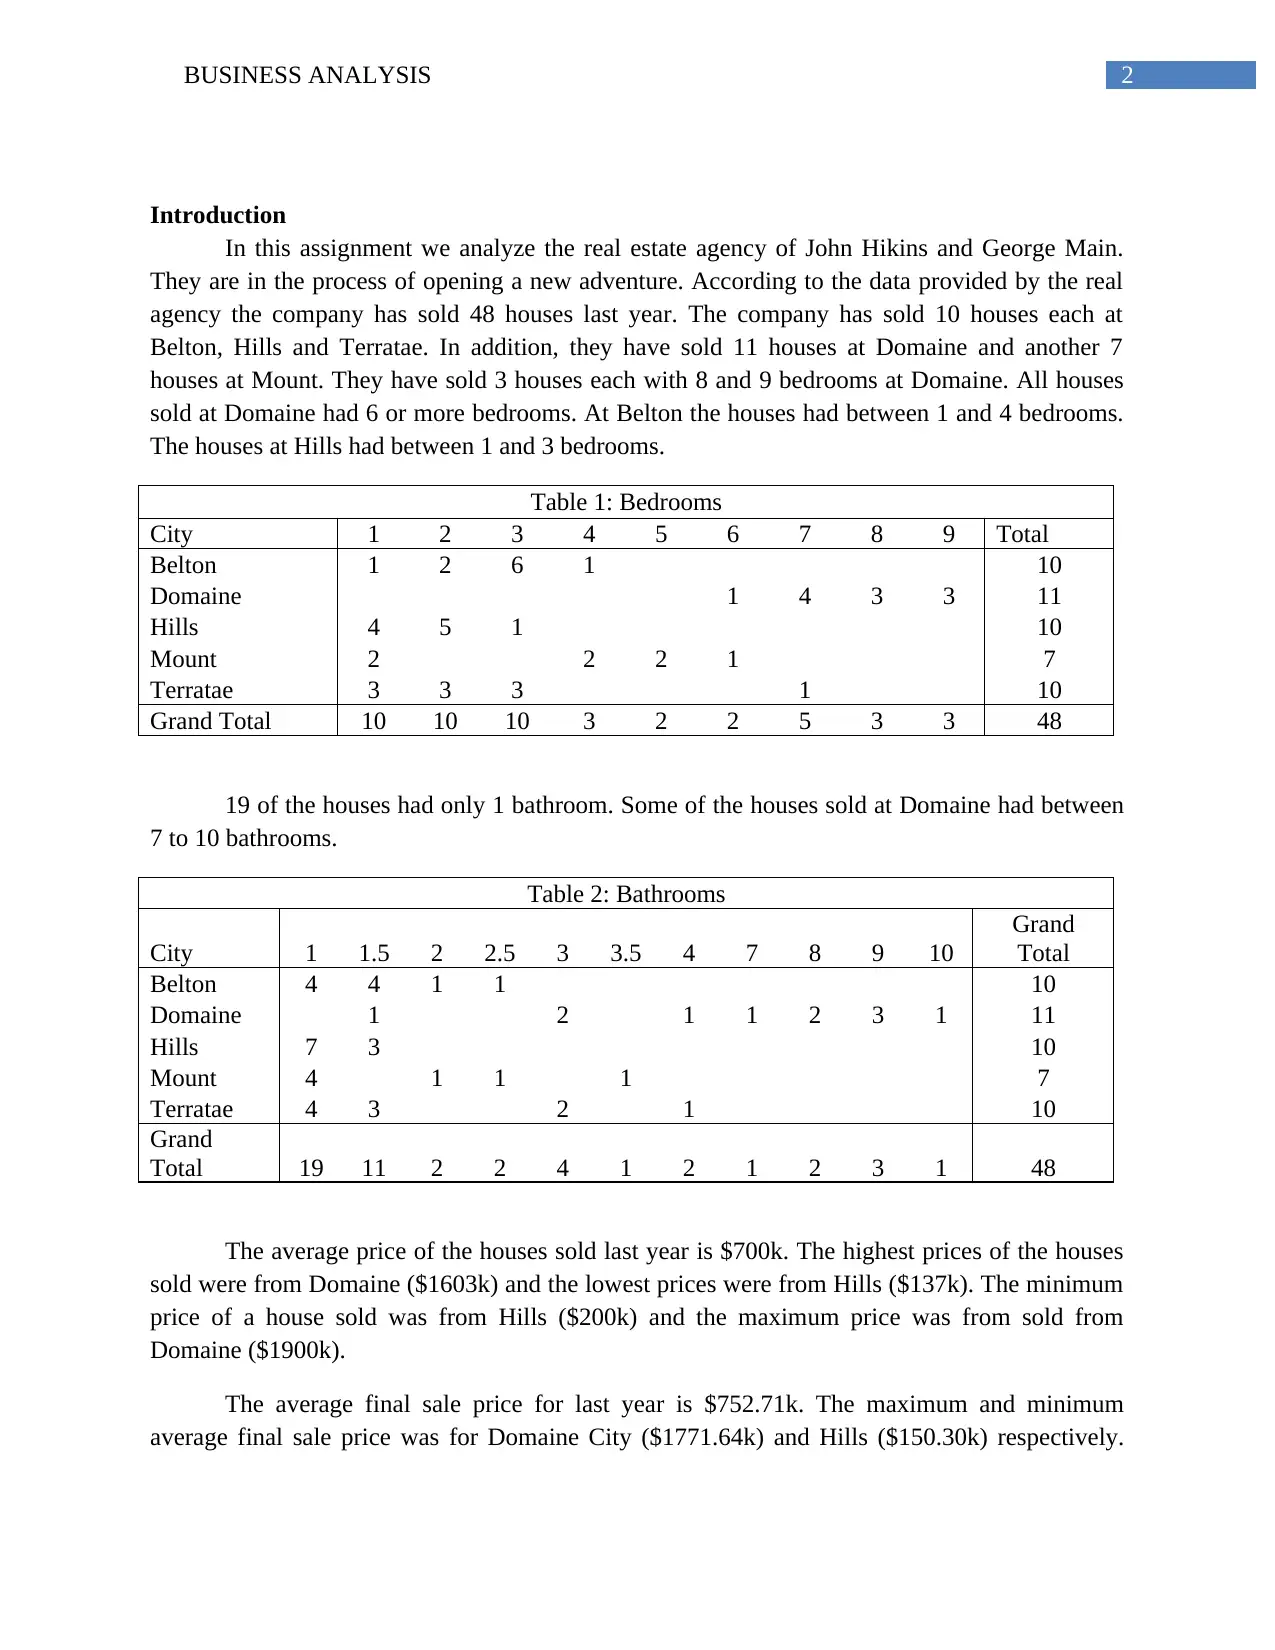
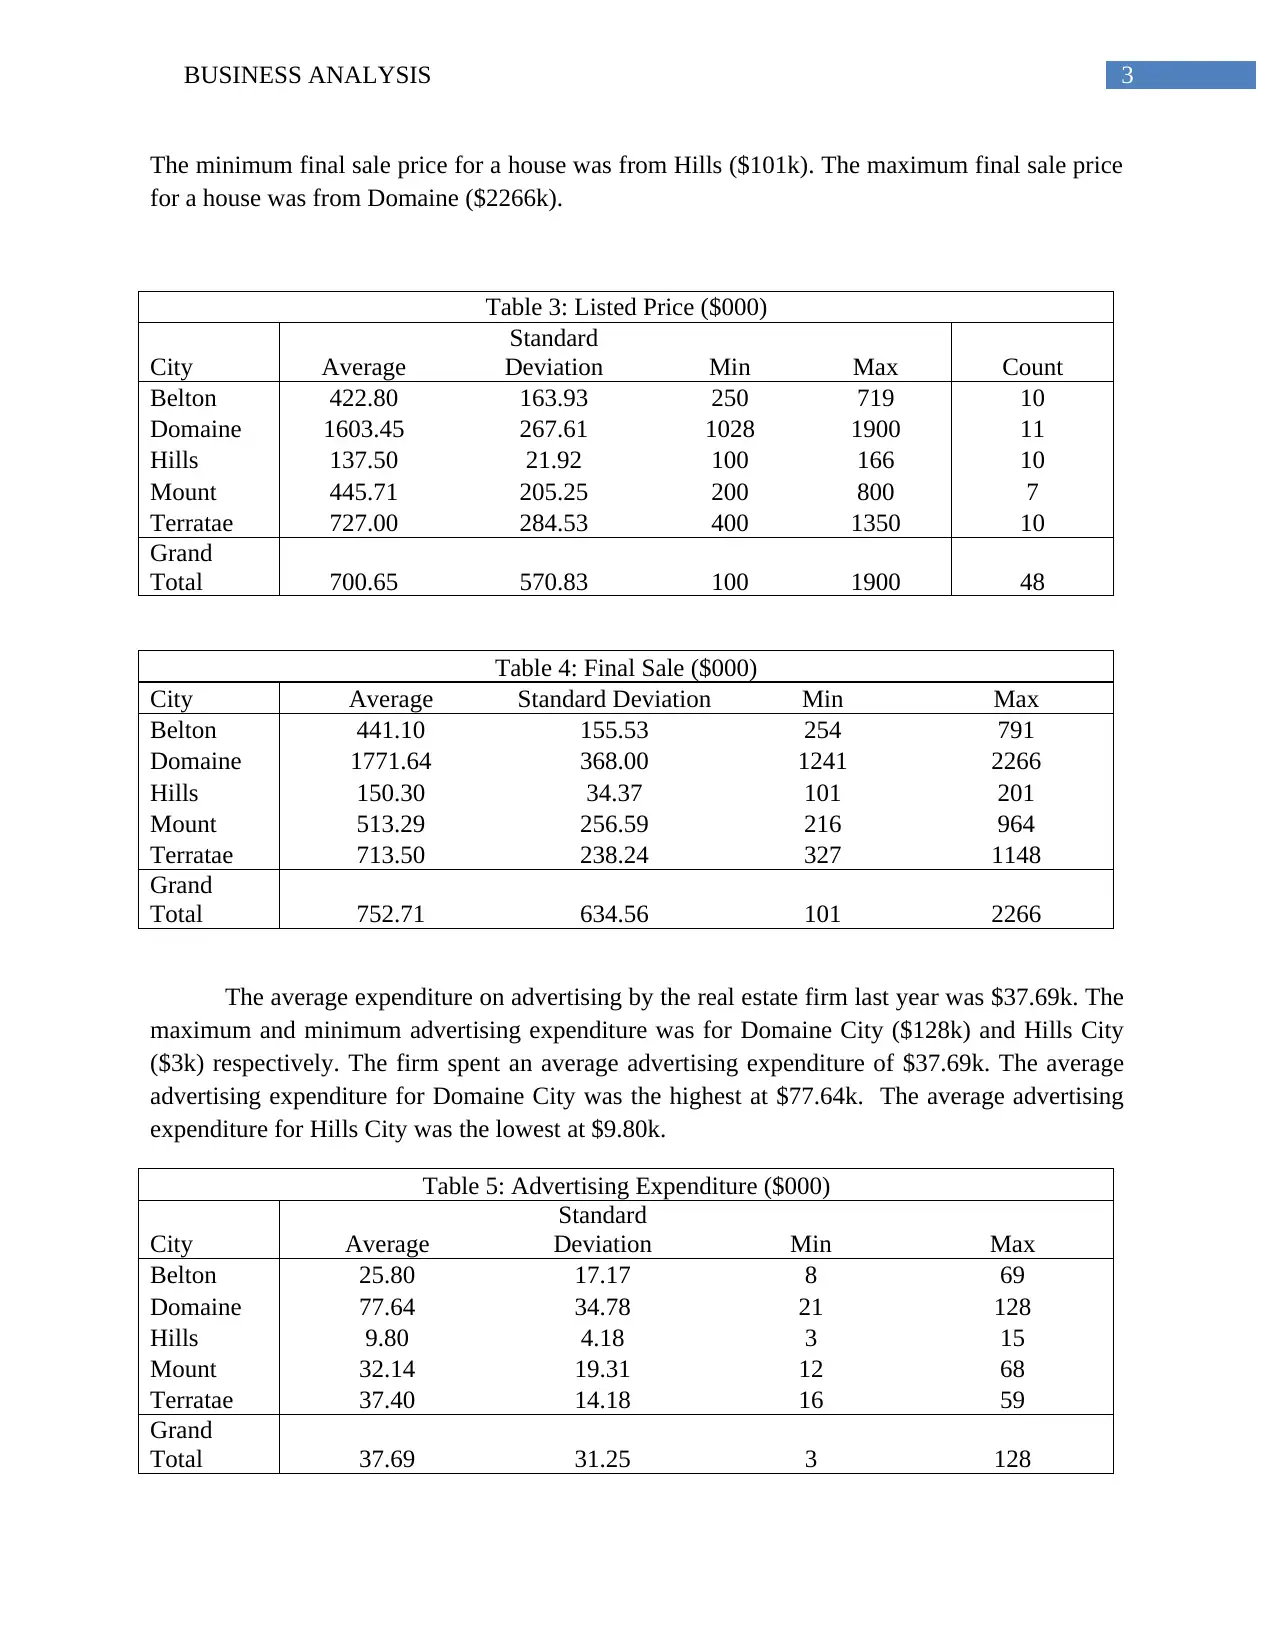
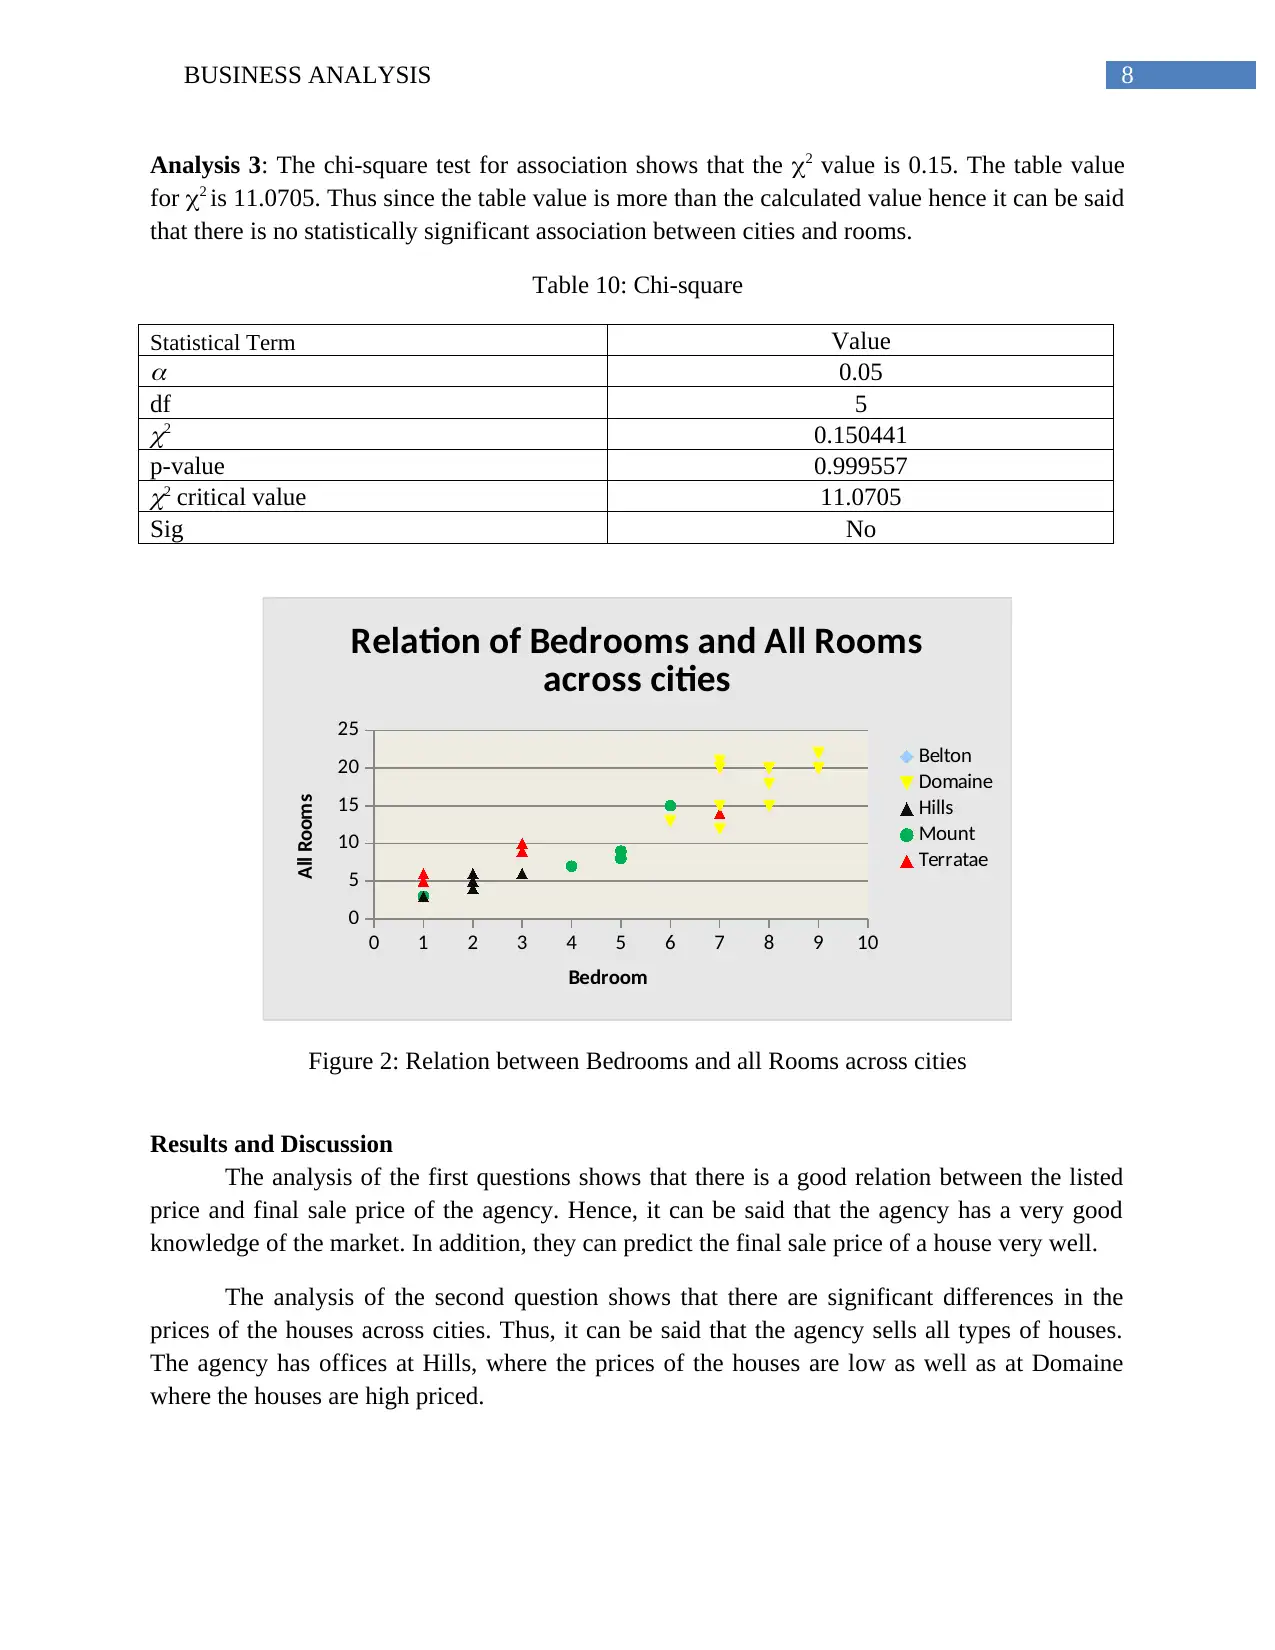
This report provides a comprehensive business analysis of the real estate agency owned by John Hikins and George Main, evaluating their performance based on data from the previous year. The analysis includes an examination of sales data, including the number of houses sold in different cities (Belton, Domaine, Hills, Mount, and Terratae), along with details on bedrooms, bathrooms, listed prices, and final sale prices. Statistical methods such as regression analysis, ANOVA, and the Chi-square test are employed to address key research questions. These questions explore the relationship between listed and final prices, the variance in final sale prices across different cities, and the independence of the number of bedrooms and all rooms concerning the city. The results reveal a strong positive correlation between listed and final prices, significant differences in final sale prices across cities, and no statistically significant association between cities and the number of rooms. The report concludes by discussing the implications of these findings for the agency's market knowledge and sales strategies.

Running Head: BUSINESS ANALYSIS
Business Analysis
Name of the student
Name of the university
Author’s note
Business Analysis
Name of the student
Name of the university
Author’s note
Secure Best Marks with AI Grader
Need help grading? Try our AI Grader for instant feedback on your assignments.

1BUSINESS ANALYSIS
Table of Contents
Introduction......................................................................................................................................2
Research Questions..........................................................................................................................3
Statistical Methods...........................................................................................................................4
Technical Analysis...........................................................................................................................5
Results and Discussion....................................................................................................................6
Reference.........................................................................................................................................8

2BUSINESS ANALYSIS
Introduction
In this assignment we analyze the real estate agency of John Hikins and George Main.
They are in the process of opening a new adventure. According to the data provided by the real
agency the company has sold 48 houses last year. The company has sold 10 houses each at
Belton, Hills and Terratae. In addition, they have sold 11 houses at Domaine and another 7
houses at Mount. They have sold 3 houses each with 8 and 9 bedrooms at Domaine. All houses
sold at Domaine had 6 or more bedrooms. At Belton the houses had between 1 and 4 bedrooms.
The houses at Hills had between 1 and 3 bedrooms.
Table 1: Bedrooms
City 1 2 3 4 5 6 7 8 9 Total
Belton 1 2 6 1 10
Domaine 1 4 3 3 11
Hills 4 5 1 10
Mount 2 2 2 1 7
Terratae 3 3 3 1 10
Grand Total 10 10 10 3 2 2 5 3 3 48
19 of the houses had only 1 bathroom. Some of the houses sold at Domaine had between
7 to 10 bathrooms.
Table 2: Bathrooms
City 1 1.5 2 2.5 3 3.5 4 7 8 9 10
Grand
Total
Belton 4 4 1 1 10
Domaine 1 2 1 1 2 3 1 11
Hills 7 3 10
Mount 4 1 1 1 7
Terratae 4 3 2 1 10
Grand
Total 19 11 2 2 4 1 2 1 2 3 1 48
The average price of the houses sold last year is $700k. The highest prices of the houses
sold were from Domaine ($1603k) and the lowest prices were from Hills ($137k). The minimum
price of a house sold was from Hills ($200k) and the maximum price was from sold from
Domaine ($1900k).
The average final sale price for last year is $752.71k. The maximum and minimum
average final sale price was for Domaine City ($1771.64k) and Hills ($150.30k) respectively.

3BUSINESS ANALYSIS
The minimum final sale price for a house was from Hills ($101k). The maximum final sale price
for a house was from Domaine ($2266k).
Table 3: Listed Price ($000)
City Average
Standard
Deviation Min Max Count
Belton 422.80 163.93 250 719 10
Domaine 1603.45 267.61 1028 1900 11
Hills 137.50 21.92 100 166 10
Mount 445.71 205.25 200 800 7
Terratae 727.00 284.53 400 1350 10
Grand
Total 700.65 570.83 100 1900 48
Table 4: Final Sale ($000)
City Average Standard Deviation Min Max
Belton 441.10 155.53 254 791
Domaine 1771.64 368.00 1241 2266
Hills 150.30 34.37 101 201
Mount 513.29 256.59 216 964
Terratae 713.50 238.24 327 1148
Grand
Total 752.71 634.56 101 2266
The average expenditure on advertising by the real estate firm last year was $37.69k. The
maximum and minimum advertising expenditure was for Domaine City ($128k) and Hills City
($3k) respectively. The firm spent an average advertising expenditure of $37.69k. The average
advertising expenditure for Domaine City was the highest at $77.64k. The average advertising
expenditure for Hills City was the lowest at $9.80k.
Table 5: Advertising Expenditure ($000)
City Average
Standard
Deviation Min Max
Belton 25.80 17.17 8 69
Domaine 77.64 34.78 21 128
Hills 9.80 4.18 3 15
Mount 32.14 19.31 12 68
Terratae 37.40 14.18 16 59
Grand
Total 37.69 31.25 3 128
Secure Best Marks with AI Grader
Need help grading? Try our AI Grader for instant feedback on your assignments.

4BUSINESS ANALYSIS
Research Questions
In order to understand the business of Hikins and Main the following research questions
may be formulated to analyze the data provided:
Question 1: Is there a relation between Listed Price and Final Price? If so, what is the relation?
Listing price can be defined as the price initially quoted by a real estate agent when a property
comes up for sales. The listing price depends on the market of the houses, location of the house
(city), number of bedrooms and bathrooms. The final sale price is the final price at which the
house is sold. It can be different from the list price. A real estate agent who has a good
understanding of the market can quote a listing price which would be very near to the final price.
Then the relation between final price and listed price would be very close.
Question 2: Does the final sale price differ for different cities?
The sale price of a house depends on the market. The analysis of the market would reveal that
the price of house differs across cities. Hence, it is essential to study if the final prices of the
houses sold by the real estate agency differed across cities. This would help the agency in finding
which city had the least average final sale price and which city had the highest average sale
price. It is known that the average sale price of Domaine city is the highest and Hills city is the
lowest. The answer to the question would help in finding if all the houses sold in Domaine had a
higher price over all the other cities. Similarly, the answer would help in finding if all the houses
sold in Hills had a Lower price over all the other cities.
Question 3: Is the number of Bedrooms and All rooms in a house independent of City?
A house has bedrooms, bathrooms and other rooms. In this question we intend to find if there is a
relationship between the number of bedrooms and all rooms of the houses sold by the real estate
agency of Hikins and Main across different cities. This would help the agency in determining if
the number of bedrooms in a house has any relation with all the rooms of the particular house
across different cities.
Statistical Methods
Answer 1: In order to investigate the relation between listed price and final price the regression
analysis is done. Regression analysis not only provides the correlation between the two variables
but also an approximate estimation of how much would be the final price from a given listed
price (Anderson et al., 2014) . The listed price is the independent variable. An independent
variable is the variable which can be changed. The independent variable is the listed price. Since,

5BUSINESS ANALYSIS
listed price depends on the number of bedrooms and bathrooms of a house, location of house and
the market hence it is the independent variable. The dependent variable is the final price.
The regression equation is provided by the formula : Y = β0 +β1 X
Where Y = Final Sale Price
X = Listed Price of a House
β0 is the base Final price of a house when it is not listed
β1 is the rate of change of the final price with change in of listed price
The correlation between the variable is provided by: r = n∑ xy−∑ x ∑ y
√ [ n∑ x2− (∑ x )2
] [n ∑ y2 − (∑ y )2
]
Answer 2: In order to investigate the question ANOVA is used. ANOVA is used to investigate if
the average of the variables is equal or otherwise. The variables under study in the question are
the final price of the houses segregated across cities. The dependent variables are the final prices
of the houses. The dependent variables are measured at continuous level (Croucher, 2013). The
independent variables are the cities.
In ANOVA we find the variance ratio (F). The variance ratio ¿ Mean square of Groups
Mean Squre of Errors
The Mean square of Groups ¿ ∑ of Square of Groups
Degreesof freedomof Groups
The Mean square of Errors ¿ ∑ of Square of Errors
Degreesof freedomof Errors
The results of ANOVA is based on F-value. When the F-value is compared against the table
value. When, the F-value is more than critical value of F, then there are variations in the
independent variables.
Answer 3: In order to investigate if there is any association between number of rooms across
cities the Chi-square goodness of fit test is used (Black, 2014). The variables in the study are the
cities and the number of rooms. The independent variables for the variable city are the five cities.
The independent variables for the variable rooms are bedrooms and all rooms.
The Chi-square is defined as ¿ ∑ ( Observed−Expected )2
Expected

6BUSINESS ANALYSIS
Where the observed values are the average number of bedrooms and all rooms sold for a
particular city. The expected value is based on the average number of rooms for all the cities.
The chi-square value is compared with the Chi-square critical value. This is a table value based
on the level of significance and degrees of freedom.
If the chi-square value is less than the critical value then there is significant association between
the variables, else there is no significant association between the variables.
Technical Analysis
Analysis 1: The correlation between listed price and final price is 0.9805. In regression analysis
correlation is shown by “Multiple R.” Thus it can be said that the correlation between the
variables is very strong, positive and linear. Moreover 96.13% of the variability in final price can
be predicted through the listed price. In addition, for each $1000 increase in listed price the final
price for a house increases by $1090. The, coefficient of the slope is statistically significant at
0.05 level of significance.
Table 6: Regression Statistics
Multiple R 0.9805
R Square 0.9613
Adjusted R Square 0.9605
Standard Error 126.1632
Observations 48
Table 7: Regression Coefficients
Coefficients
Standard
Error t Stat P-value
Intercept -10.95 29.01 -0.377 0.708
Listed ($000) 1.09 0.03 33.808 0.000
Paraphrase This Document
Need a fresh take? Get an instant paraphrase of this document with our AI Paraphraser

7BUSINESS ANALYSIS
0 200 400 600 800 1000 1200 1400 1600 1800 2000
0
500
1000
1500
2000
2500
f(x) = 1.08993756906385 x − 10.9518830247187
R² = 0.961311853664003
Relation between Final and Listed
Price
Listed Price ($000)
Final Price ($000)
Figure 1: Relation between Final Sale price and Listed Price
Analysis 2: The analysis of ANOVA shows that the F-value (4,43) is 71.007. The F-crit value =
2.589. Since the F-value is more than F-crit value, hence there are statistically significant
variations in the final price of the houses across cities. Thus, the final price of the houses at
Domaine is significantly different than Hills.
Table 8: ANOVA
Source of
Variation SS df MS F P-value F crit
Between Groups 16436948 4 4109237 71.007 0.000 2.589
Within Groups 2488447 43 57870.87
Total 18925396 47
Table 9: SUMMARY
Groups Count Sum Average Variance
Belton 10 4411 441.10 24188.10
Domaine 11 19488 1771.64 135427.25
Hills 10 1503 150.30 1181.12
Mount 7 3593 513.29 65837.57
Terratae 10 7135 713.50 56758.50

8BUSINESS ANALYSIS
Analysis 3: The chi-square test for association shows that the 2 value is 0.15. The table value
for 2 is 11.0705. Thus since the table value is more than the calculated value hence it can be said
that there is no statistically significant association between cities and rooms.
Table 10: Chi-square
Statistical Term Value 0.05
df 52 0.150441
p-value 0.9995572 critical value 11.0705
Sig No
0 1 2 3 4 5 6 7 8 9 10
0
5
10
15
20
25
Relation of Bedrooms and All Rooms
across cities
Belton
Domaine
Hills
Mount
Terratae
Bedroom
All Rooms
Figure 2: Relation between Bedrooms and all Rooms across cities
Results and Discussion
The analysis of the first questions shows that there is a good relation between the listed
price and final sale price of the agency. Hence, it can be said that the agency has a very good
knowledge of the market. In addition, they can predict the final sale price of a house very well.
The analysis of the second question shows that there are significant differences in the
prices of the houses across cities. Thus, it can be said that the agency sells all types of houses.
The agency has offices at Hills, where the prices of the houses are low as well as at Domaine
where the houses are high priced.

9BUSINESS ANALYSIS
From the analysis of the third answer it is found that the number of bedrooms and all
rooms is independent of the city. Thus it can be said that the houses sold by the agency are
different for different cities. All the houses sold are unique.
From the analysis of the third answer it is found that the number of bedrooms and all
rooms is independent of the city. Thus it can be said that the houses sold by the agency are
different for different cities. All the houses sold are unique.
Secure Best Marks with AI Grader
Need help grading? Try our AI Grader for instant feedback on your assignments.

10BUSINESS ANALYSIS
Reference
Anderson, D. R., Sweeney, D. J., Williams, T. A., Camm, J. D., & Cochran, J. J.
(2014). Statistics for business & economics, revised. Cengage Learning.
Black, K. (2014). Business statistics: for contemporary decision making. John Wiley & Sons.
Croucher, J. S. (2013). Introductory mathematics and statistics. McGraw Hill, New York.
1 out of 11
Related Documents

Your All-in-One AI-Powered Toolkit for Academic Success.
+13062052269
info@desklib.com
Available 24*7 on WhatsApp / Email
Unlock your academic potential
© 2024 | Zucol Services PVT LTD | All rights reserved.