Report: Currency Swap Analysis and Real Estate Investment Valuation

Verified

Added on  2020/06/06

|7
|638
|24
Report
AI Summary
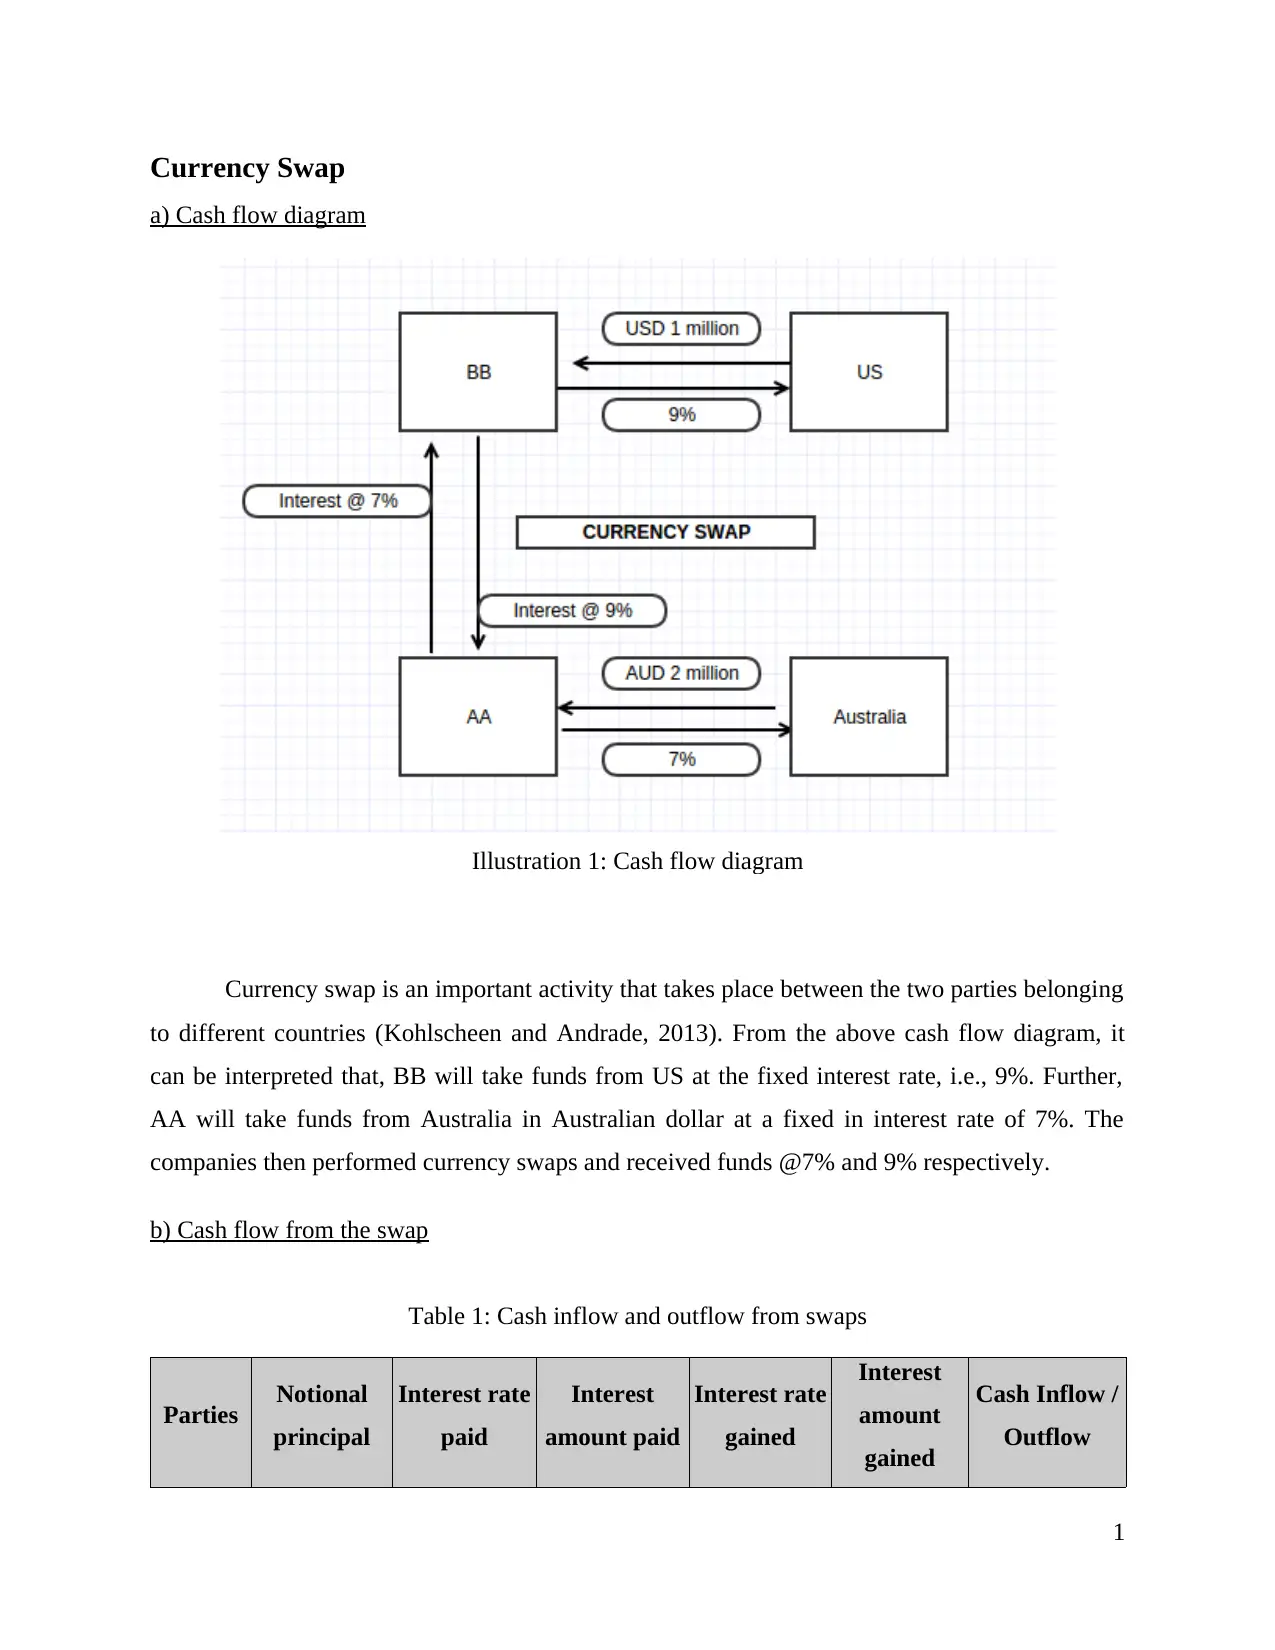
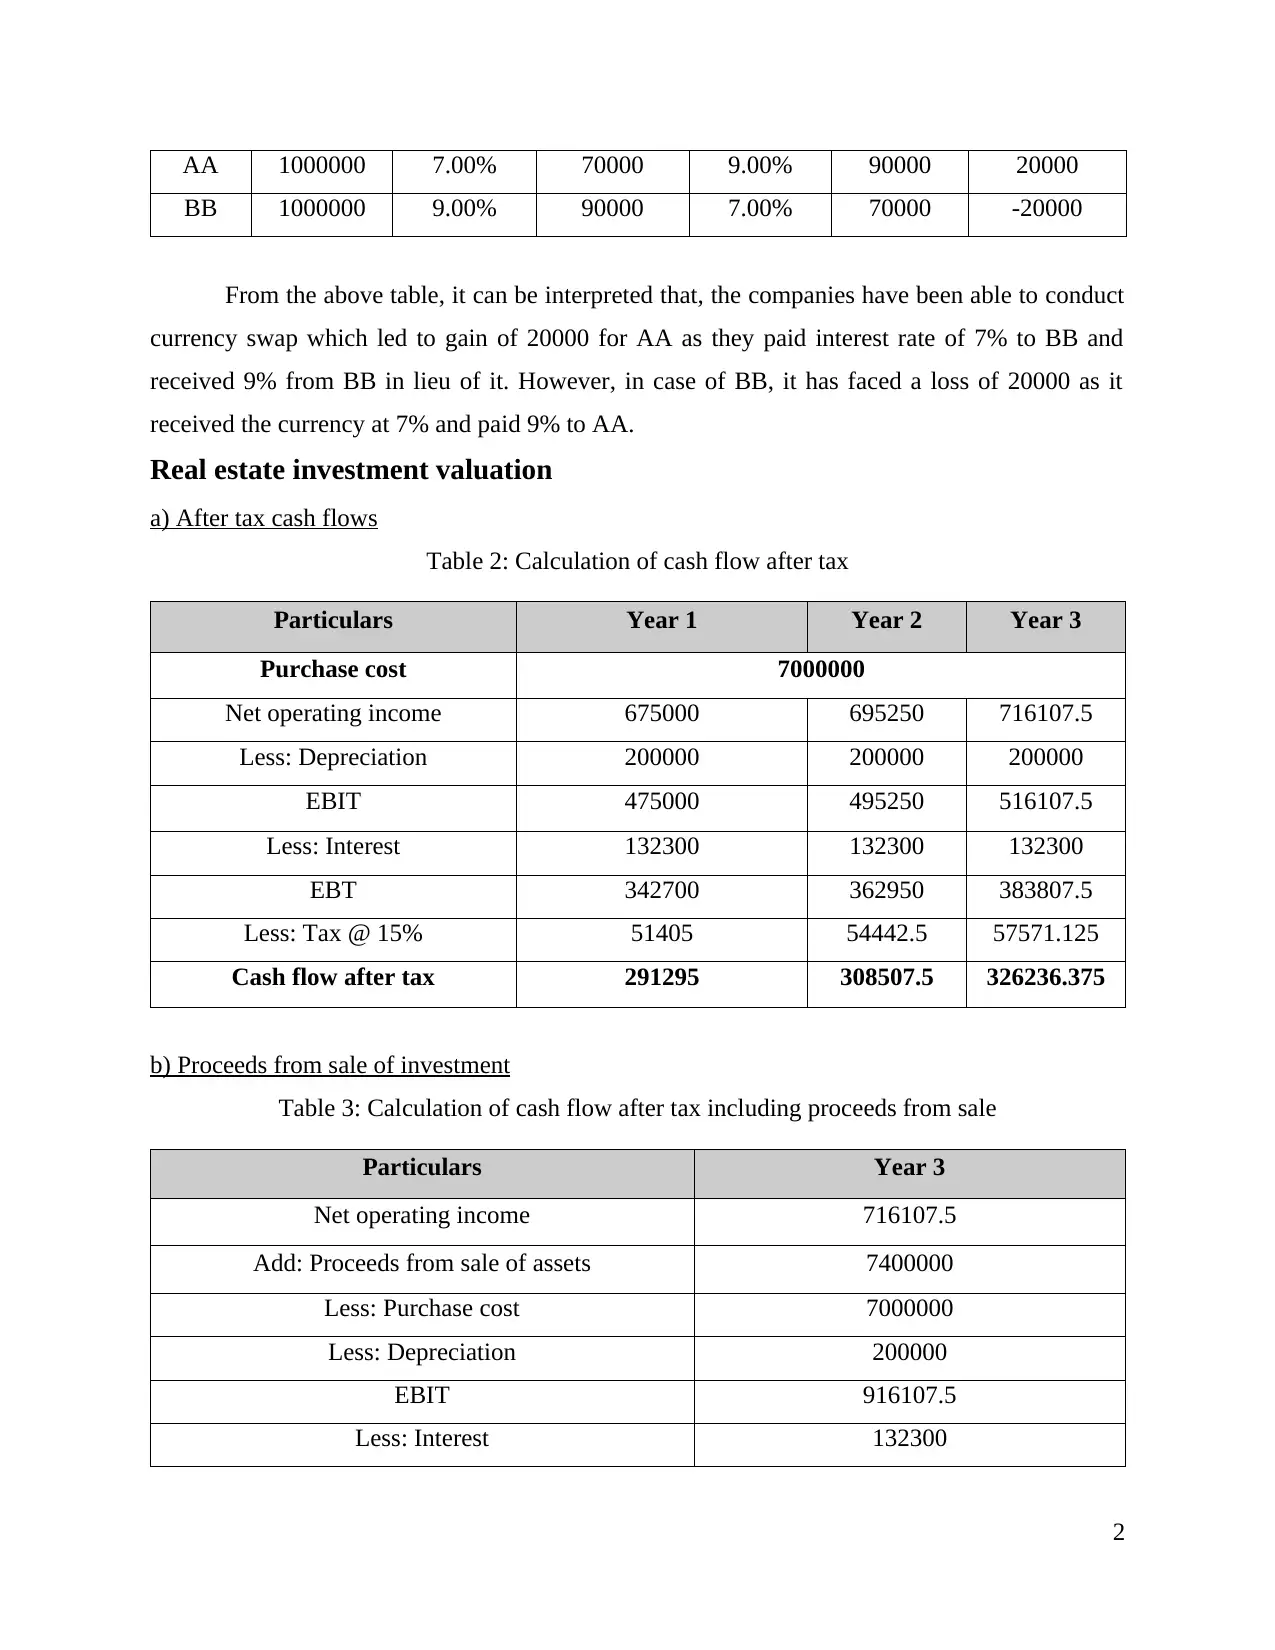
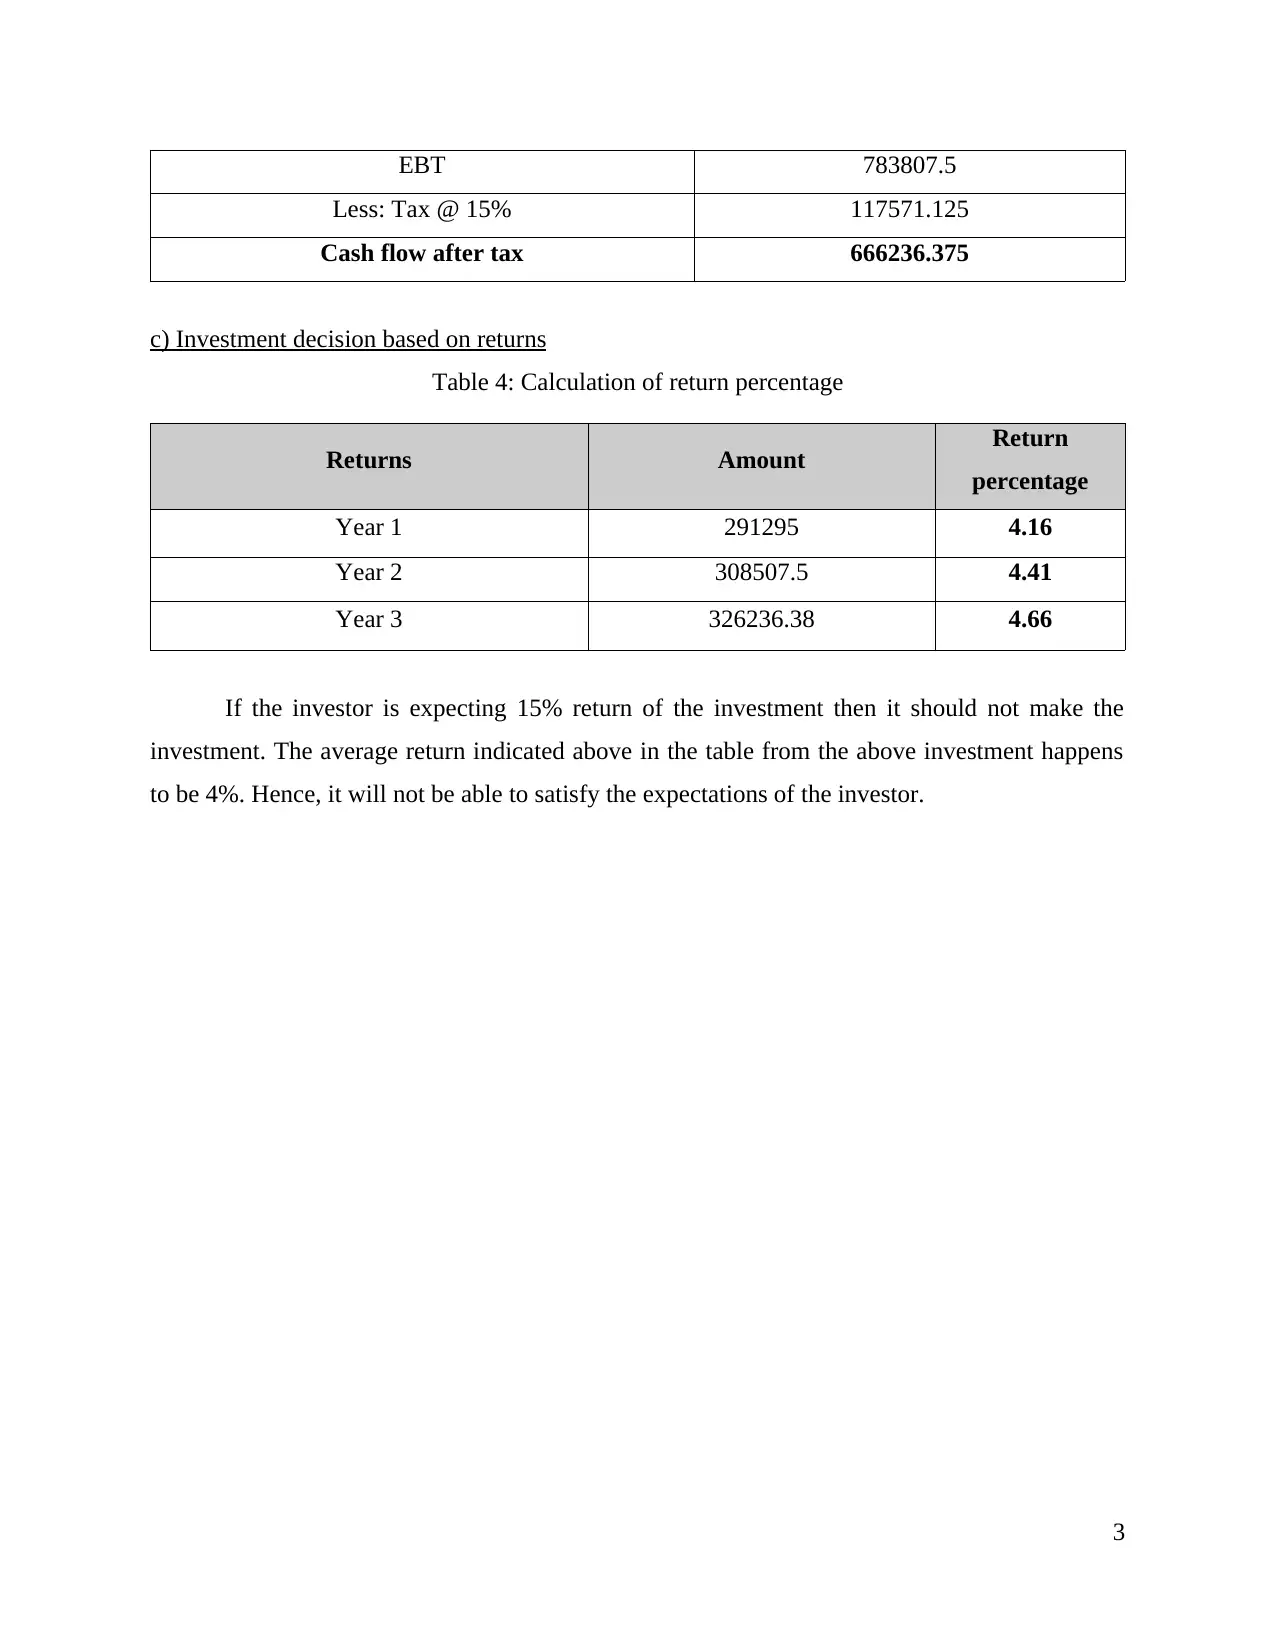
This report provides a comprehensive analysis of currency swaps and real estate investment valuation. It begins with an examination of currency swaps, including a cash flow diagram and a table detailing cash inflows and outflows. The report then transitions to real estate investment valuation, presenting after-tax cash flow calculations for three years, including net operating income, depreciation, EBIT, and tax calculations. It also includes a calculation of proceeds from the sale of the investment. Finally, the report analyzes investment decisions based on returns, calculating return percentages for each year and assessing whether the investment meets a specified return expectation. The report is supported by references and includes tables illustrating key financial data.
Document Page
CURRENCY SWAP AND
REAL STATE INVESTMENT
VALUATION
tabler-icon-diamond-filled.svg

Secure Best Marks with AI Grader

Need help grading? Try our AI Grader for instant feedback on your assignments.
Document Page
TABLE OF CONTENTS
Currency Swap.................................................................................................................................1
a) Cash flow diagram..............................................................................................................1
b) Cash flow from the swap....................................................................................................1
Real estate investment valuation .....................................................................................................2
a) After tax cash flows............................................................................................................2
b) Proceeds from sale of investment......................................................................................2
c) Investment decision based on returns.................................................................................3
REFERENCES................................................................................................................................4
Document Page
Illustration Index
Illustration 1: Cash flow diagram....................................................................................................1
Index of Tables
Table 1: Cash inflow and outflow from swaps................................................................................1
Table 2: Calculation of cash flow after tax......................................................................................2
Table 3: Calculation of cash flow after tax including proceeds from sale.......................................2
Table 4: Calculation of return percentage........................................................................................3
Document Page
Currency Swap
a) Cash flow diagram
Currency swap is an important activity that takes place between the two parties belonging
to different countries (Kohlscheen and Andrade, 2013). From the above cash flow diagram, it
can be interpreted that, BB will take funds from US at the fixed interest rate, i.e., 9%. Further,
AA will take funds from Australia in Australian dollar at a fixed in interest rate of 7%. The
companies then performed currency swaps and received funds @7% and 9% respectively.
b) Cash flow from the swap
Table 1: Cash inflow and outflow from swaps
Parties Notional
principal
Interest rate
paid
Interest
amount paid
Interest rate
gained
Interest
amount
gained
Cash Inflow /
Outflow
1
Illustration 1: Cash flow diagram
tabler-icon-diamond-filled.svg

Secure Best Marks with AI Grader

Need help grading? Try our AI Grader for instant feedback on your assignments.
Document Page
AA 1000000 7.00% 70000 9.00% 90000 20000
BB 1000000 9.00% 90000 7.00% 70000 -20000
From the above table, it can be interpreted that, the companies have been able to conduct
currency swap which led to gain of 20000 for AA as they paid interest rate of 7% to BB and
received 9% from BB in lieu of it. However, in case of BB, it has faced a loss of 20000 as it
received the currency at 7% and paid 9% to AA.
Real estate investment valuation
a) After tax cash flows
Table 2: Calculation of cash flow after tax
Particulars Year 1 Year 2 Year 3
Purchase cost 7000000
Net operating income 675000 695250 716107.5
Less: Depreciation 200000 200000 200000
EBIT 475000 495250 516107.5
Less: Interest 132300 132300 132300
EBT 342700 362950 383807.5
Less: Tax @ 15% 51405 54442.5 57571.125
Cash flow after tax 291295 308507.5 326236.375
b) Proceeds from sale of investment
Table 3: Calculation of cash flow after tax including proceeds from sale
Particulars Year 3
Net operating income 716107.5
Add: Proceeds from sale of assets 7400000
Less: Purchase cost 7000000
Less: Depreciation 200000
EBIT 916107.5
Less: Interest 132300
2
Document Page
EBT 783807.5
Less: Tax @ 15% 117571.125
Cash flow after tax 666236.375
c) Investment decision based on returns
Table 4: Calculation of return percentage
Returns Amount Return
percentage
Year 1 291295 4.16
Year 2 308507.5 4.41
Year 3 326236.38 4.66
If the investor is expecting 15% return of the investment then it should not make the
investment. The average return indicated above in the table from the above investment happens
to be 4%. Hence, it will not be able to satisfy the expectations of the investor.
3
Document Page
REFERENCES
Kohlscheen, E. and Andrade, S. C., 2013. Official Interventions through Derivatives: affecting
the demand for foreign exchange (No. 317).
4
chevron_up_icon
1 out of 7
circle_padding
hide_on_mobile
zoom_out_icon
[object Object]