ITECH7407 - Real Time Analytics: Data Analysis and Report
VerifiedAdded on 2023/01/12
|28
|4130
|47
Report
AI Summary
This report provides a comprehensive analysis of real-time analytics using SAP HANA, focusing on data mining techniques to understand unintentional poisoning data from the United States between 2000 and 2016. The report begins with an introduction to the project, the dataset, and the tools used. It then details the data modeling and provisioning process, including the use of SAP HANA studio to import and organize the data. The core of the report covers data mining, specifically cluster analysis, and discusses various algorithms like centroid-based, distributed-based, and connectivity-based methods. The research section delves into unintentional injuries, their causes, and risk factors, with a focus on poisonings and burn-related injuries in LMICs. The report concludes with recommendations for a CEO, a cover letter, and a conclusion summarizing the findings. References are provided to support the analysis.
Real time analytics
Paraphrase This Document
Need a fresh take? Get an instant paraphrase of this document with our AI Paraphraser
Contents
Contents...........................................................................................................................................1
I. Introduction..............................................................................................................................2
II. Data Modelling and Provisioning............................................................................................2
III. Data Mining..........................................................................................................................5
IV. Research................................................................................................................................7
V. Recommendations for CEO...................................................................................................23
VI. Cover Letter........................................................................................................................24
VII. Conclusion..........................................................................................................................25
VIII. References.......................................................................................................................26
pg. 1
I. Introduction
The report is made for the NCLT Corporation, at Balmoral. The Real time Analytics
which
uses the SAP HANA web based tool. The Dataset which explains about the unintentional
poisoning that leads to the death of the people. United States suffers more because of this
illegal activities of the drugs in the year 2000--2016.these are the year where the death is
increased. According to the WHO data, in 2012 an estimated 193,460 people died worldwide
from the unintentional poisoning. This caused the loss of over 10.7 million years of healthy life.
For example, it is estimated that deliberate ingestion of pesticides causes 370,000 deaths each
year. The number of these deaths can be decreased by having the small availability of, and
access
to, highly toxic pesticides.
The SAP HANA Web-based development toolset is used to find the Data Analytics. It is
a statistical tool for analysis and to find the connection between the data. The preparation of the
data and modeling data is made using the SAP tool. The process in preparation of data contains
combination, structure and organizing the data. It is most probably a single database table or
statistical data. It defines the nature and attribute of the field on the dataset table (Fabiane, 2012).
The main attribute in the dataset is fields. Field describes the type of data reserved in the table.
The information is about the project Country, year of female, male and both the sexes. The
content has researches, observations made, Data mining and finding of the data.
II. Data Modelling and Provisioning
The data modeling process generally consists of the data cleansing and data organizing
process. The first step is to arrange the data set for analysis (M., M., K. & S., 2018). Here the
invalid rows and columns are removed. SAP HANA studio allows users to carry out this activity.
In the below section the step by step procedures for data modeling and provisioning are
discussed.
pg. 2
⊘ This is a preview!⊘
Do you want full access?
Subscribe today to unlock all pages.
Trusted by 1+ million students worldwide
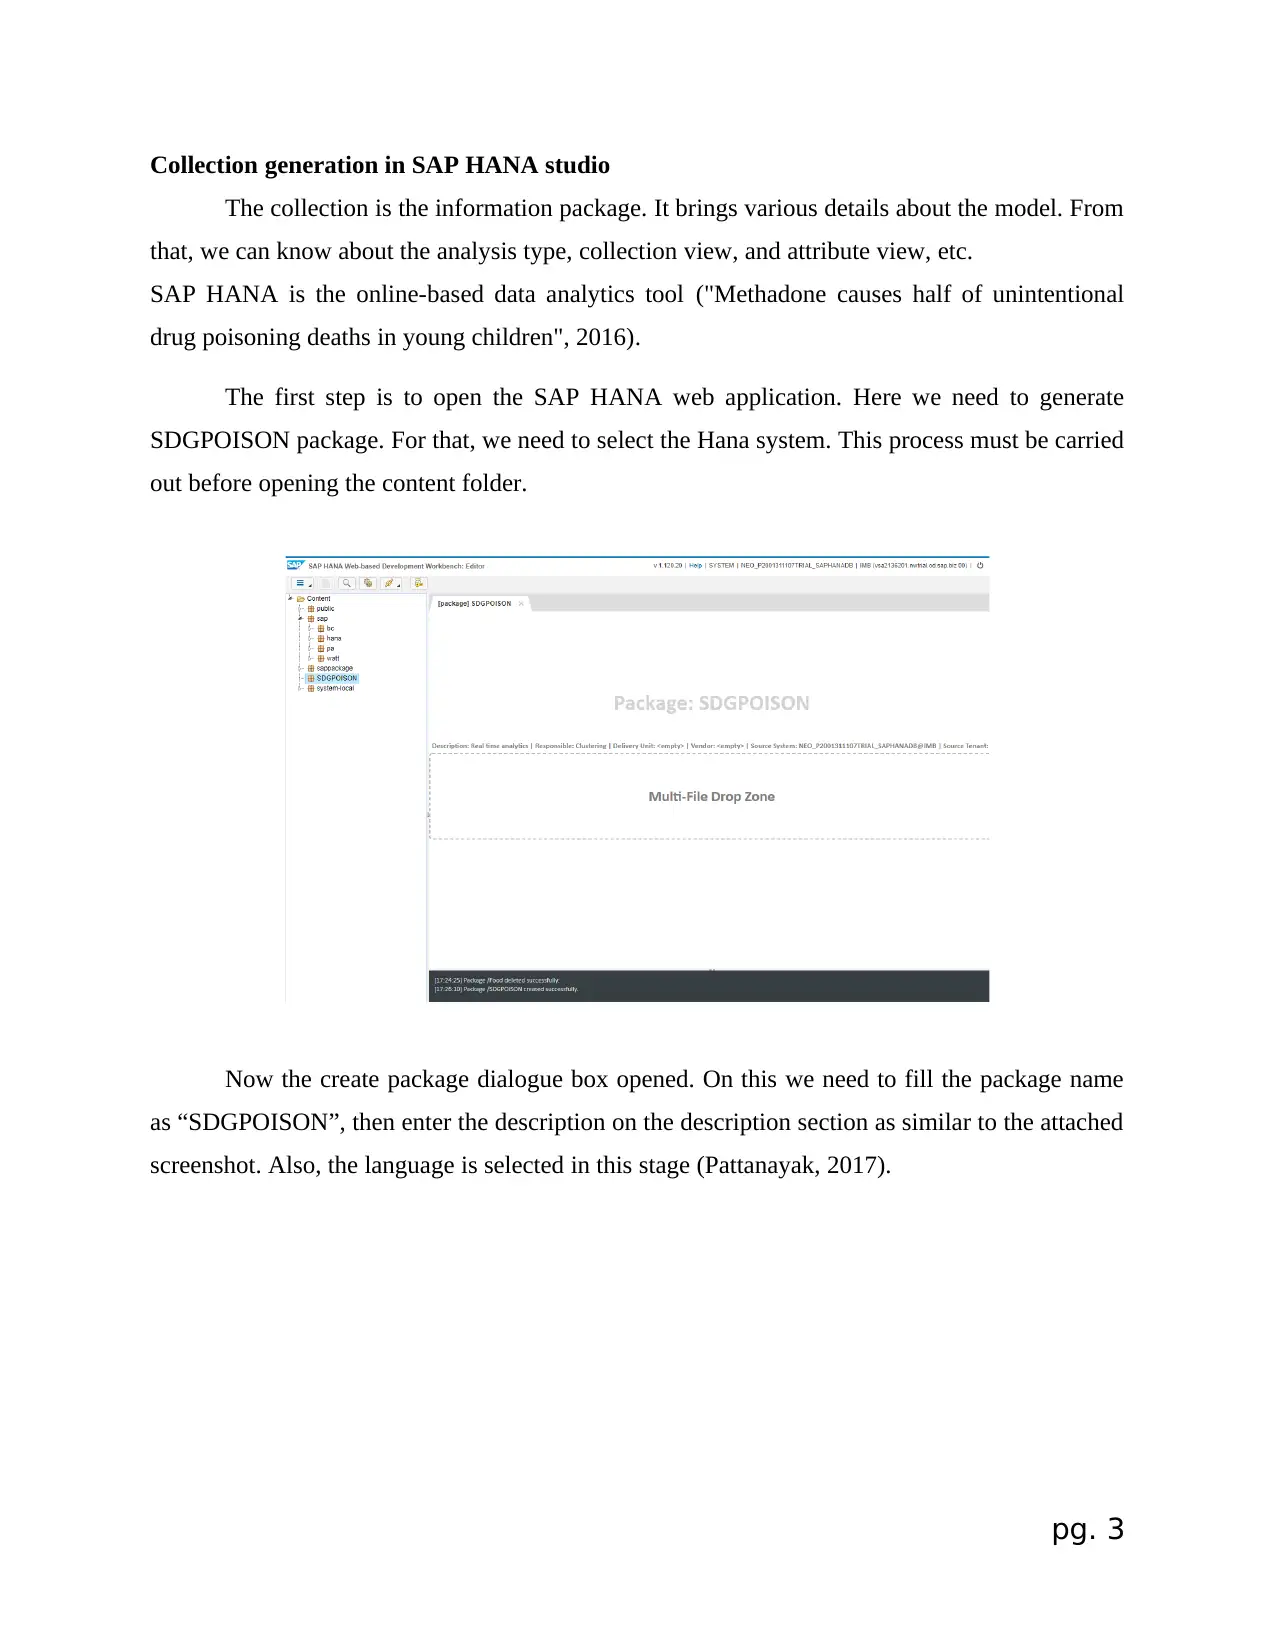
Collection generation in SAP HANA studio
The collection is the information package. It brings various details about the model. From
that, we can know about the analysis type, collection view, and attribute view, etc.
SAP HANA is the online-based data analytics tool ("Methadone causes half of unintentional
drug poisoning deaths in young children", 2016).
The first step is to open the SAP HANA web application. Here we need to generate
SDGPOISON package. For that, we need to select the Hana system. This process must be carried
out before opening the content folder.
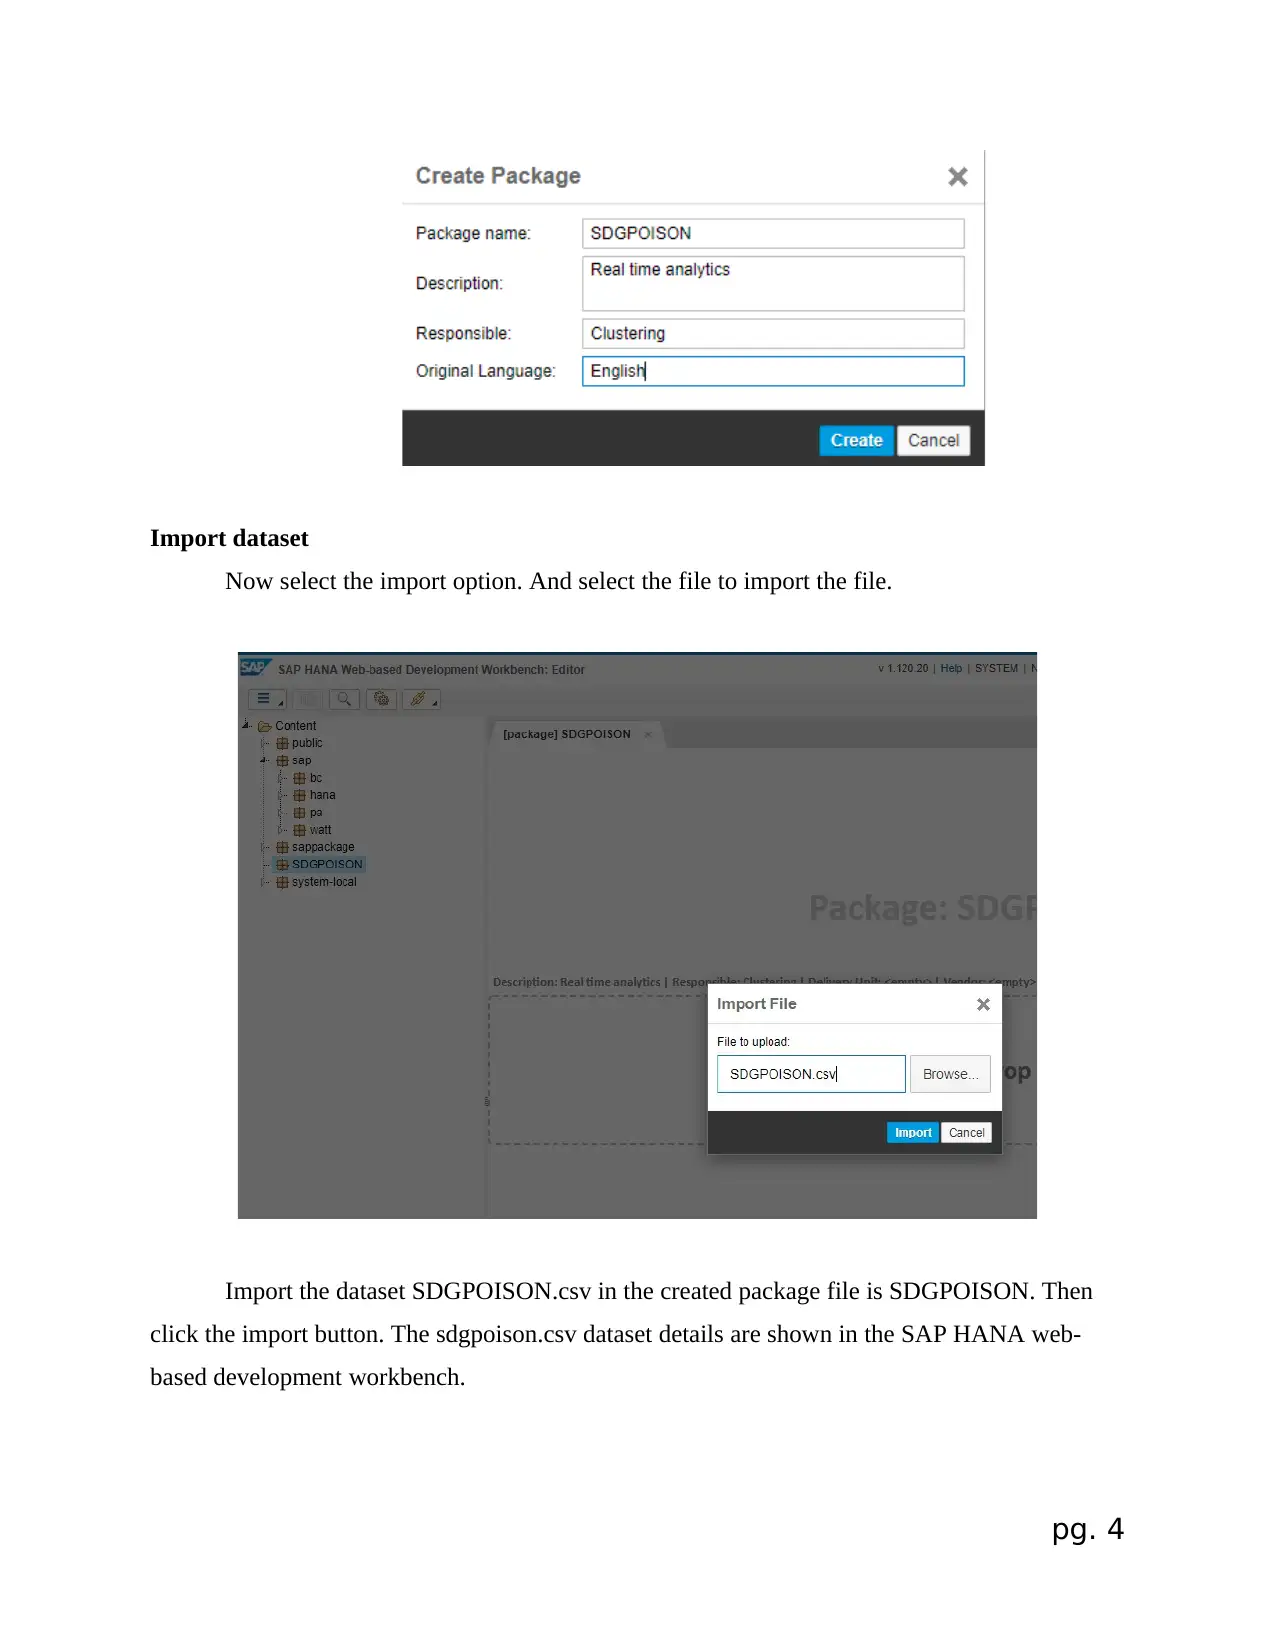
Now the create package dialogue box opened. On this we need to fill the package name
as “SDGPOISON”, then enter the description on the description section as similar to the attached
screenshot. Also, the language is selected in this stage (Pattanayak, 2017).
pg. 3
The collection is the information package. It brings various details about the model. From
that, we can know about the analysis type, collection view, and attribute view, etc.
SAP HANA is the online-based data analytics tool ("Methadone causes half of unintentional
drug poisoning deaths in young children", 2016).
The first step is to open the SAP HANA web application. Here we need to generate
SDGPOISON package. For that, we need to select the Hana system. This process must be carried
out before opening the content folder.
Now the create package dialogue box opened. On this we need to fill the package name
as “SDGPOISON”, then enter the description on the description section as similar to the attached
screenshot. Also, the language is selected in this stage (Pattanayak, 2017).
pg. 3
Paraphrase This Document
Need a fresh take? Get an instant paraphrase of this document with our AI Paraphraser
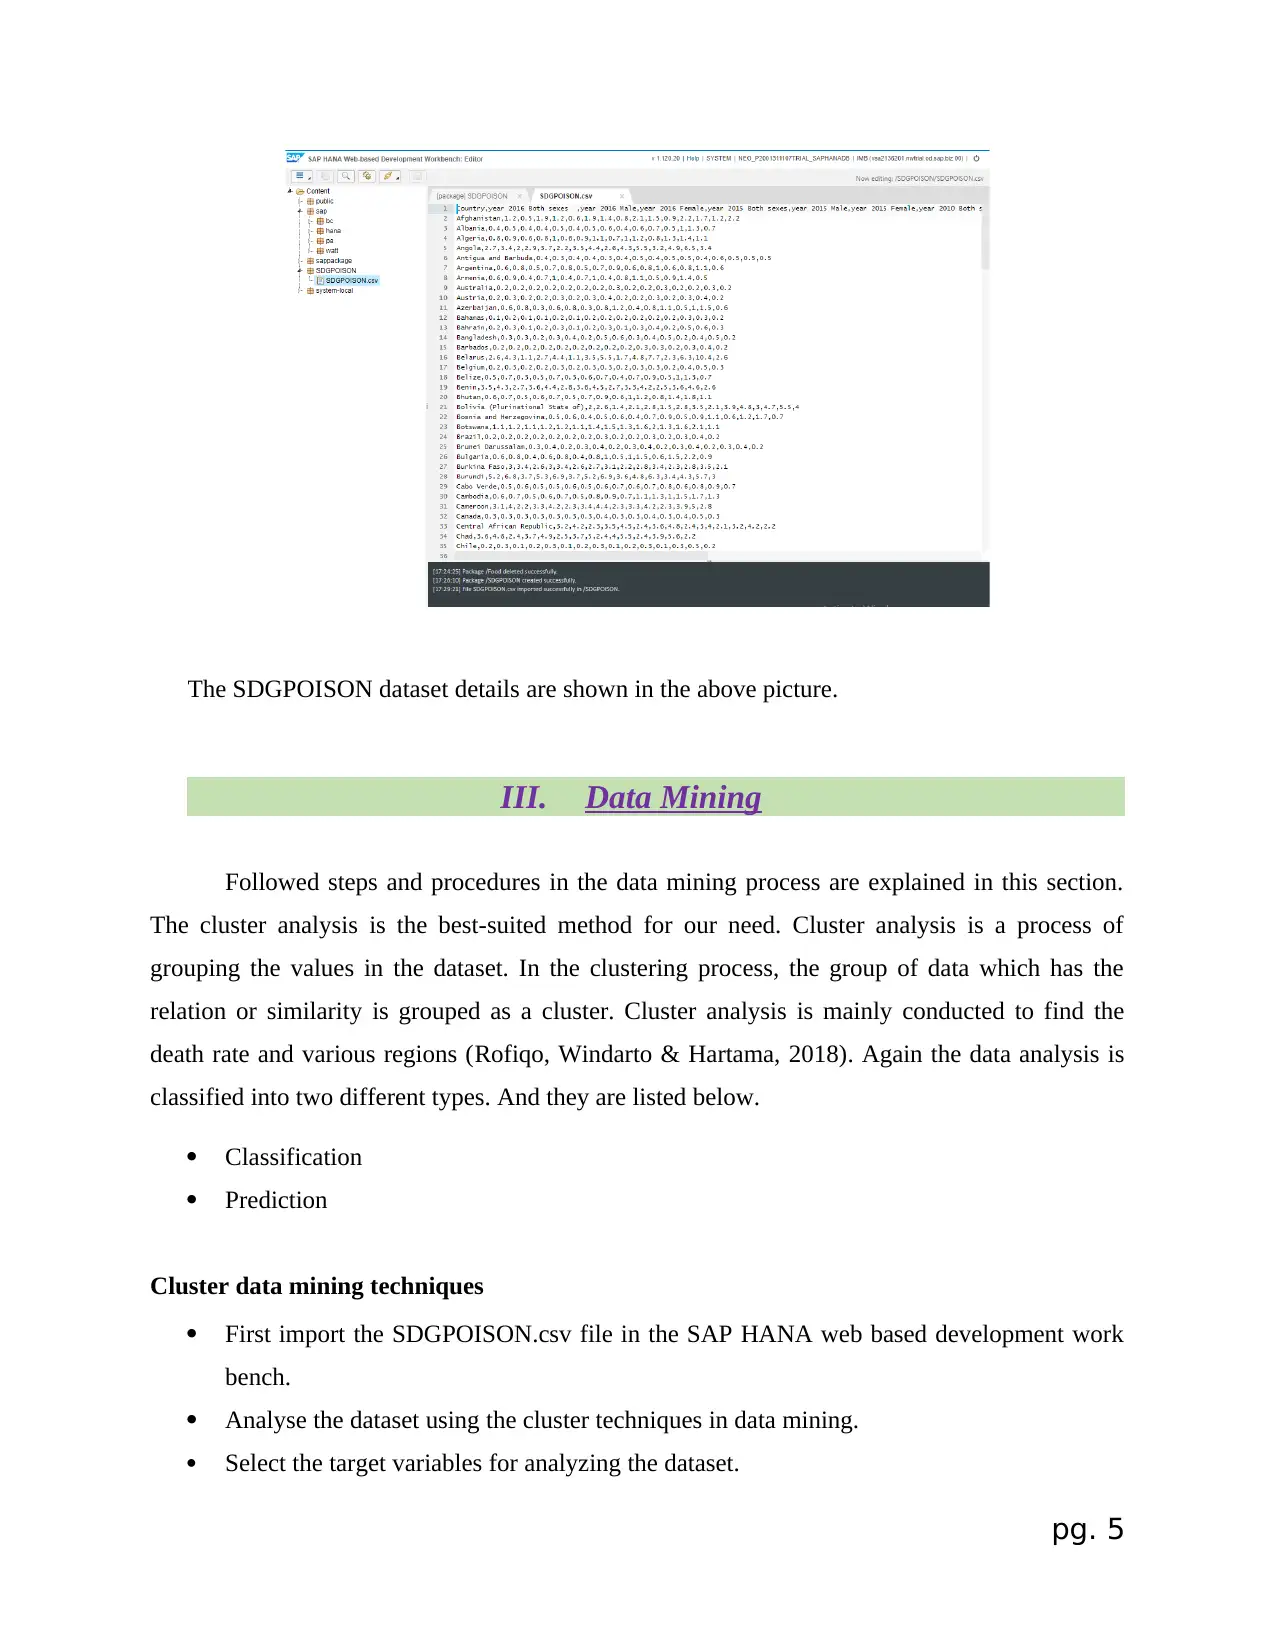
Import dataset
Now select the import option. And select the file to import the file.
Import the dataset SDGPOISON.csv in the created package file is SDGPOISON. Then
click the import button. The sdgpoison.csv dataset details are shown in the SAP HANA web-
based development workbench.
pg. 4
Now select the import option. And select the file to import the file.
Import the dataset SDGPOISON.csv in the created package file is SDGPOISON. Then
click the import button. The sdgpoison.csv dataset details are shown in the SAP HANA web-
based development workbench.
pg. 4
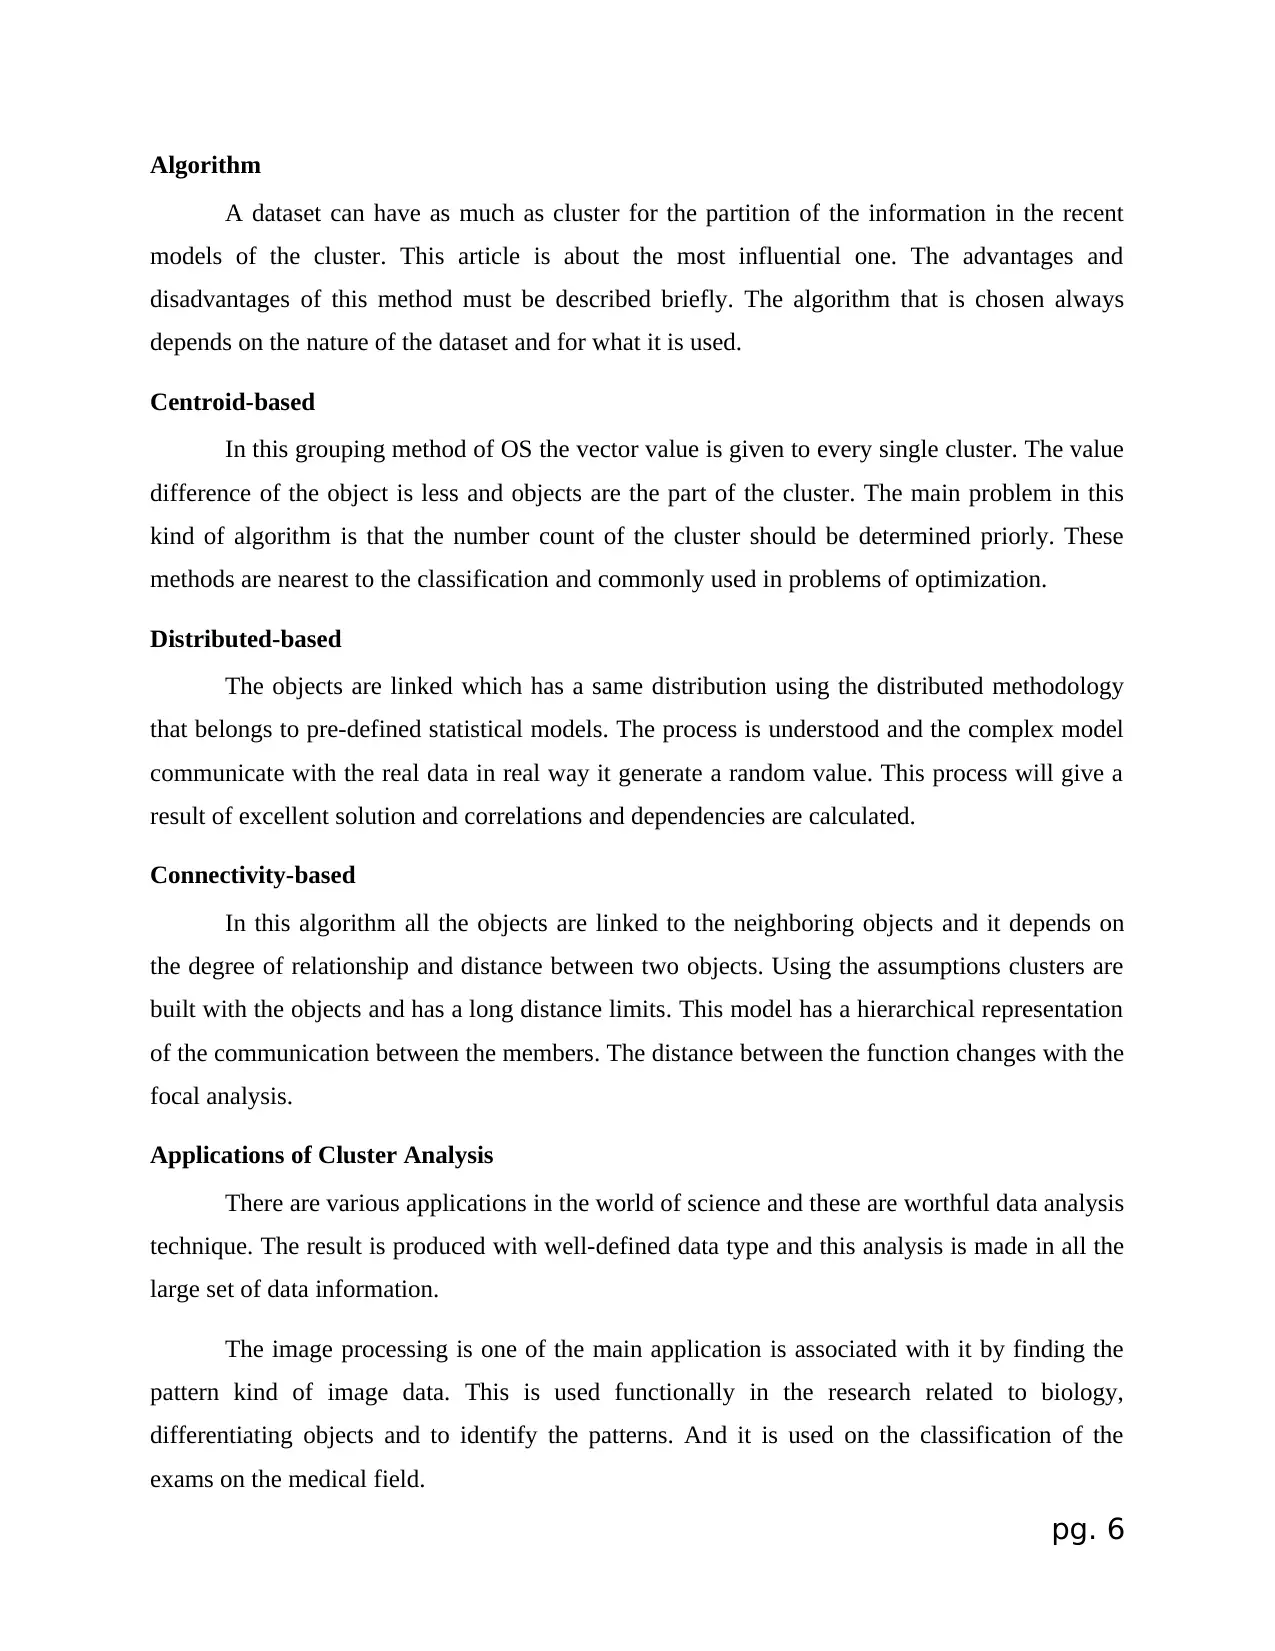
The SDGPOISON dataset details are shown in the above picture.
III. Data Mining
Followed steps and procedures in the data mining process are explained in this section.
The cluster analysis is the best-suited method for our need. Cluster analysis is a process of
grouping the values in the dataset. In the clustering process, the group of data which has the
relation or similarity is grouped as a cluster. Cluster analysis is mainly conducted to find the
death rate and various regions (Rofiqo, Windarto & Hartama, 2018). Again the data analysis is
classified into two different types. And they are listed below.
Classification
Prediction
Cluster data mining techniques
First import the SDGPOISON.csv file in the SAP HANA web based development work
bench.
Analyse the dataset using the cluster techniques in data mining.
Select the target variables for analyzing the dataset.
pg. 5
⊘ This is a preview!⊘
Do you want full access?
Subscribe today to unlock all pages.
Trusted by 1+ million students worldwide
Algorithm
A dataset can have as much as cluster for the partition of the information in the recent
models of the cluster. This article is about the most influential one. The advantages and
disadvantages of this method must be described briefly. The algorithm that is chosen always
depends on the nature of the dataset and for what it is used.
Centroid-based
In this grouping method of OS the vector value is given to every single cluster. The value
difference of the object is less and objects are the part of the cluster. The main problem in this
kind of algorithm is that the number count of the cluster should be determined priorly. These
methods are nearest to the classification and commonly used in problems of optimization.
Distributed-based
The objects are linked which has a same distribution using the distributed methodology
that belongs to pre-defined statistical models. The process is understood and the complex model
communicate with the real data in real way it generate a random value. This process will give a
result of excellent solution and correlations and dependencies are calculated.
Connectivity-based
In this algorithm all the objects are linked to the neighboring objects and it depends on
the degree of relationship and distance between two objects. Using the assumptions clusters are
built with the objects and has a long distance limits. This model has a hierarchical representation
of the communication between the members. The distance between the function changes with the
focal analysis.
Applications of Cluster Analysis
There are various applications in the world of science and these are worthful data analysis
technique. The result is produced with well-defined data type and this analysis is made in all the
large set of data information.
The image processing is one of the main application is associated with it by finding the
pattern kind of image data. This is used functionally in the research related to biology,
differentiating objects and to identify the patterns. And it is used on the classification of the
exams on the medical field.
pg. 6
Paraphrase This Document
Need a fresh take? Get an instant paraphrase of this document with our AI Paraphraser
The personal data of place, regards, shopping, operations, and a number of desired works
are analyzed using these methodologies and it gives the key information and the trends. The web
analytics, strategies on marketing, researches on the market and all other works.
The other applications are recommender systems, mathematics and statistics analysis,
robotics, climatology and it provides utilization for broad spectrum.
IV. Research
Unintentional Injuries
This chapter defines about the affairs of the unintentional injuries and is based on the
selected number of causes of that injuries.it is also defined as a damage of a person who is
caused an acute transfer of energy otherwise, or it happens in the sudden absence in the heart.
This injury consists of a subset of injuries in pre-determined intent. WHO (World Health
Organization) examined unintentional injuries. It includes causes, burdens and Risk factor of
poisonings.
Burden of Unintentional injuries
In the worldwide, the unintentional injuries are justified more than 3.5 million deaths in
2005 or about 6 percent of all deaths and 66 percent of deaths. And more than that 113 million
DALY in 2005. Males clarified almost two-thirds of the deaths (LMIC in 2005). From the
unintentional injuries are accounted 15 to 29 of young peoples.
pg. 7
Causes of Unintentional Injuries in LMICs
Most of the disease are caused by Multiple factors. The ideas are prototyped in the host,
vector and environmental factors have been adapted and utilized in the causes. In each factor, it
relates to the time of injury (before and after). While the matrix is also known as Haddon Matrix,
who initially developed the problems in the addresses of RTIs and it reaches the multiple factors
in the injury.
In the past, the proof of the identification factors is in high-income countries (HICs)
which have increased the number of injury researchers and the Research Institution. LMICs
shows the scarcity of the research injury for the identification of these countries is growing
slowly.
Risk Factors for Poisonings
The LMICs contains brief information about the desirable poisoning that has importation
information about the occupations that are related to poisoning may be with pesticide poisoning
and the information assists to the lead poisoning. And these poisons are covered that is absent on
the book. This chapter is about the risk taken on the types of poisons in LMICs and risk is on the
poisoning of the children with a young age.
The literature is about the danger faced on the childhood poisoning that in turn shows the
victims of child poisoning are noted to be more than the adult in the hospitals. The fact here is
exactly opposite to the presented data that reveals the mid-aged separate persons are large in the
count of death and LMICs poisoning on Daly’s. The count says the supreme need of work-
related poisonings.
Males who are young have an increased danger on poisoning than the females. The
paraffin in most commonly used as an agent for childhood poisoning. The other agents that are
related to households are pesticides, chemicals, plants, and animals. The need for the number of
sociodemographic dangers includes supervision of adults, lonely residence and young parents in
lmic's. The previous poisoning can also be a dangerous factor that is reported by some studies.
The other factors are the storage of the multiple numbers of containers in the residence and the
usage of nonstandard containers and storing the poison on the ground level.
pg. 8
⊘ This is a preview!⊘
Do you want full access?
Subscribe today to unlock all pages.
Trusted by 1+ million students worldwide
Risk Factors for Burn-related Injuries
There numerous country-specific surveys that are conducted by the medical team says
that injuries are made by using the hot water is moreover equal to the injuries caused by the fire
burns. The countries like India and China the injuries on fire are greater than the scald related
injuries.
On the overall bases, the fire burned injuries of women is higher at risk than the men. The
data surveyed is based on the population and the survey of the medical center says that males are
higher at risk than the women that excludes India. While studying the survey young children are
at a high rate on the burn-related injuries than the other group age. The risk factor in rural areas
is compatible with burn-related injuries at the home (Tang et al., 2017).
The identification of the danger and factors that prevent burn-related injuries on Asia,
Africa, and South America are undertaken by the investigators. And it focuses on the children.
The factor that increases the risk is no water supply, storing the flammable substances in the
home, keeping the tools or equipment used on the kitchen in the children reachable distance and
living at the slums and overcrowded area. The persons with social or personal problems have a
risk factors like the child which is not first born, mothers who are pregnant, mother who had a
dismissal of job, the person who had a siblings died of burn or seen a burn, illiterate parents,
parent with no alert to the burn, and families with lower in status. The factors are to be protective
are being a presence in the living room, giving maternal education and the study of injuries of
other males who lived in the good condition and environment.
pg. 9
Paraphrase This Document
Need a fresh take? Get an instant paraphrase of this document with our AI Paraphraser
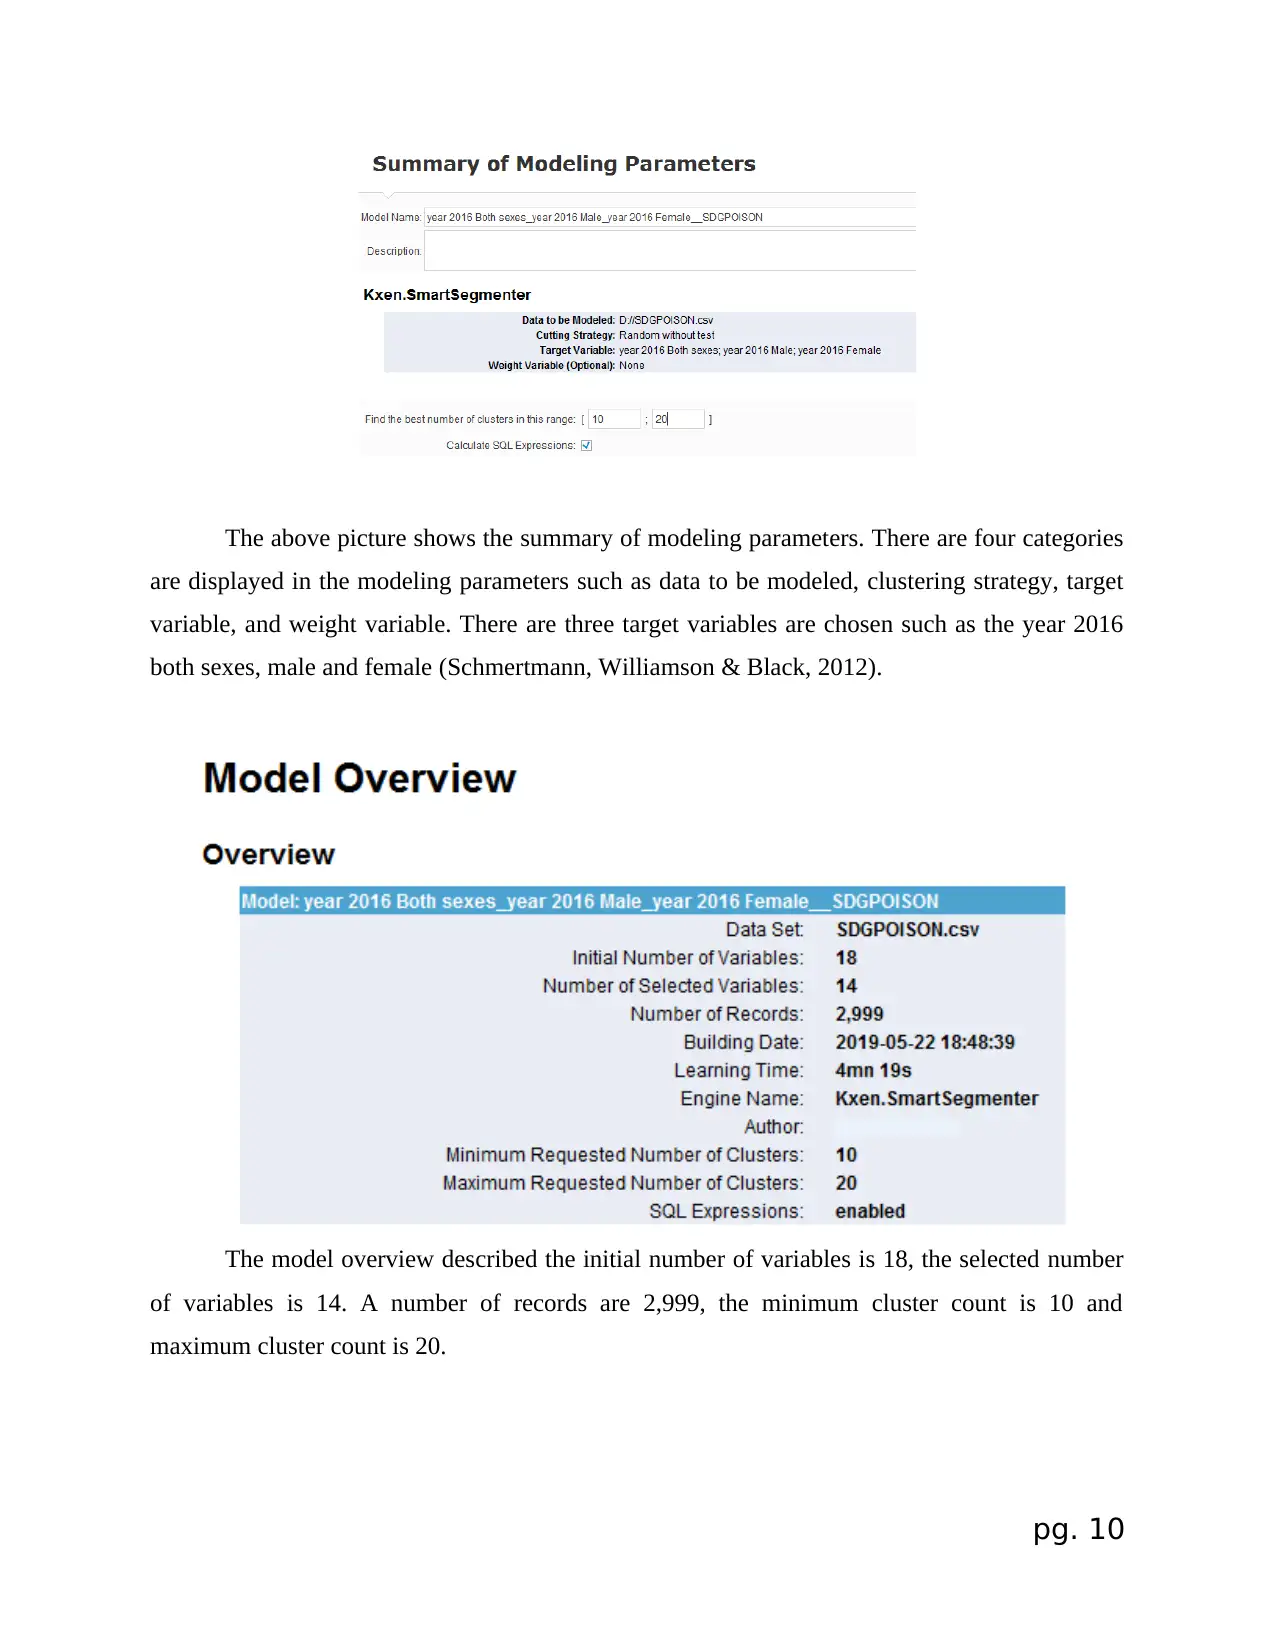
The above picture shows the summary of modeling parameters. There are four categories
are displayed in the modeling parameters such as data to be modeled, clustering strategy, target
variable, and weight variable. There are three target variables are chosen such as the year 2016
both sexes, male and female (Schmertmann, Williamson & Black, 2012).
The model overview described the initial number of variables is 18, the selected number
of variables is 14. A number of records are 2,999, the minimum cluster count is 10 and
maximum cluster count is 20.
pg. 10
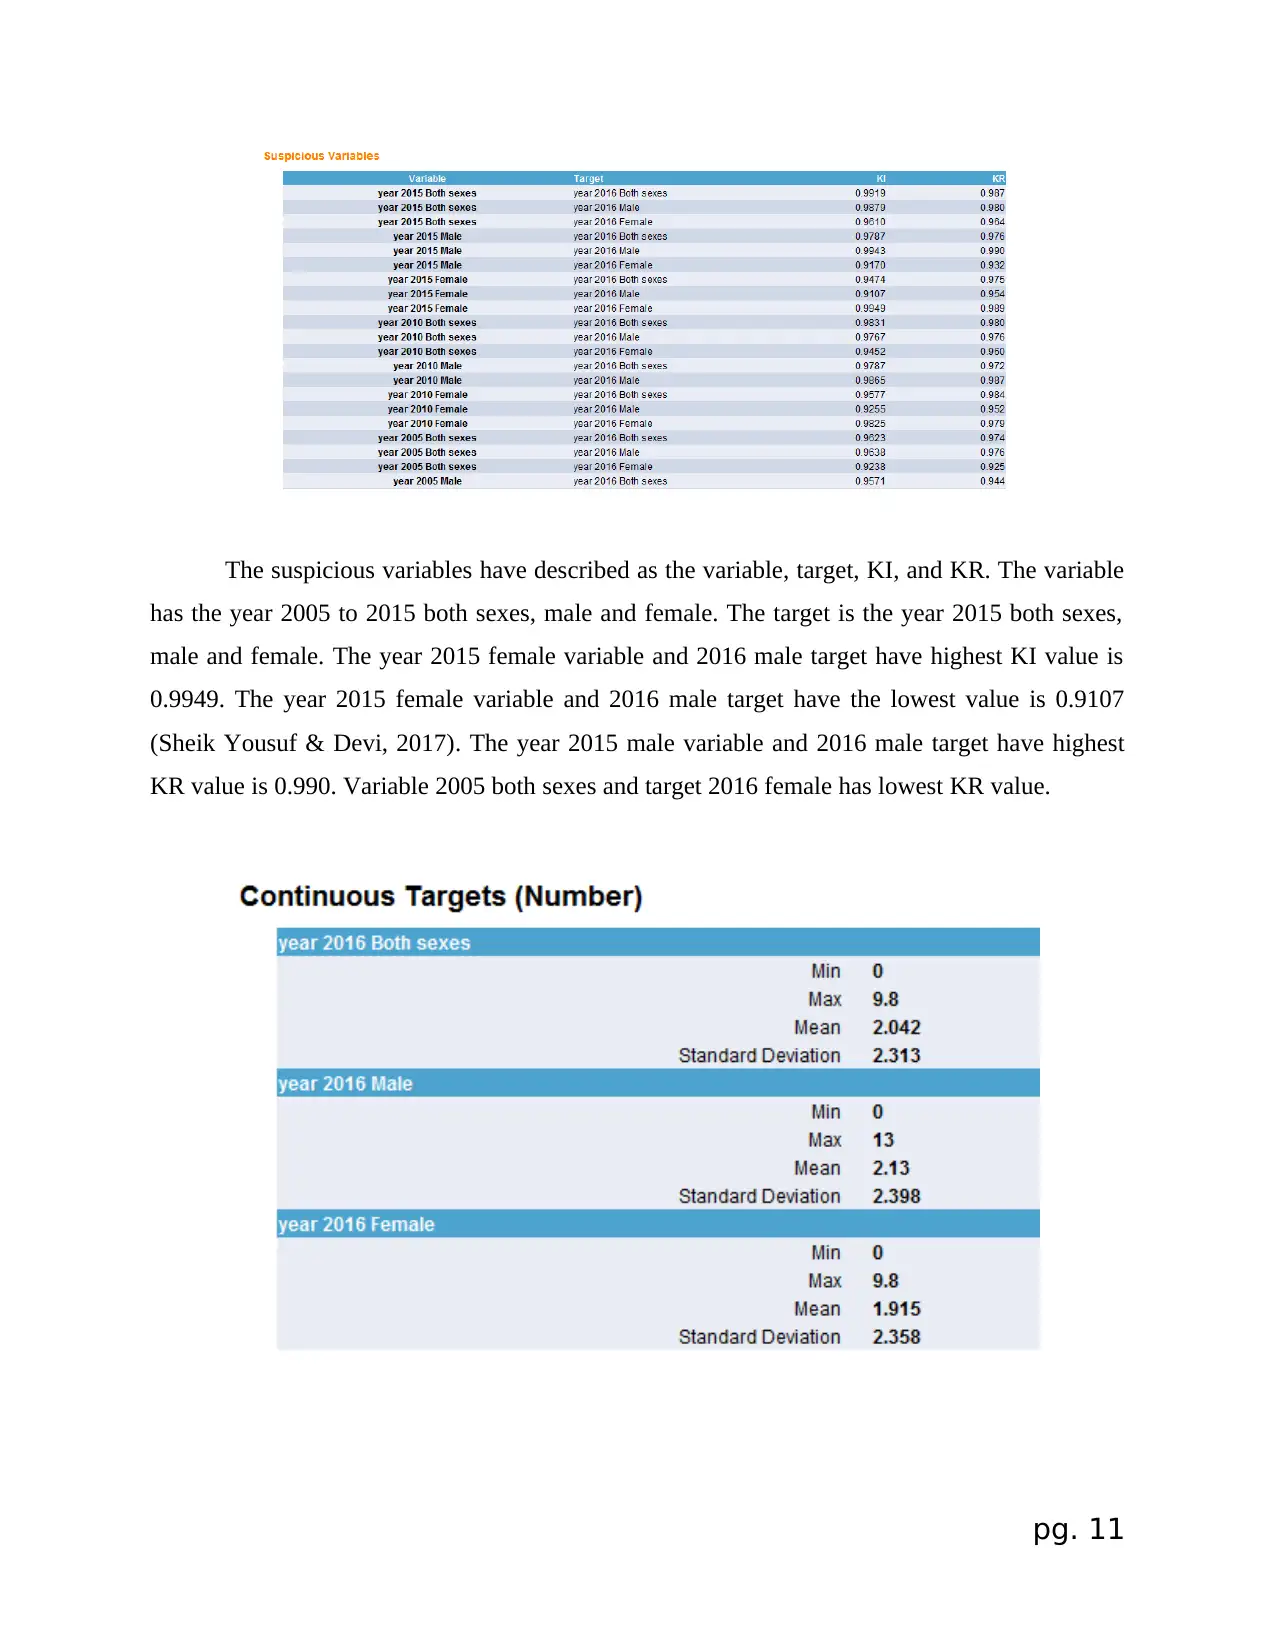
The suspicious variables have described as the variable, target, KI, and KR. The variable
has the year 2005 to 2015 both sexes, male and female. The target is the year 2015 both sexes,
male and female. The year 2015 female variable and 2016 male target have highest KI value is
0.9949. The year 2015 female variable and 2016 male target have the lowest value is 0.9107
(Sheik Yousuf & Devi, 2017). The year 2015 male variable and 2016 male target have highest
KR value is 0.990. Variable 2005 both sexes and target 2016 female has lowest KR value.
pg. 11
⊘ This is a preview!⊘
Do you want full access?
Subscribe today to unlock all pages.
Trusted by 1+ million students worldwide
1 out of 28


Your All-in-One AI-Powered Toolkit for Academic Success.
+13062052269
info@desklib.com
Available 24*7 on WhatsApp / Email
![[object Object]](/_next/static/media/star-bottom.7253800d.svg)
Unlock your academic potential
Copyright © 2020–2026 A2Z Services. All Rights Reserved. Developed and managed by ZUCOL.