ITECH7410 - Real-Time System Analysis: Software Engineering Report

Verified

Added on  2023/06/07

|8
|1002
|488
Report
AI Summary
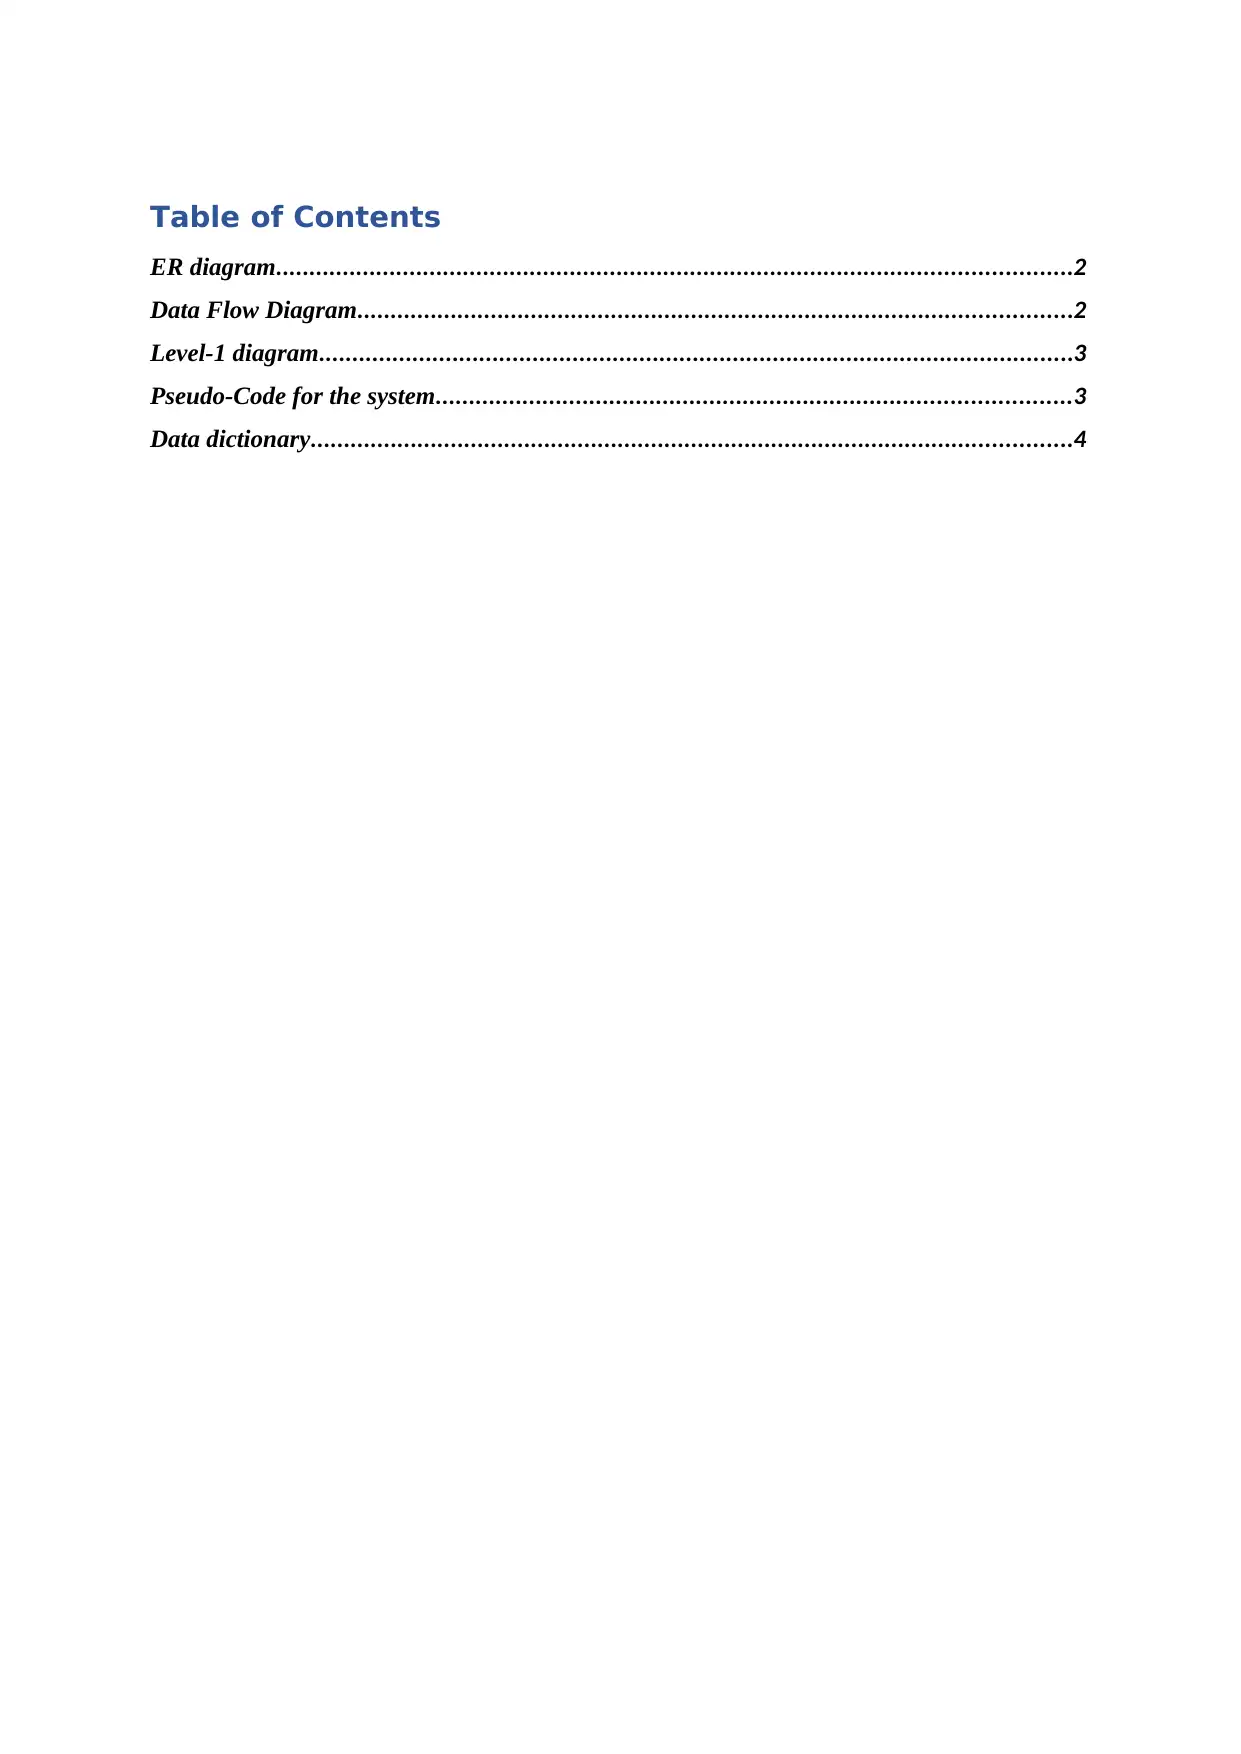
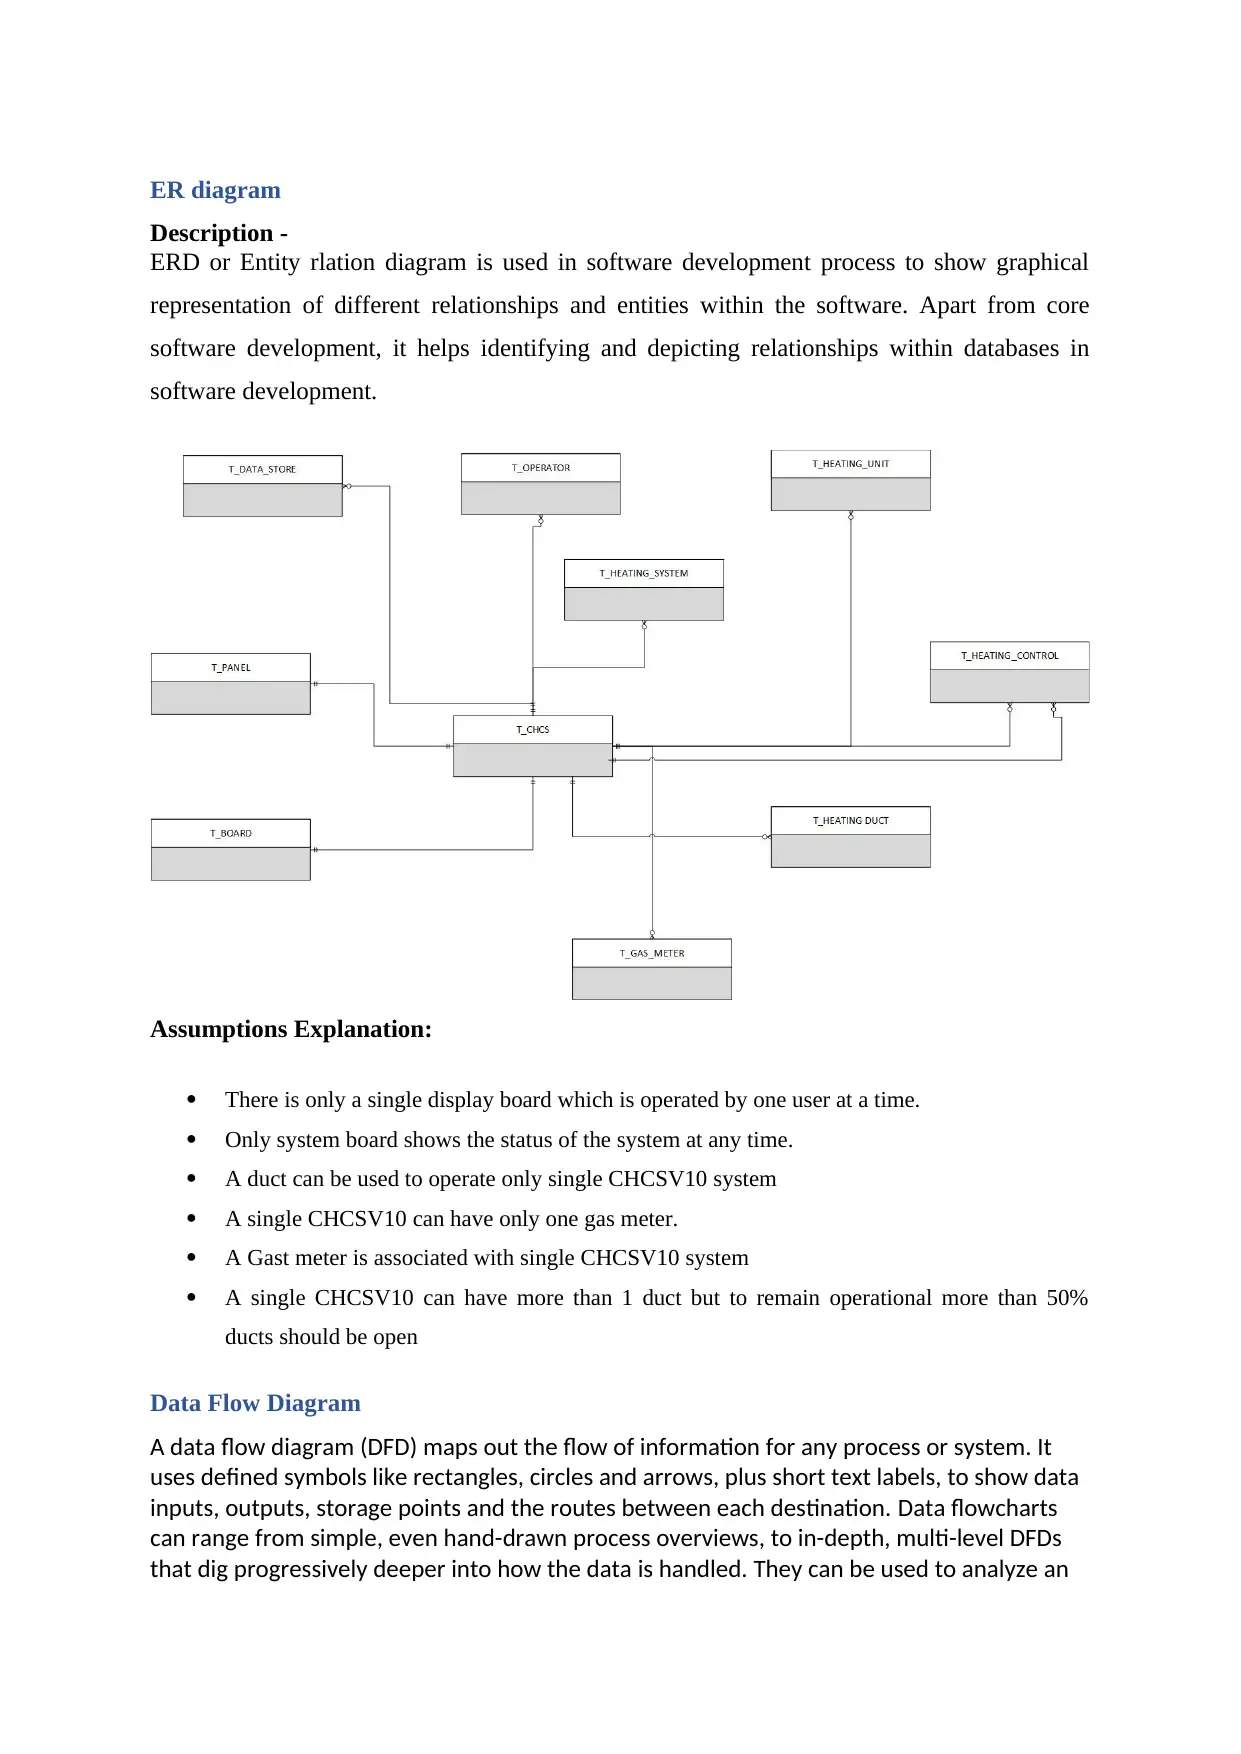
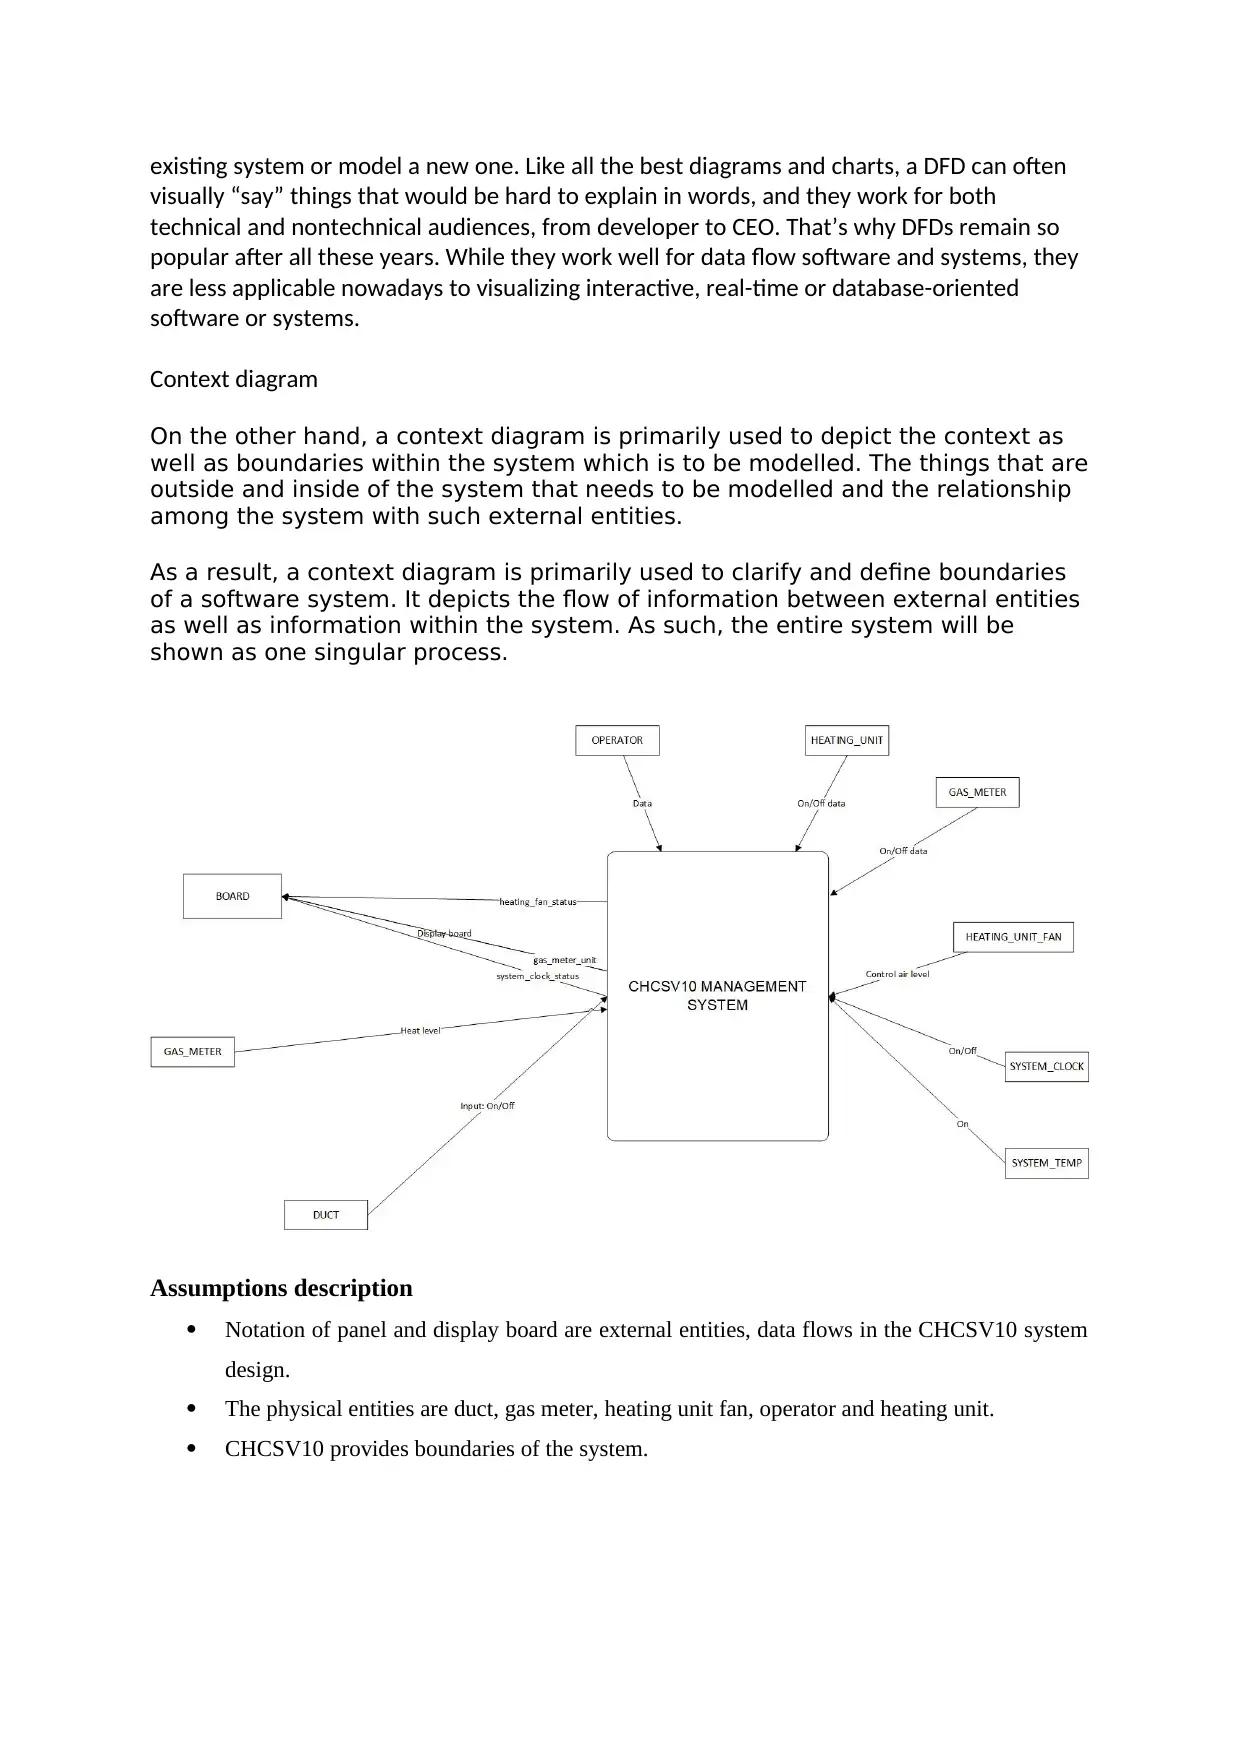
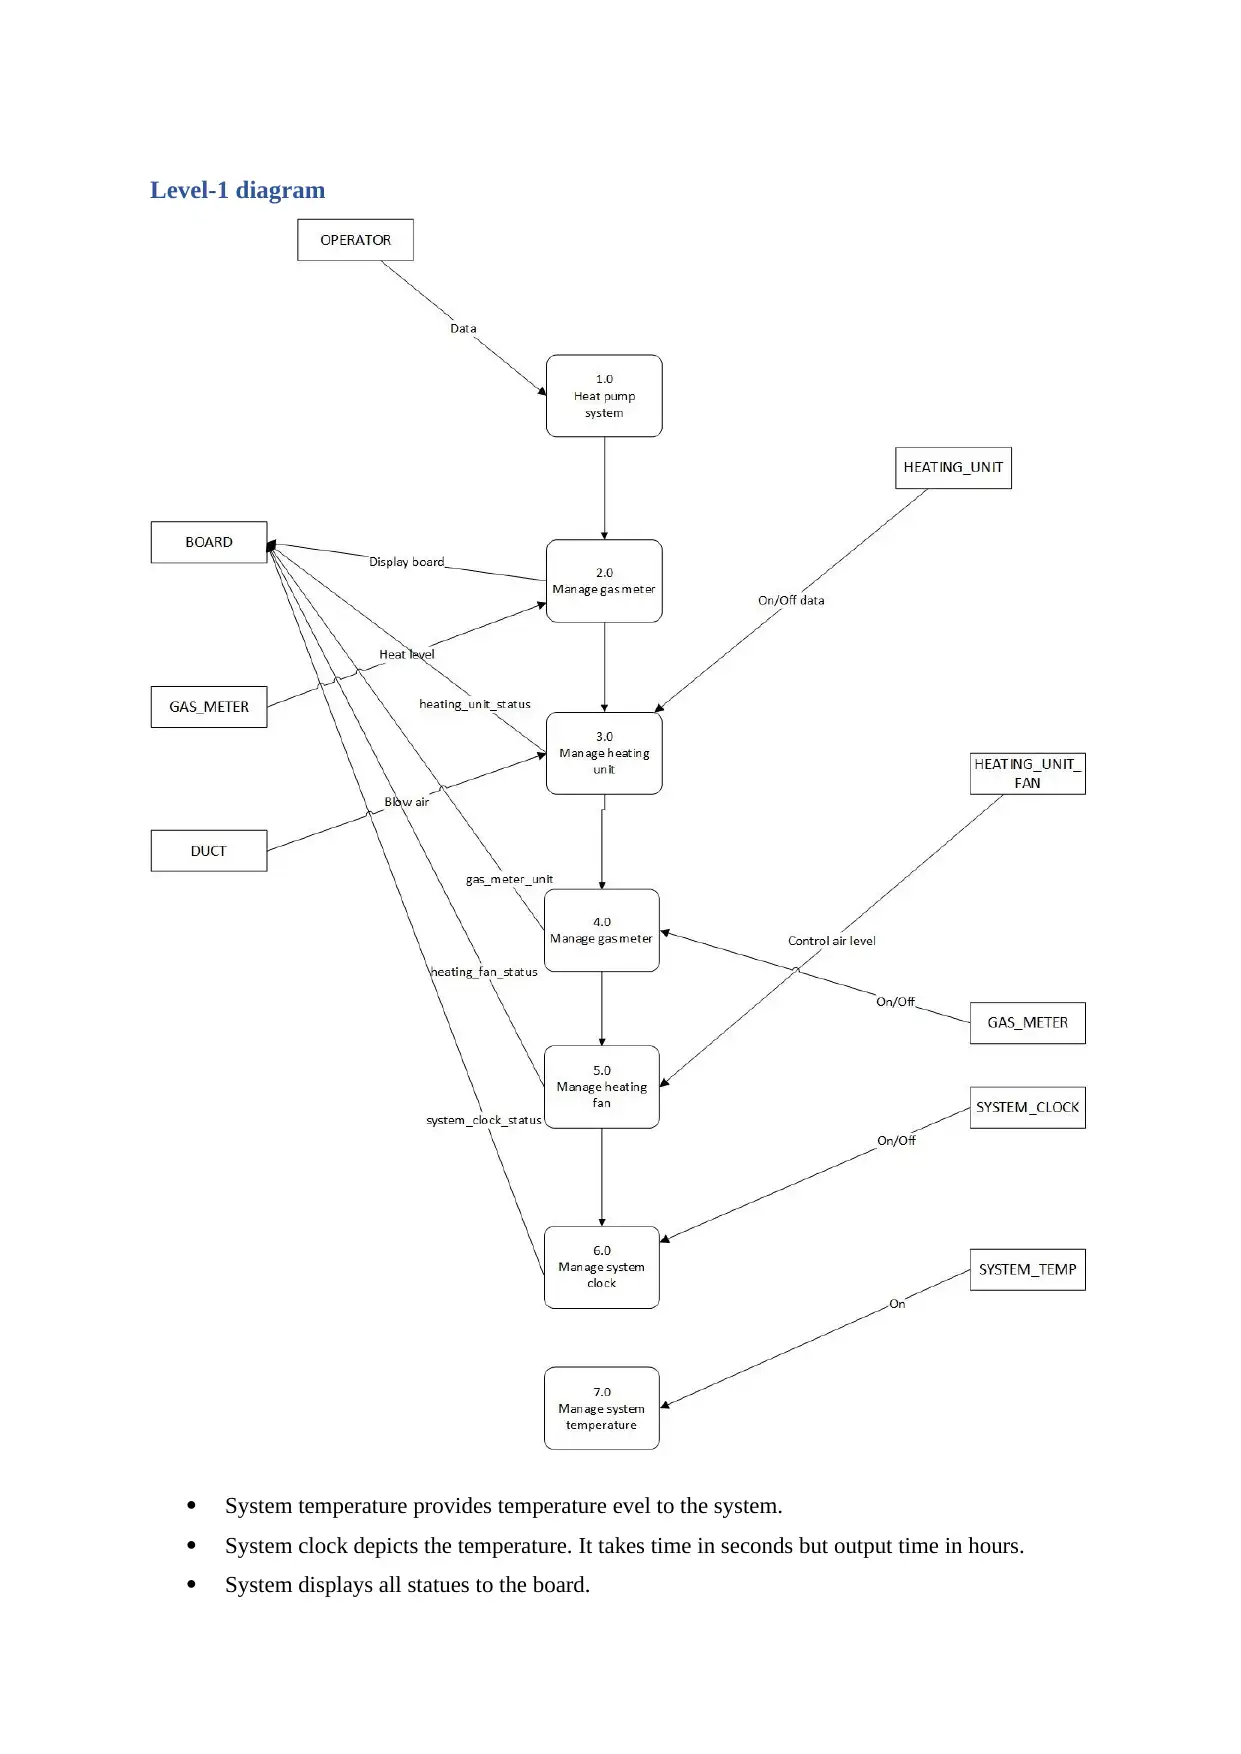
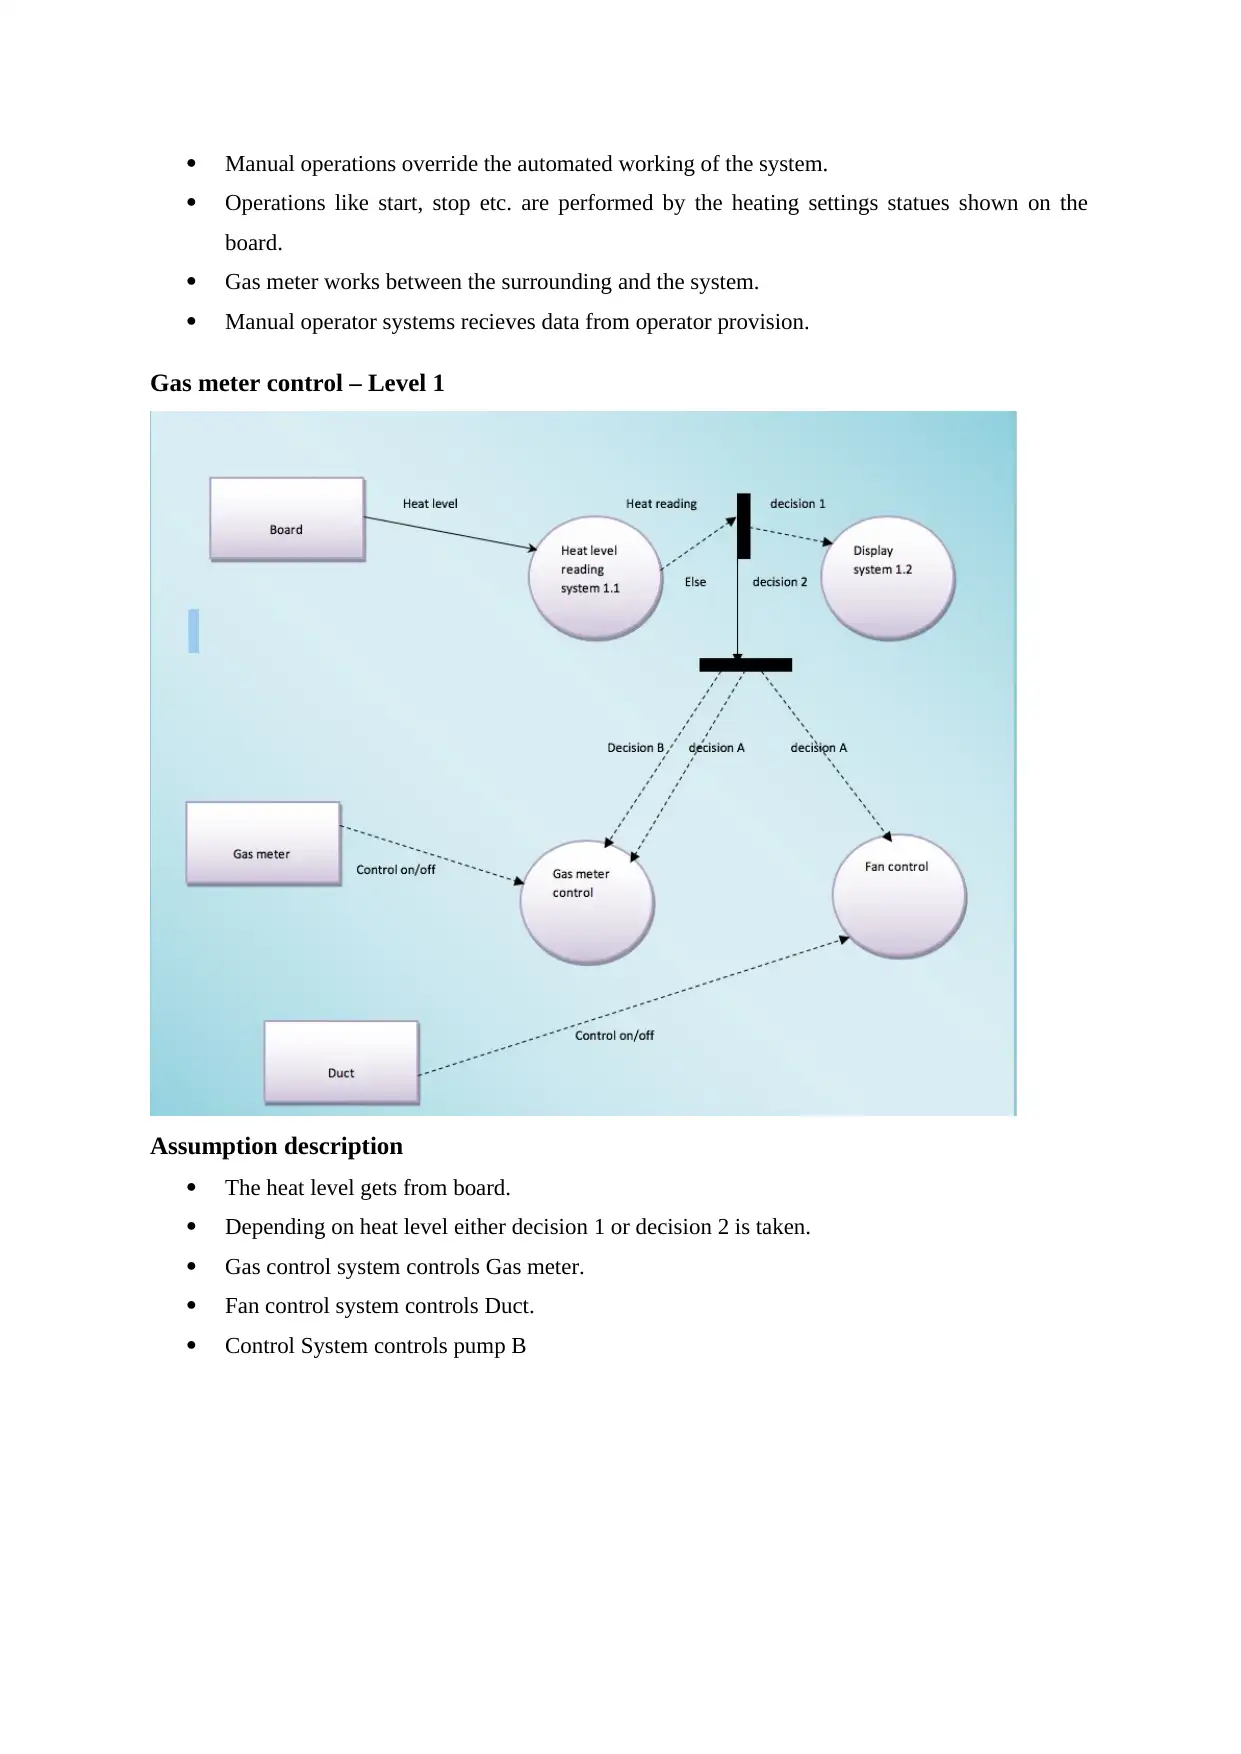
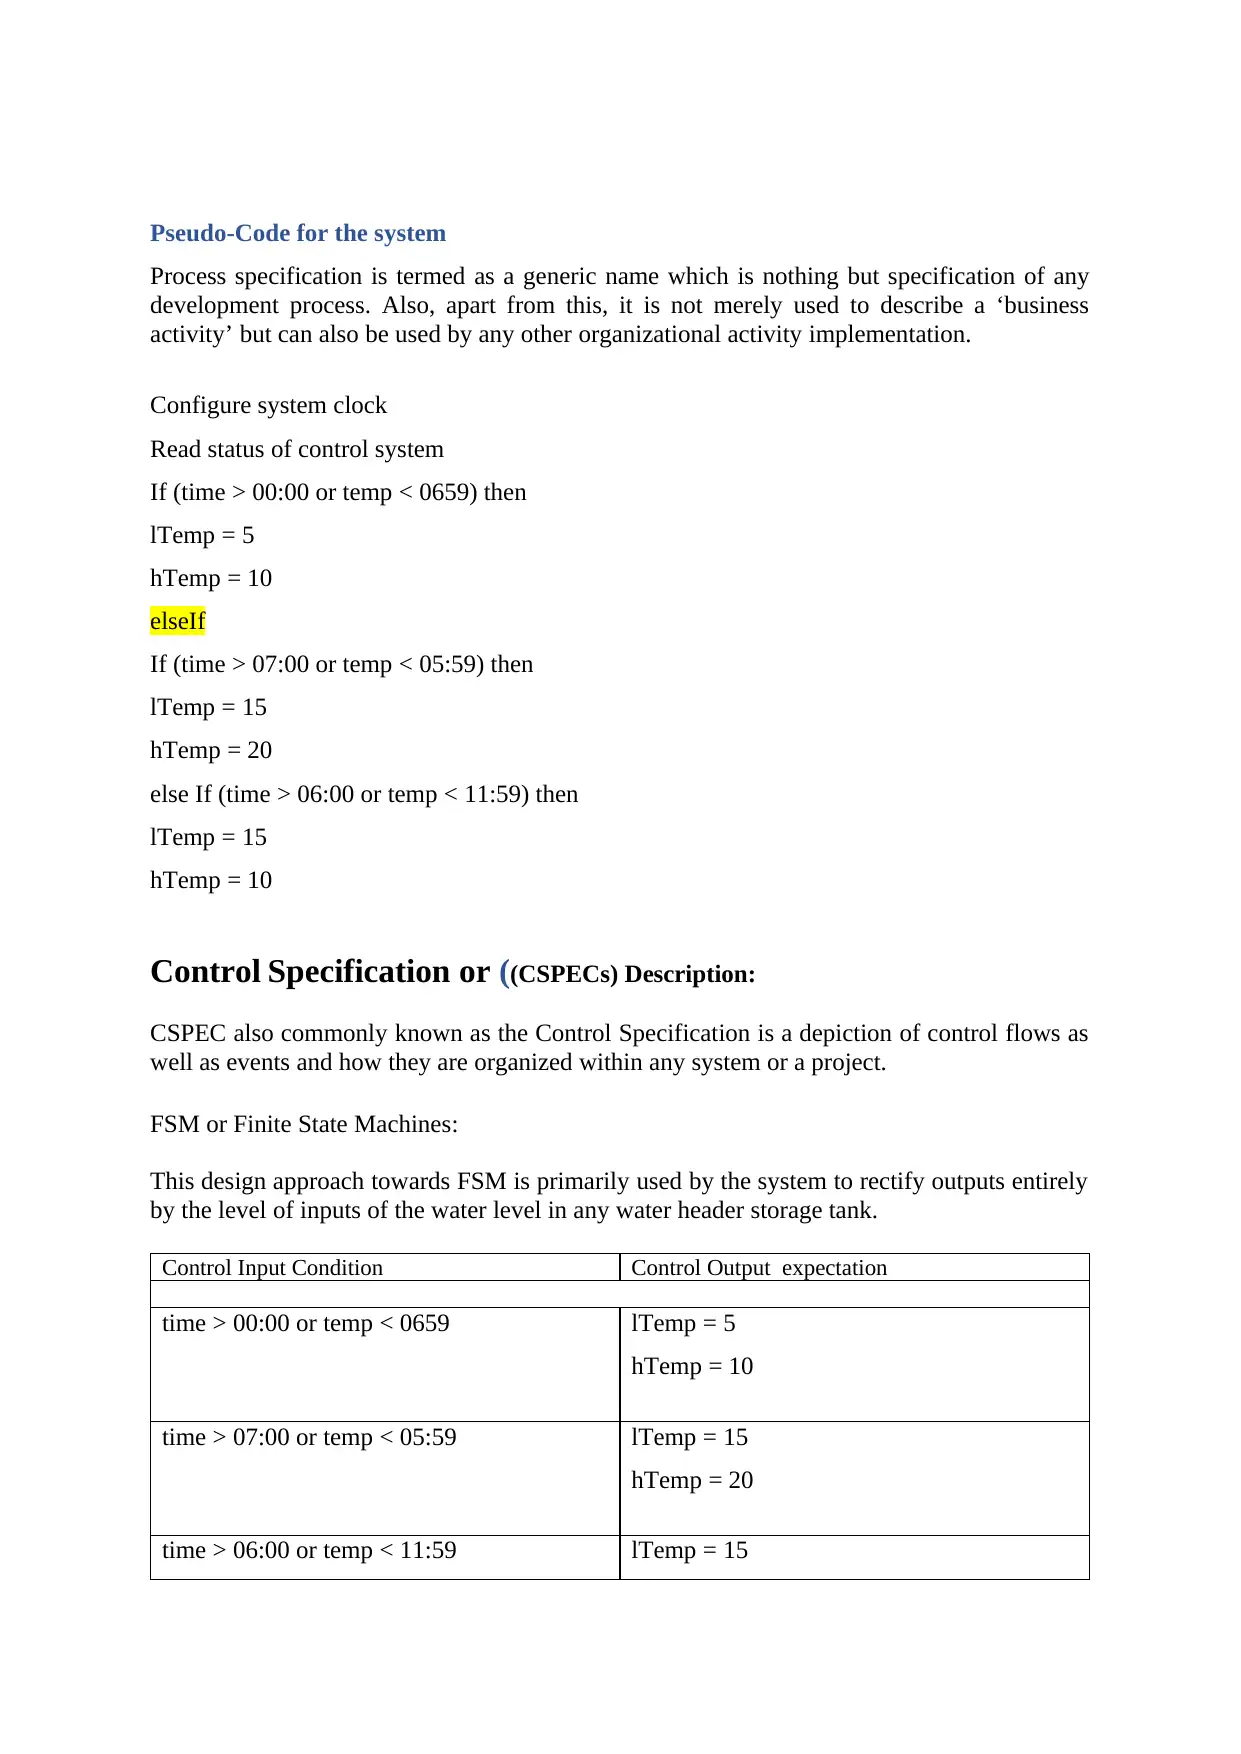
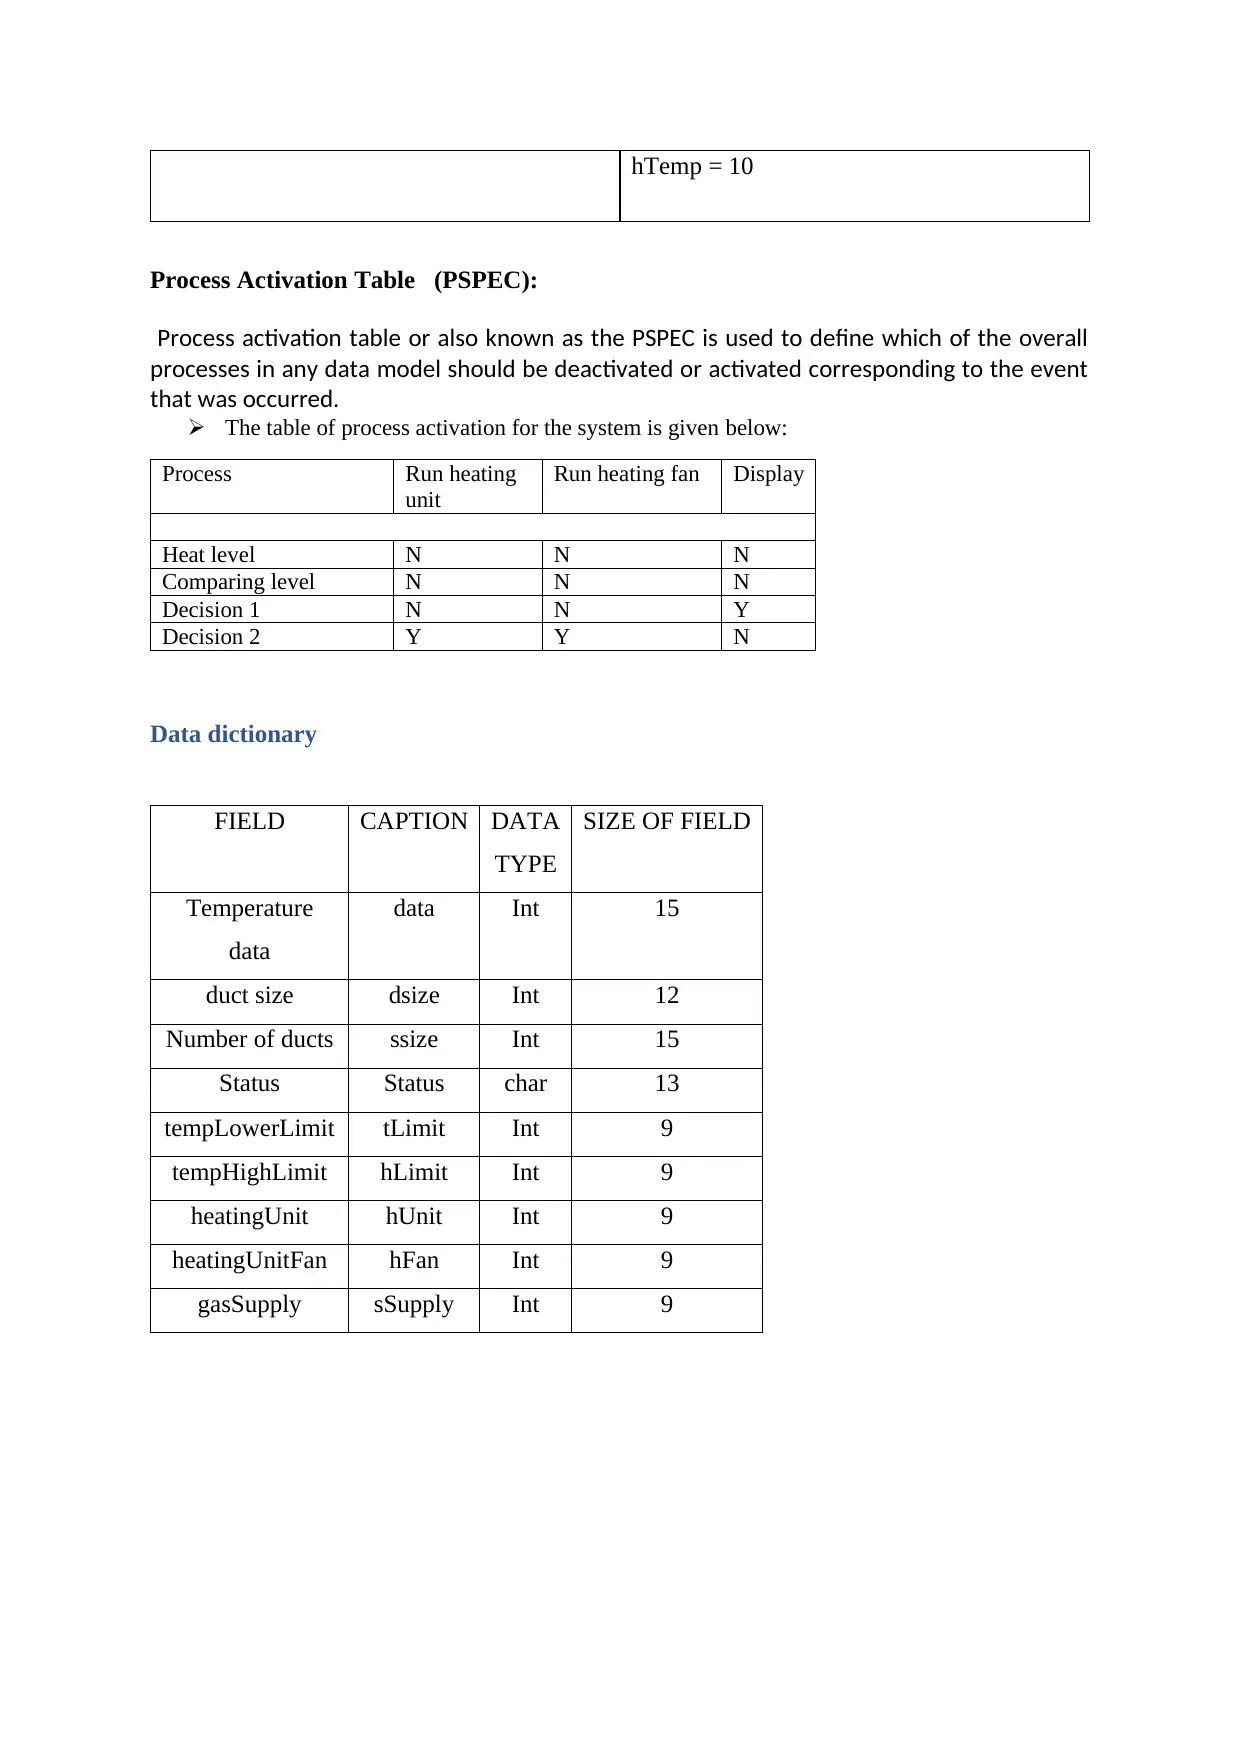
This report presents a structured analysis of a real-time system, focusing on its requirements and specifications within the context of software engineering methodologies (ITECH7410). It includes an ER diagram illustrating the relationships between entities such as the display board, CHCSV10 system, gas meter, and ducts, along with assumptions about their interactions. The data flow diagrams (DFDs), including a context diagram and Level-1 diagram, map the flow of information within the system, highlighting external entities and internal processes like temperature control, system clock, and manual overrides. Pseudo-code outlines the system's logic, detailing how it configures the system clock, reads the control system status, and adjusts temperature levels based on time and temperature. The control specifications (CSPECs) and process activation table (PSPEC) define control flows and process activation based on events. A data dictionary provides details on the fields used, such as temperature data, duct size, and system status. This comprehensive analysis aims to provide a clear understanding of the real-time system's components, interactions, and operational logic.
tabler-icon-diamond-filled.svg

Contribute Materials

Your contribution can guide someone’s learning journey. Share your documents today.
Document Page
Table of Contents
ER diagram.......................................................................................................................2
Data Flow Diagram...........................................................................................................2
Level-1 diagram.................................................................................................................3
Pseudo-Code for the system...............................................................................................3
Data dictionary..................................................................................................................4
tabler-icon-diamond-filled.svg

Secure Best Marks with AI Grader

Need help grading? Try our AI Grader for instant feedback on your assignments.
Document Page
ER diagram
Description -
ERD or Entity rlation diagram is used in software development process to show graphical
representation of different relationships and entities within the software. Apart from core
software development, it helps identifying and depicting relationships within databases in
software development.
Assumptions Explanation:
There is only a single display board which is operated by one user at a time.
Only system board shows the status of the system at any time.
A duct can be used to operate only single CHCSV10 system
A single CHCSV10 can have only one gas meter.
A Gast meter is associated with single CHCSV10 system
A single CHCSV10 can have more than 1 duct but to remain operational more than 50%
ducts should be open
Data Flow Diagram
A data flow diagram (DFD) maps out the flow of information for any process or system. It
uses defined symbols like rectangles, circles and arrows, plus short text labels, to show data
inputs, outputs, storage points and the routes between each destination. Data flowcharts
can range from simple, even hand-drawn process overviews, to in-depth, multi-level DFDs
that dig progressively deeper into how the data is handled. They can be used to analyze an
Document Page
existing system or model a new one. Like all the best diagrams and charts, a DFD can often
visually “say” things that would be hard to explain in words, and they work for both
technical and nontechnical audiences, from developer to CEO. That’s why DFDs remain so
popular after all these years. While they work well for data flow software and systems, they
are less applicable nowadays to visualizing interactive, real-time or database-oriented
software or systems.
Context diagram
On the other hand, a context diagram is primarily used to depict the context as
well as boundaries within the system which is to be modelled. The things that are
outside and inside of the system that needs to be modelled and the relationship
among the system with such external entities.
As a result, a context diagram is primarily used to clarify and define boundaries
of a software system. It depicts the flow of information between external entities
as well as information within the system. As such, the entire system will be
shown as one singular process.
Assumptions description
Notation of panel and display board are external entities, data flows in the CHCSV10 system
design.
The physical entities are duct, gas meter, heating unit fan, operator and heating unit.
CHCSV10 provides boundaries of the system.
Document Page
tabler-icon-diamond-filled.svg

Secure Best Marks with AI Grader

Need help grading? Try our AI Grader for instant feedback on your assignments.
Document Page
Level-1 diagram
System temperature provides temperature evel to the system.
System clock depicts the temperature. It takes time in seconds but output time in hours.
System displays all statues to the board.
Document Page
Manual operations override the automated working of the system.
Operations like start, stop etc. are performed by the heating settings statues shown on the
board.
Gas meter works between the surrounding and the system.
Manual operator systems recieves data from operator provision.
Gas meter control – Level 1
Assumption description
The heat level gets from board.
Depending on heat level either decision 1 or decision 2 is taken.
Gas control system controls Gas meter.
Fan control system controls Duct.
Control System controls pump B
Document Page
Pseudo-Code for the system
Process specification is termed as a generic name which is nothing but specification of any
development process. Also, apart from this, it is not merely used to describe a ‘business
activity’ but can also be used by any other organizational activity implementation.
Configure system clock
Read status of control system
If (time > 00:00 or temp < 0659) then
lTemp = 5
hTemp = 10
elseIf
If (time > 07:00 or temp < 05:59) then
lTemp = 15
hTemp = 20
else If (time > 06:00 or temp < 11:59) then
lTemp = 15
hTemp = 10
Control Specification or ((CSPECs) Description:
CSPEC also commonly known as the Control Specification is a depiction of control flows as
well as events and how they are organized within any system or a project.
FSM or Finite State Machines:
This design approach towards FSM is primarily used by the system to rectify outputs entirely
by the level of inputs of the water level in any water header storage tank.
Control Input Condition Control Output expectation
time > 00:00 or temp < 0659 lTemp = 5
hTemp = 10
time > 07:00 or temp < 05:59 lTemp = 15
hTemp = 20
time > 06:00 or temp < 11:59 lTemp = 15
tabler-icon-diamond-filled.svg

Paraphrase This Document

Need a fresh take? Get an instant paraphrase of this document with our AI Paraphraser
Document Page
hTemp = 10
Process Activation Table (PSPEC):
Process activation table or also known as the PSPEC is used to define which of the overall
processes in any data model should be deactivated or activated corresponding to the event
that was occurred.
The table of process activation for the system is given below:
Process Run heating
unit
Run heating fan Display
Heat level N N N
Comparing level N N N
Decision 1 N N Y
Decision 2 Y Y N
Data dictionary
FIELD CAPTION DATA
TYPE
SIZE OF FIELD
Temperature
data
data Int 15
duct size dsize Int 12
Number of ducts ssize Int 15
Status Status char 13
tempLowerLimit tLimit Int 9
tempHighLimit hLimit Int 9
heatingUnit hUnit Int 9
heatingUnitFan hFan Int 9
gasSupply sSupply Int 9
chevron_up_icon
1 out of 8
circle_padding
hide_on_mobile
zoom_out_icon
logo.png

Your All-in-One AI-Powered Toolkit for Academic Success.

Available 24*7 on WhatsApp / Email

[object Object]