Real World Analytics Project: Analyzing Building Heating Load Data

Verified

Added on  2021/05/31

|13
|1530
|90
Project
AI Summary
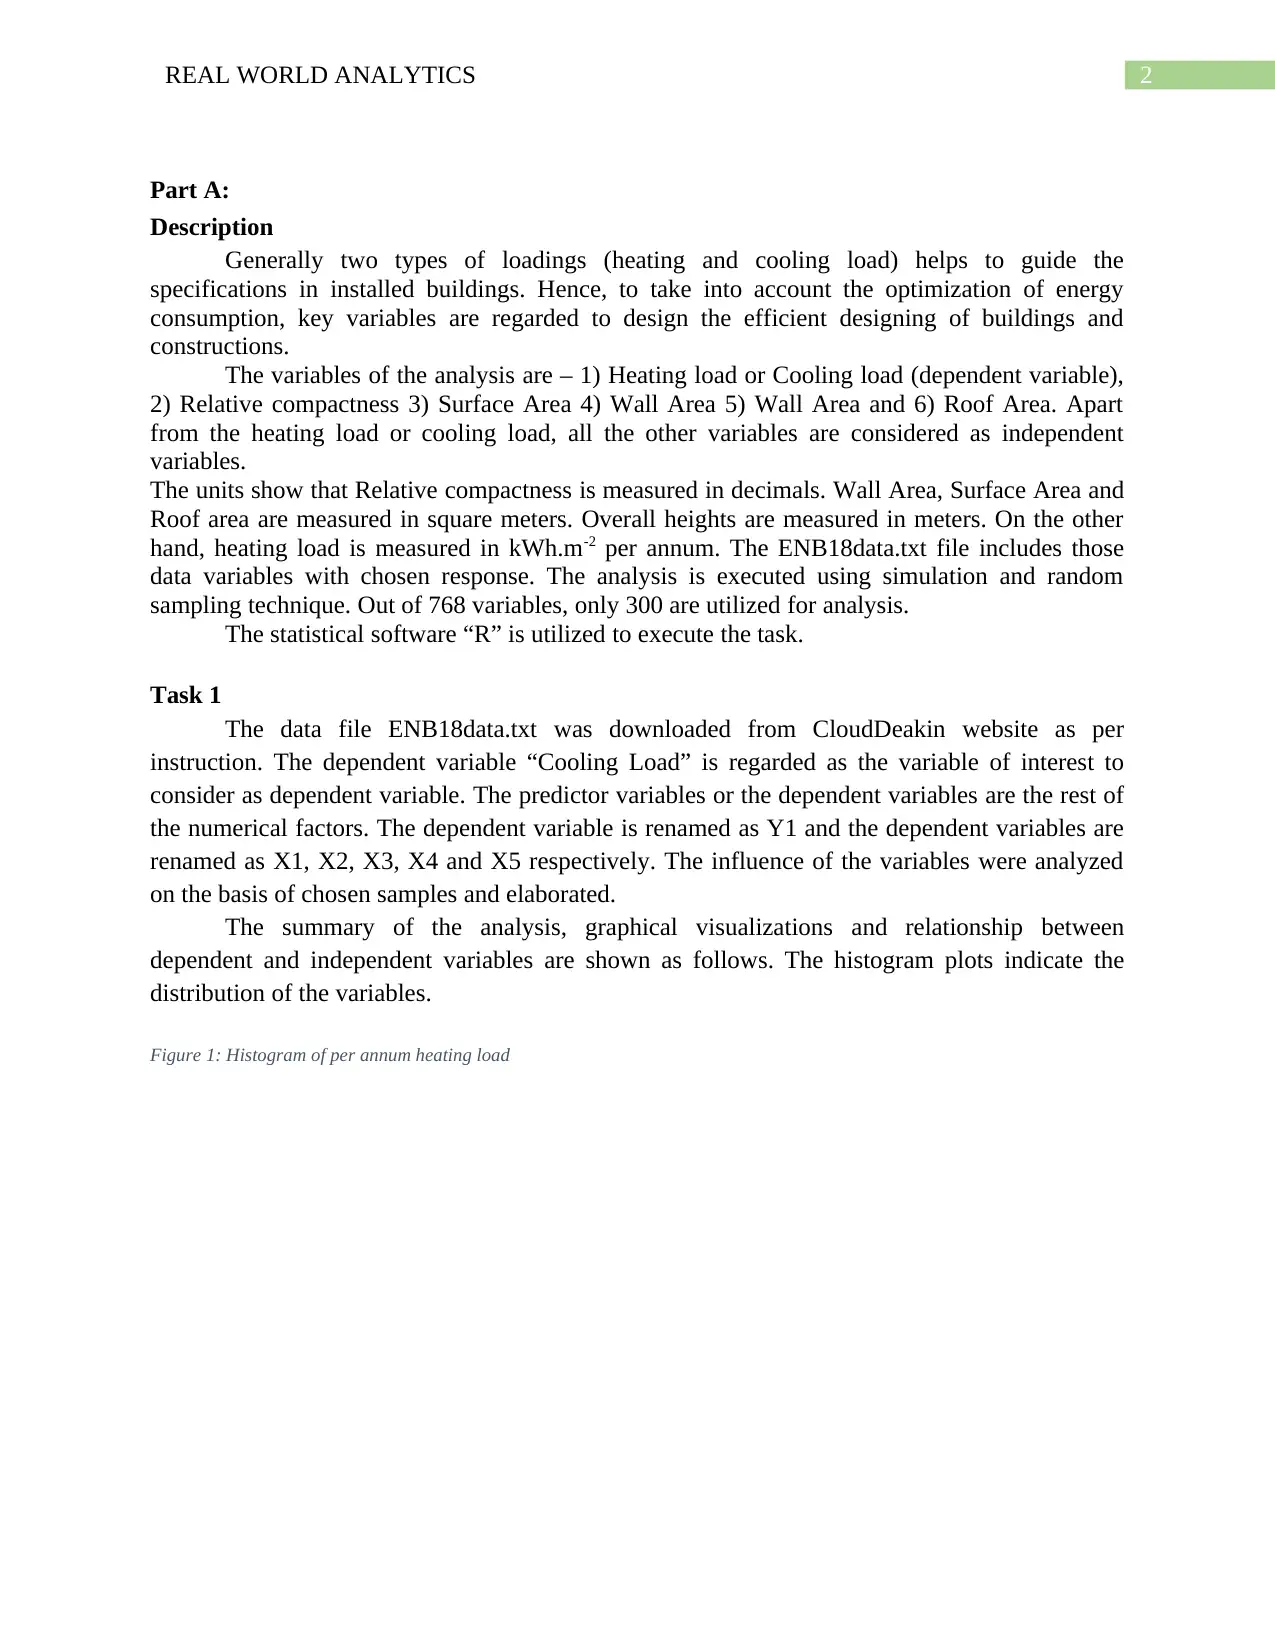
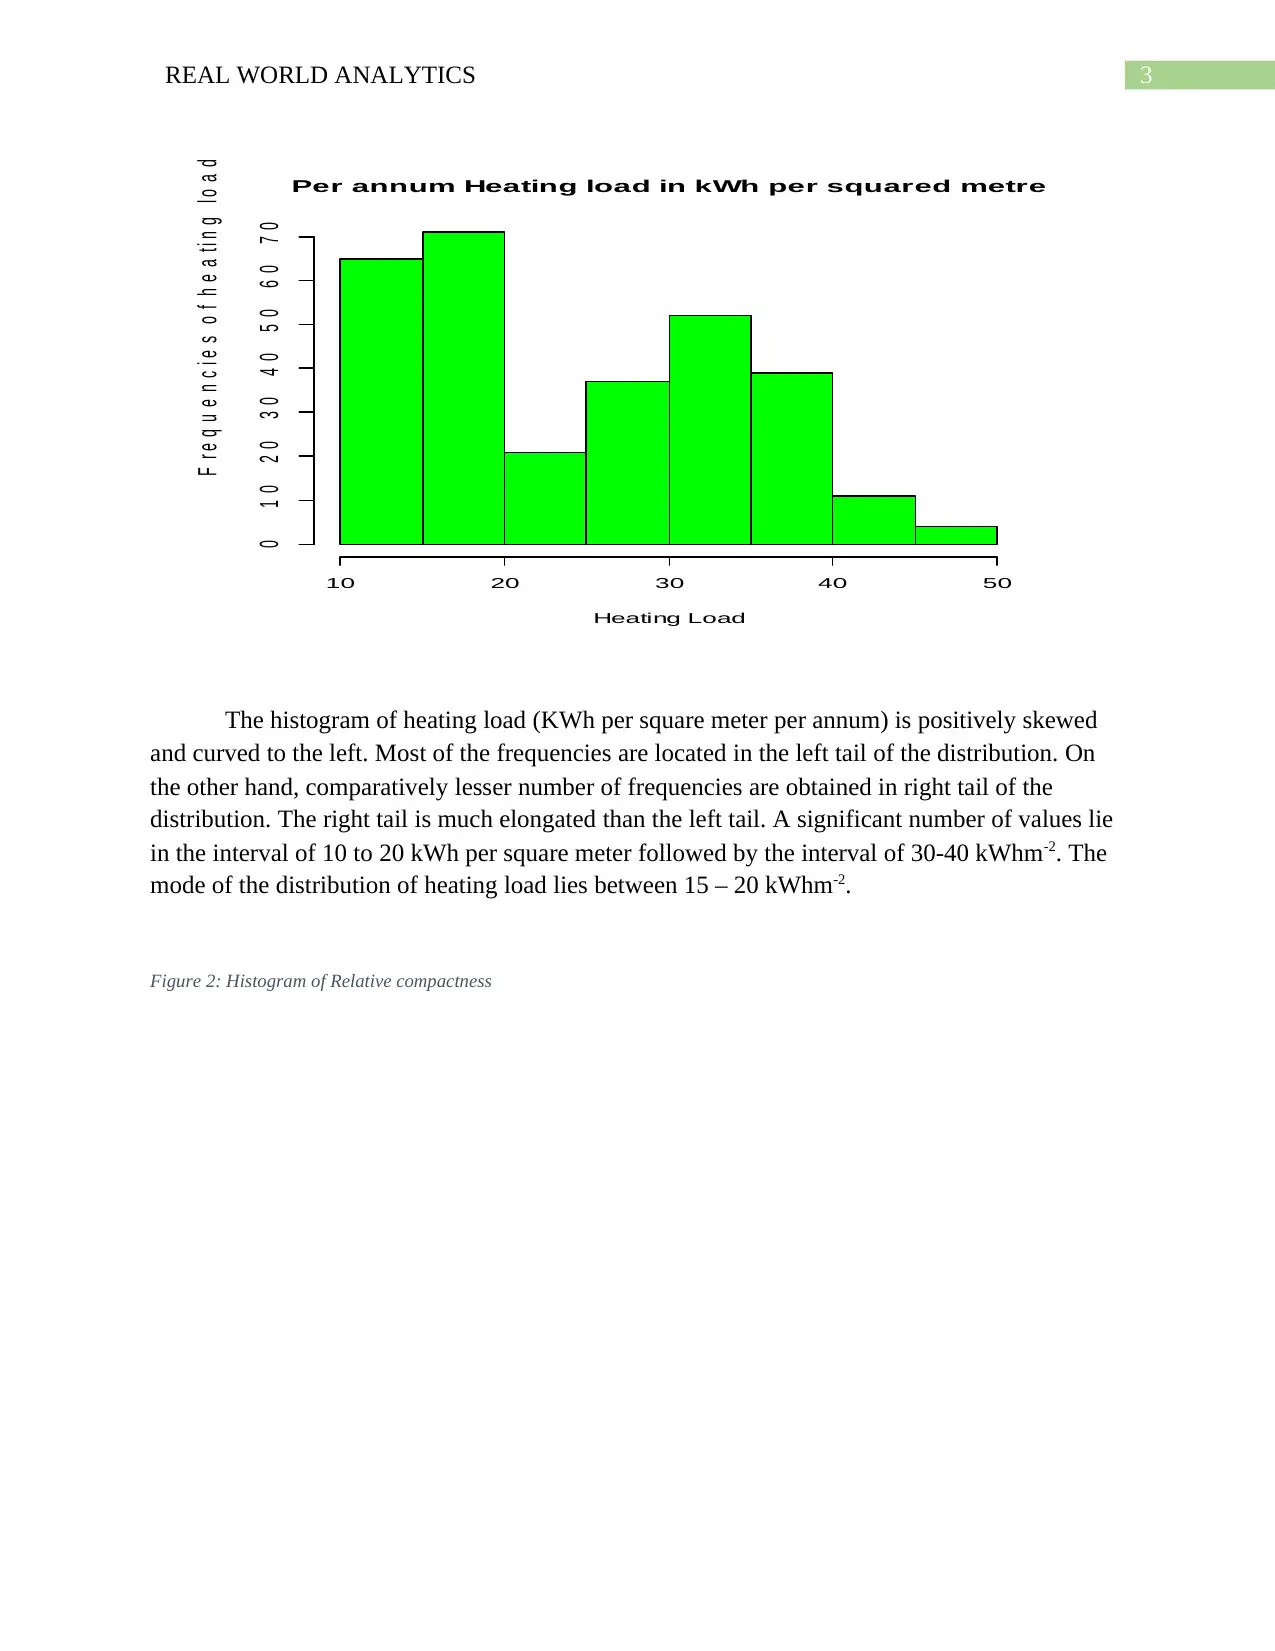
This project undertakes a comprehensive analysis of building heating load data, utilizing the ENB18data.txt dataset. The analysis begins with descriptive statistics, including histograms and scatterplots, to understand the distribution and relationships between variables such as heating load, relative compactness, surface area, wall area, roof area, and overall height. The project then explores the influence of these variables on heating load, employing techniques like variable transformation and model fitting. Several models, including weighted average, weighted power mean, and linear regression, are evaluated based on error measures and correlation coefficients. The study identifies key factors influencing heating load, with a focus on variables like relative compactness, wall area, and overall height. The findings provide valuable insights for optimizing energy consumption and improving building design efficiency. The project uses the statistical software R to execute the analysis.
Document Page
Running head: REAL WORLD ANALYTICS
REAL WORLD ANALYTICS
Name of Student
Name of University
tabler-icon-diamond-filled.svg

Paraphrase This Document

Need a fresh take? Get an instant paraphrase of this document with our AI Paraphraser
Document Page
1REAL WORLD ANALYTICS
Table of Contents
Part A:..............................................................................................................................................2
Description...................................................................................................................................2
Task 1...........................................................................................................................................2
Task 2...........................................................................................................................................9
Task 3...........................................................................................................................................9
Task 4.........................................................................................................................................11
Document Page
2REAL WORLD ANALYTICS
Part A:
Description
Generally two types of loadings (heating and cooling load) helps to guide the
specifications in installed buildings. Hence, to take into account the optimization of energy
consumption, key variables are regarded to design the efficient designing of buildings and
constructions.
The variables of the analysis are – 1) Heating load or Cooling load (dependent variable),
2) Relative compactness 3) Surface Area 4) Wall Area 5) Wall Area and 6) Roof Area. Apart
from the heating load or cooling load, all the other variables are considered as independent
variables.
The units show that Relative compactness is measured in decimals. Wall Area, Surface Area and
Roof area are measured in square meters. Overall heights are measured in meters. On the other
hand, heating load is measured in kWh.m-2 per annum. The ENB18data.txt file includes those
data variables with chosen response. The analysis is executed using simulation and random
sampling technique. Out of 768 variables, only 300 are utilized for analysis.
The statistical software “R” is utilized to execute the task.
Task 1
The data file ENB18data.txt was downloaded from CloudDeakin website as per
instruction. The dependent variable “Cooling Load” is regarded as the variable of interest to
consider as dependent variable. The predictor variables or the dependent variables are the rest of
the numerical factors. The dependent variable is renamed as Y1 and the dependent variables are
renamed as X1, X2, X3, X4 and X5 respectively. The influence of the variables were analyzed
on the basis of chosen samples and elaborated.
The summary of the analysis, graphical visualizations and relationship between
dependent and independent variables are shown as follows. The histogram plots indicate the
distribution of the variables.
Figure 1: Histogram of per annum heating load
Document Page
3REAL WORLD ANALYTICS
Per annum Heating load in kWh per squared metre
Heating Load
F r e q u e n c i e s o f h e a t i n g l o a d
10 20 30 40 50
0 1 0 2 0 3 0 4 0 5 0 6 0 7 0
The histogram of heating load (KWh per square meter per annum) is positively skewed
and curved to the left. Most of the frequencies are located in the left tail of the distribution. On
the other hand, comparatively lesser number of frequencies are obtained in right tail of the
distribution. The right tail is much elongated than the left tail. A significant number of values lie
in the interval of 10 to 20 kWh per square meter followed by the interval of 30-40 kWhm-2. The
mode of the distribution of heating load lies between 15 – 20 kWhm-2.
Figure 2: Histogram of Relative compactness
tabler-icon-diamond-filled.svg

Paraphrase This Document

Need a fresh take? Get an instant paraphrase of this document with our AI Paraphraser
Document Page
4REAL WORLD ANALYTICS
Relative compactness
F r e q u e n c y
0.6 0.7 0.8 0.9 1.0
0 1 0 2 0 3 0 4 0 5 0
The relative compactness values lie between 0.6 and 1. Most of the values lie in the
interval 0.7 and 0.8. Lesser number of frequencies are observed beyond relative compactness =
0.6. The distribution is positively or right skewed.
Figure 3: Histogram of Surface Area
Document Page
5REAL WORLD ANALYTICS
Surface Area
Surface Area
F r e q u e n c y
500 550 600 650 700 750 800 850
0 1 0 2 0 3 0 4 0 5 0
The histogram of surface area highlights highly symmetrical distributed throughout the
range of 500 to 850. The values are centered on the probable mean in the range 650 to 800. The
left tail of the distribution is slightly elongated and heavier than right tail.
Figure 4: Histogram of Wall Area
Wall Area
Wall Area
F r e q u e n c y
250 300 350 400
0 2 0 4 0 6 0 8 0
Document Page
6REAL WORLD ANALYTICS
The obtained histogram of wall area is a right or positively skewed distribution. The
distribution is disjointed in nature with gapping in two places. A significant number of measures
of wall area lie in the interval of 280-300 square meter. Hence, it could be regarded as the modal
class.
Figure 5: The histogram of Roof Area
Roof Area
Roof Area
F r e q u e n c y
120 140 160 180 200 220
0 5 0 1 0 0 1 5 0
The histogram of Roof Area indicates that the distribution is negatively skewed. Lots of
disjoint intervals are observed in its distribution. The model class of Roof Area lies in the
interval of 200 to 210 square meter.
Figure 6: Histogram of Overall Height
tabler-icon-diamond-filled.svg

Paraphrase This Document

Need a fresh take? Get an instant paraphrase of this document with our AI Paraphraser
Document Page
7REAL WORLD ANALYTICS
Overall Height
Overall Height
F r e q u e n c y
3.5 4.0 4.5 5.0 5.5 6.0 6.5 7.0
0 5 0 1 0 0 1 5 0
The histogram of overall height depicts two distinct intervals prominently where all the
values are concentrated. The distribution of Overall Heights is discrete in nature with value.
Almost 50% of the values lies in the interval of either 3.5 or 4 or between 6.5 and 7.
Figure 7: Scatterplot of Relative compactness vs. Heating Load
0.65 0.70 0.75 0.80 0.85 0.90 0.95
1 0 2 0 3 0 4 0
Scatterplot of Relative compactness vs. Heating Load
Relative compactness
H e a ti n g L o a d
Document Page
8REAL WORLD ANALYTICS
The association between relative compactness and cooling load is considered in the
displayed scatterplot. The plotted values indicate positive correlation between the two variables
are observed. With increment in heating load, relative compactness also gets increased.
Figure 8: Scatterplot of Surface Area vs. Heating Load
550 600 650 700 750 800
1 0 2 0 3 0 4 0
Scatterplot of Surface Area vs.Heating Load
Surface Area
H e a ti n g L o a d
A negative correlation is found between surface area and cooling load as per the
scatterplot. The Heating load is observed to be generally lower for greater surface area.
Figure 9: Scatterplot of Wall Area vs. Heating Load
Document Page
9REAL WORLD ANALYTICS
250 300 350 400
1 0 2 0 3 0 4 0
Scatterplot of Wall Area vs.Heating Load
Wall Area
H e a ti n g L o a d
The histogram refers that wall area and hearing load are moderately and positively
associated.
Figure 10: Scatterplot of Roof Area vs. Heating Load
120 140 160 180 200 220
1 0 2 0 3 0 4 0
Scatterplot of Roof Area vs.Heating Load
Roof Area
H e a ti n g L o a d
tabler-icon-diamond-filled.svg

Paraphrase This Document

Need a fresh take? Get an instant paraphrase of this document with our AI Paraphraser
Document Page
10REAL WORLD ANALYTICS
The roof area is highly negative correlated with heating load as for the greater roof area,
we can observe lesser heating load.
Figure 11: Scatterplot of Overall Height vs. Heating Load
3.5 4.0 4.5 5.0 5.5 6.0 6.5 7.0
1 0 2 0 3 0 4 0
Scatterplot of Overall Height vs. Heating Load
Overall Height
H e a t i n g L o a d
It could be easily depicted that for the greater values of Overall Height, the Heating Load
increases significantly. On the other hand, for lower values of Overall Height, the Heating Load
decreases significantly. Therefore, there exists a high positive correlation between these two
variables.
Task 2
Out of five independent variables, four variables are selected accept Roof Area. The aim
is to predict their relevance. Roof Area is dropped from the list of other independent variables.
The data is kept saved labelling the file “name-transformed.txt”. In the next step, those variable
(including dependent and independent variables) are transformed taking natural logarithm for all
the cases. The betterment could be observed in the distribution of the variables decreasing the
skewness of the variables. It could be observed that, the general relevance of the variables do not
differ significantly even after transmission.
Task 3
Document Page
11REAL WORLD ANALYTICS
The weighted arithmetic mean is 5.207148.
The weighted power means (PM) with p=0.5 is 5.0537.
The weighted power means (PM) with p=0.2 is 5.39987.
Ordered weighted averaging function (OWA) = 5.20715.
Table 1: The parameters and summary of the fit for the four models for error measure and correlation
RMS
E
Average
absolute error
Pearson’s
Correlation
coefficient
Spearman’s
Correlation
coefficient
Weighted Average 7.3542 5.207148. 0.7331 0.8214
Weighted Power
mean (P=0.05)
6.7175 5.0537 0.8692 0.8654
Weighted power
mean (P=2)
8.3161 5.39987 0.5219 0.5451
Ordered weighted
average
7.3897 5.20715 0.7329 0.8083
Choquet’s Integral 7.3897 5.20715 0.7329 0.8079
Table 2: Model Parameters
Variable Weighted
Average
Weighted
Power
P=0.05
Weighted
power
P=2
Ordered
weighted
average
Choquet’s
Integral
X1 0 0 0 0 0
X2 0 0 0 0.901 0
X3 0.0657 0.161 0.011 0 0.040
X4 0 0 0 0.066 0.040
X5 0.9192 0.736 0.9789 0.001 0.9252
The weighted power average model with the parameter power of 0.5 was obtained to have the
minimum value of RMSE and average absolute error among all the five models. In addition to that, it had
greater correlation coefficient values than other models. That is way, this model is considered as the best
model. Relative compactness, Wall area and Overall height were detected as the factors having most
weightage by the model. Not only was that, the greater values of these variables are detailed to accept for
higher values of heating load. X5 has high amount of interaction with model predictor Y1.
chevron_up_icon
1 out of 13
circle_padding
hide_on_mobile
zoom_out_icon
[object Object]