SIT718 Real World Analytics: BP Share Price Analysis Report

Verified

Added on  2023/05/29

|8
|1236
|469
Report
AI Summary
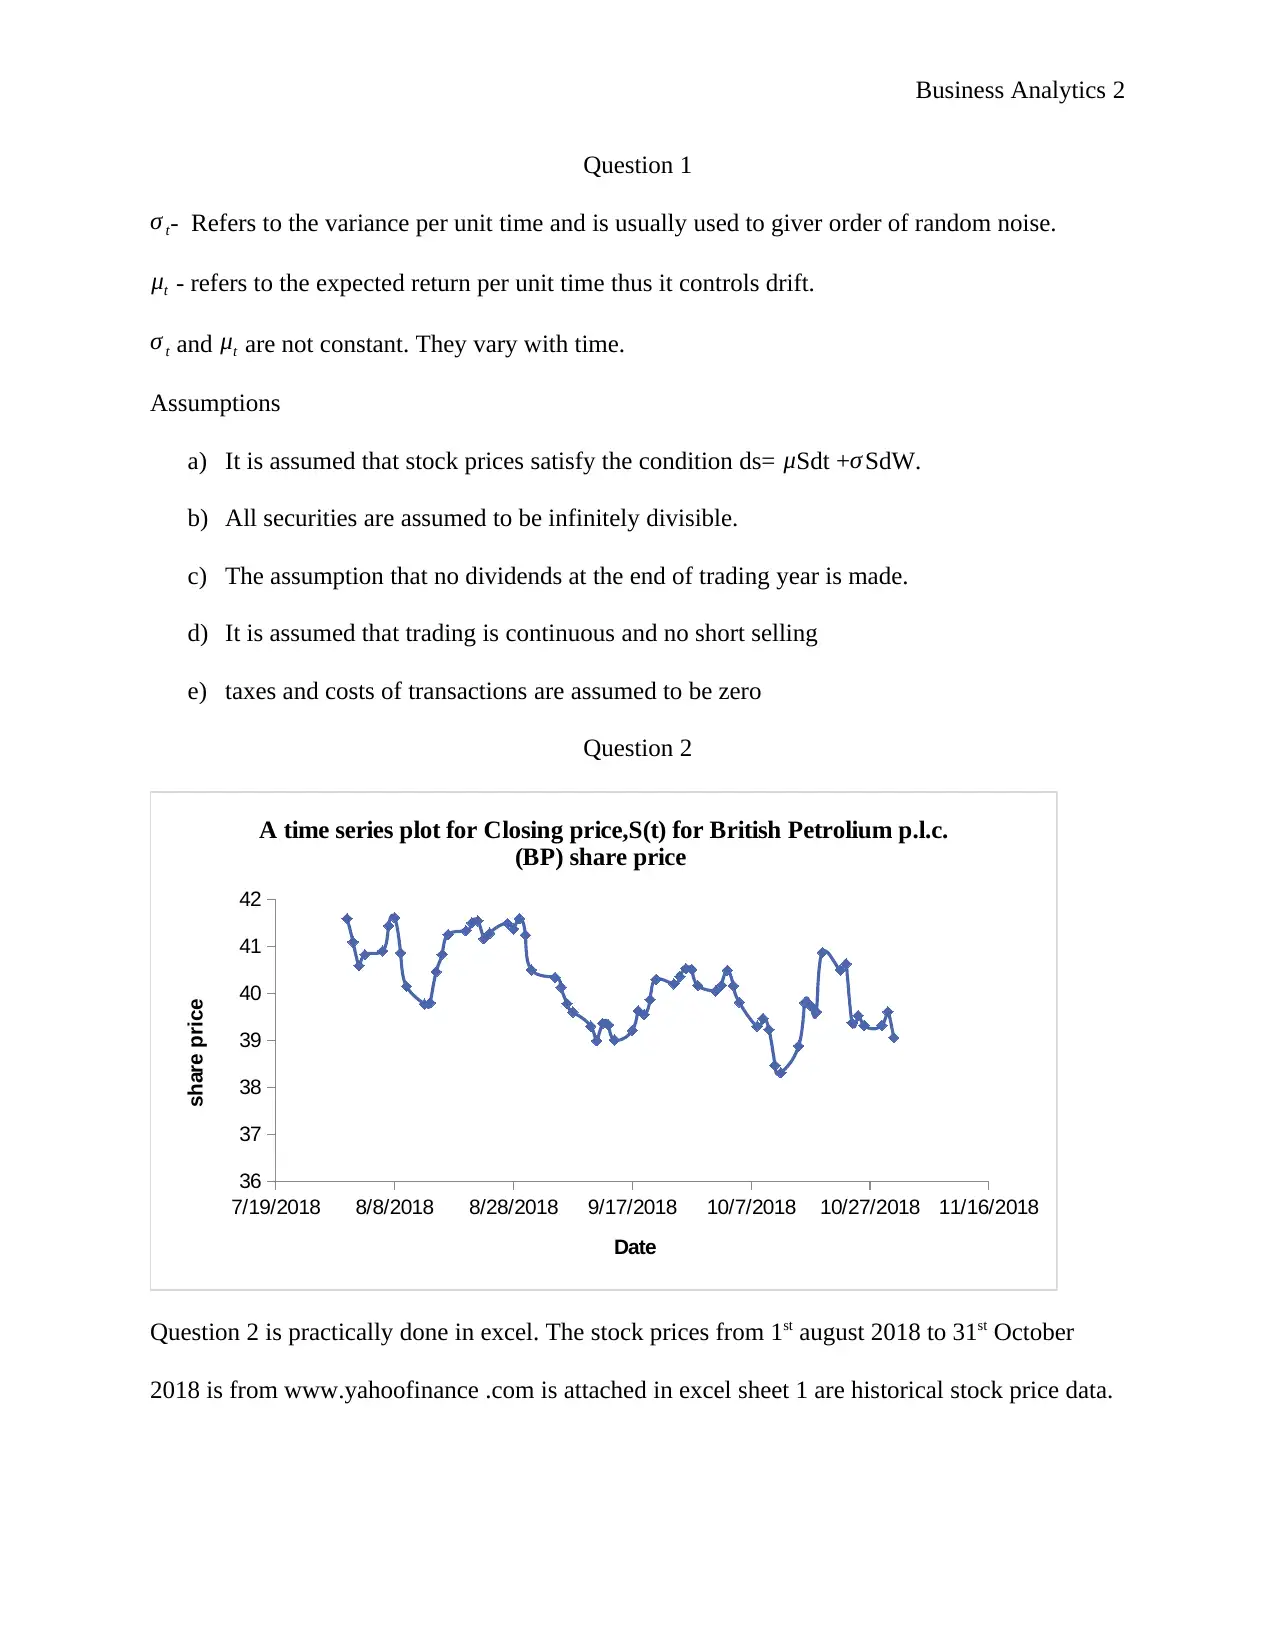
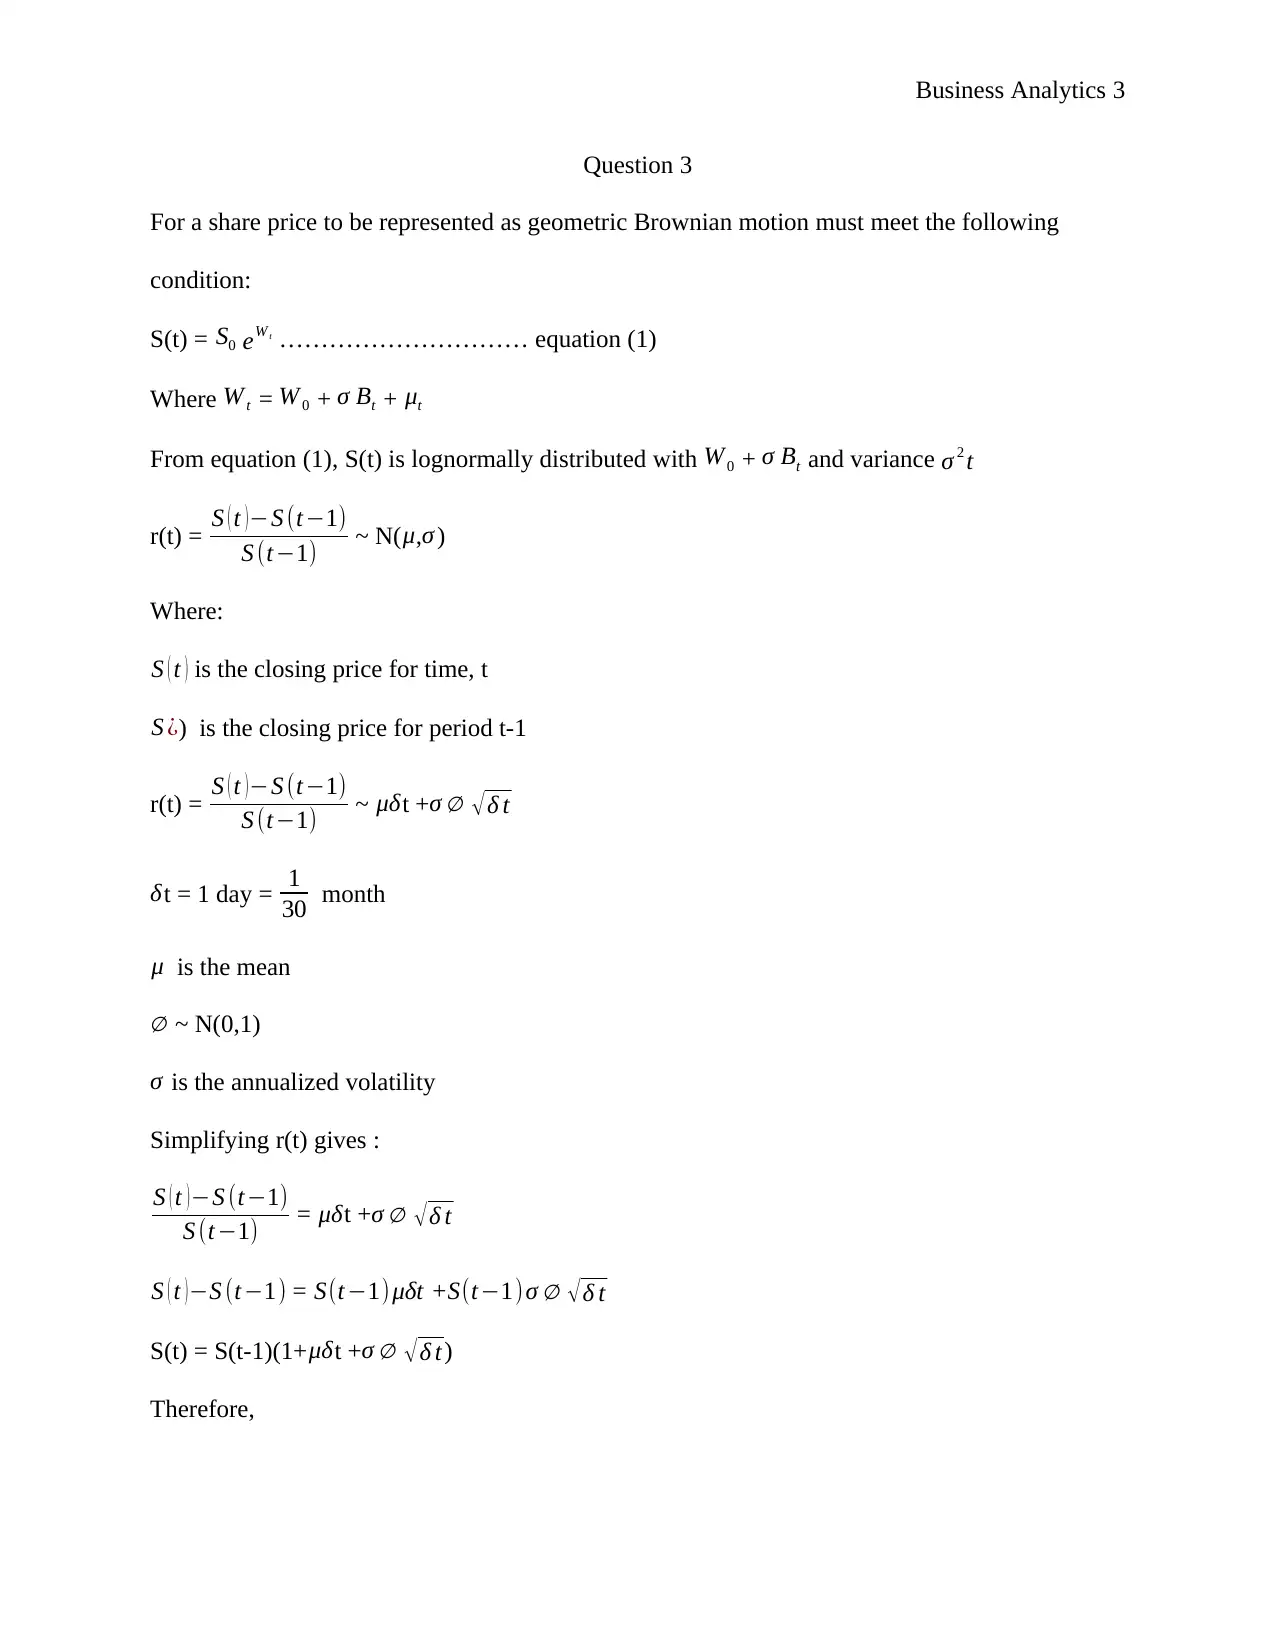
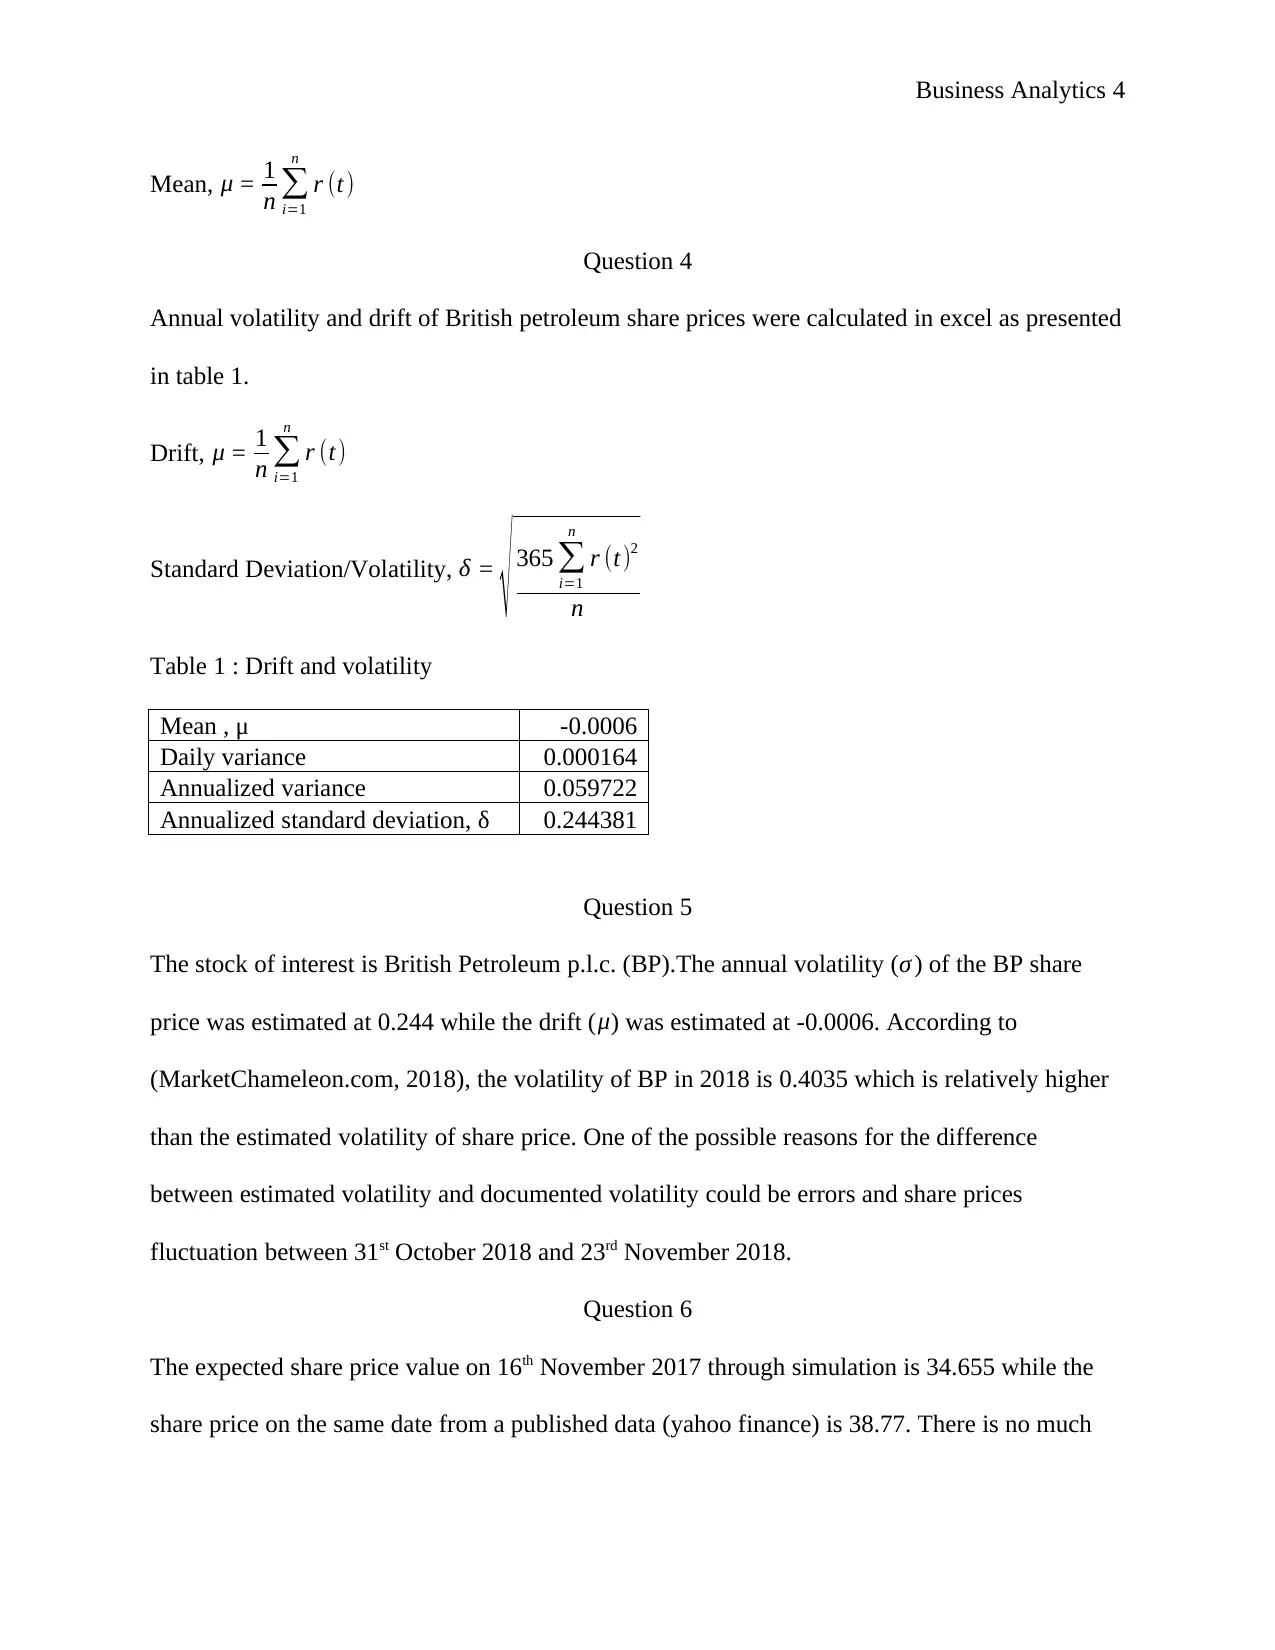
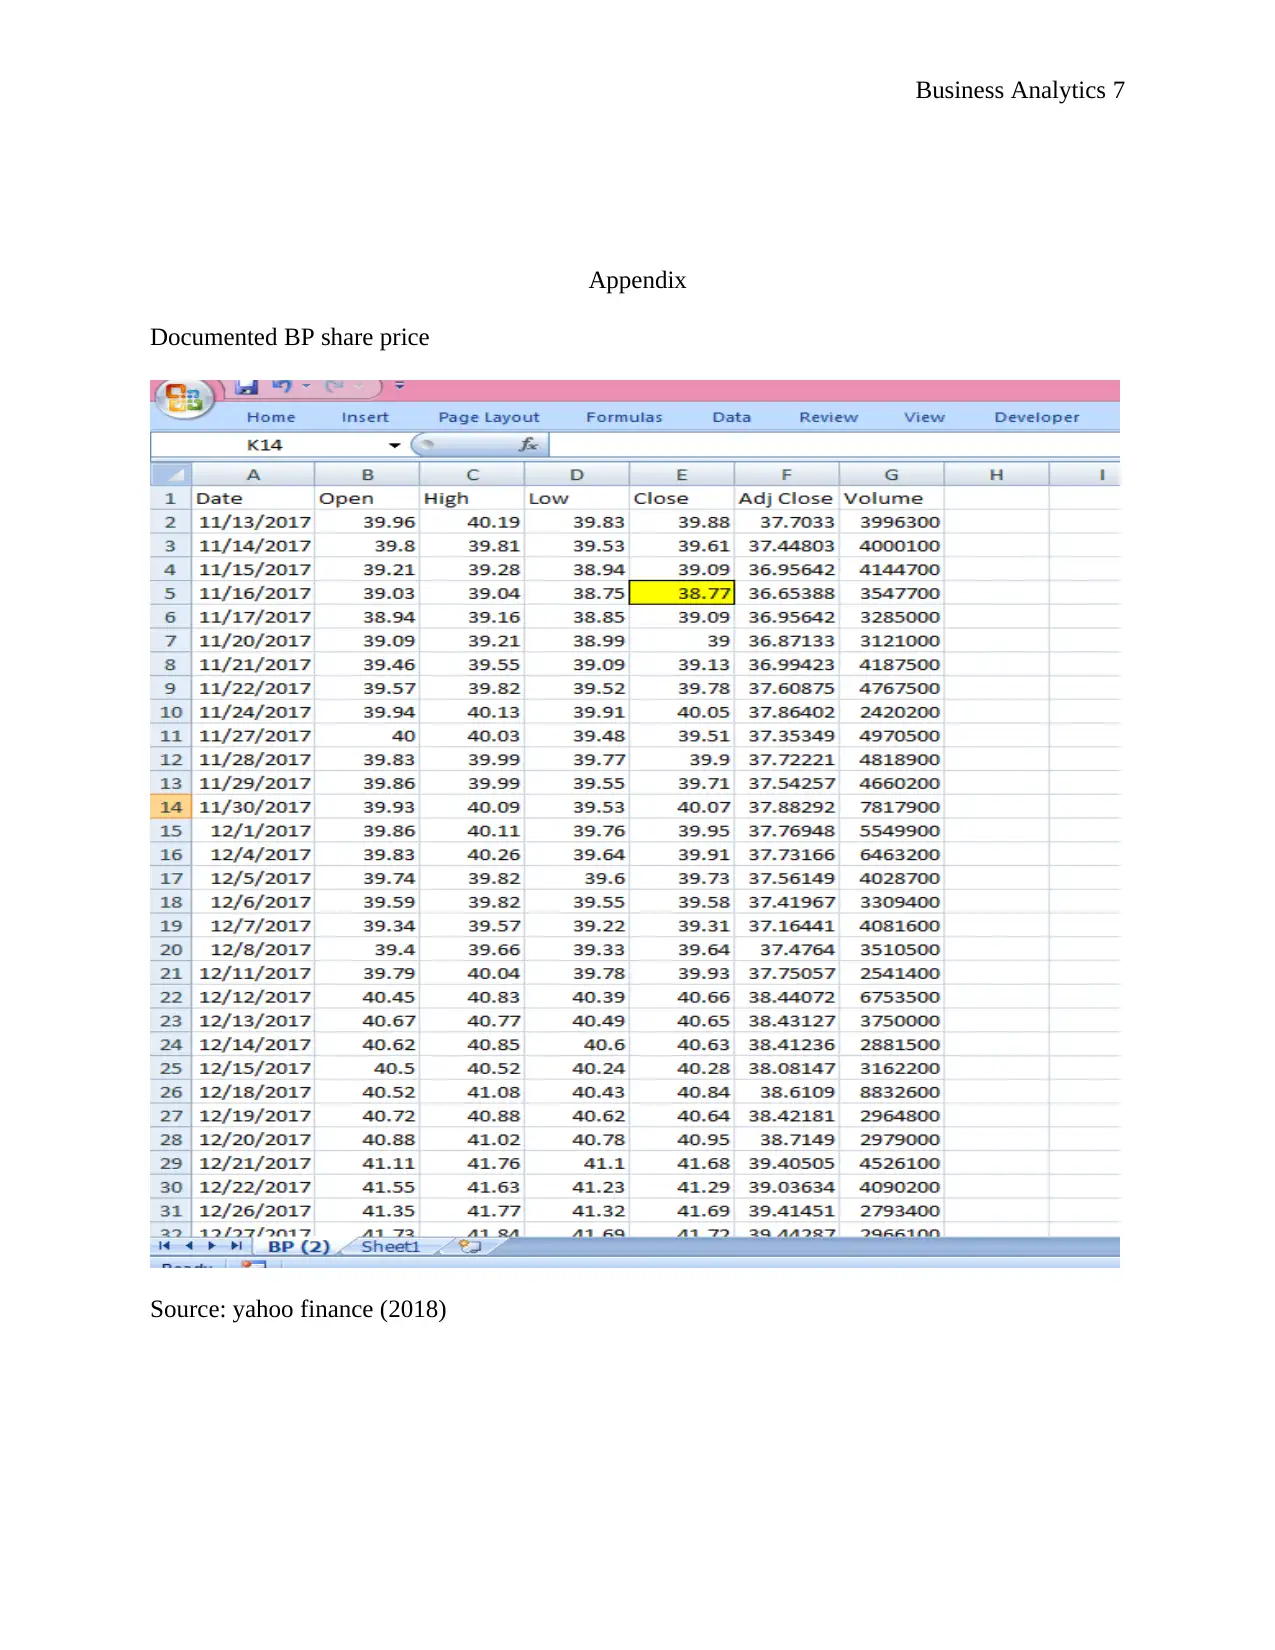
This report analyzes British Petroleum (BP) share prices using real-world data and the application of business analytics techniques. It begins by explaining key concepts like variance, drift, and the assumptions underlying stock price modeling. The report then presents a time series plot of BP's closing prices and details the use of geometric Brownian motion (GBM) to model share price behavior. Calculations of drift and volatility are presented, along with a comparison to documented volatility data. The report also simulates share prices using GBM and compares the results to published data, discussing the limitations of the model. The analysis includes references to relevant literature and appendices with data from Yahoo Finance. The report concludes that GBM can be used to predict future share prices with accuracy.
Document Page
Business Analytics 1
APPLICATION OF BUSINESS ANALYTICS TO REAL LIFE REAL WORLD
By Students Name
Course
Professor
University Name
City, State
Date
tabler-icon-diamond-filled.svg

Secure Best Marks with AI Grader

Need help grading? Try our AI Grader for instant feedback on your assignments.
Document Page
Business Analytics 2
Question 1
σ t- Refers to the variance per unit time and is usually used to giver order of random noise.
μt - refers to the expected return per unit time thus it controls drift.
σ t and μt are not constant. They vary with time.
Assumptions
a) It is assumed that stock prices satisfy the condition ds= μSdt +σ SdW.
b) All securities are assumed to be infinitely divisible.
c) The assumption that no dividends at the end of trading year is made.
d) It is assumed that trading is continuous and no short selling
e) taxes and costs of transactions are assumed to be zero
Question 2
7/19/2018 8/8/2018 8/28/2018 9/17/2018 10/7/2018 10/27/2018 11/16/2018
36
37
38
39
40
41
42
A time series plot for Closing price,S(t) for British Petrolium p.l.c.
(BP) share price
Date
share price
Question 2 is practically done in excel. The stock prices from 1st august 2018 to 31st October
2018 is from www.yahoofinance .com is attached in excel sheet 1 are historical stock price data.
Document Page
Business Analytics 3
Question 3
For a share price to be represented as geometric Brownian motion must meet the following
condition:
S(t) = S0 eW t ………………………… equation (1)
Where W t = W0 + σ Bt + μt
From equation (1), S(t) is lognormally distributed with W0 + σ Bt and variance σ 2 t
r(t) = S ( t )S (t1)
S (t1) ~ N( μ,σ )
Where:
S ( t ) is the closing price for time, t
S ¿) is the closing price for period t-1
r(t) = S ( t )S (t1)
S (t1) ~ μδt +σ δ t
δt = 1 day = 1
30 month
μ is the mean
~ N(0,1)
σ is the annualized volatility
Simplifying r(t) gives :
S ( t )S (t1)
S (t1) = μδt +σ δ t
S ( t ) S (t1) = S(t1) μδt +S(t1)σ δ t
S(t) = S(t-1)(1+ μδt +σ δ t)
Therefore,
Document Page
Business Analytics 4
Mean, μ = 1
n
i=1
n
r (t)
Question 4
Annual volatility and drift of British petroleum share prices were calculated in excel as presented
in table 1.
Drift, μ = 1
n
i=1
n
r (t)
Standard Deviation/Volatility, δ =
365
i=1
n
r (t)2
n
Table 1 : Drift and volatility
Mean , μ -0.0006
Daily variance 0.000164
Annualized variance 0.059722
Annualized standard deviation, δ 0.244381
Question 5
The stock of interest is British Petroleum p.l.c. (BP).The annual volatility (σ ) of the BP share
price was estimated at 0.244 while the drift ( μ) was estimated at -0.0006. According to
(MarketChameleon.com, 2018), the volatility of BP in 2018 is 0.4035 which is relatively higher
than the estimated volatility of share price. One of the possible reasons for the difference
between estimated volatility and documented volatility could be errors and share prices
fluctuation between 31st October 2018 and 23rd November 2018.
Question 6
The expected share price value on 16th November 2017 through simulation is 34.655 while the
share price on the same date from a published data (yahoo finance) is 38.77. There is no much
tabler-icon-diamond-filled.svg

Secure Best Marks with AI Grader

Need help grading? Try our AI Grader for instant feedback on your assignments.
Document Page
Business Analytics 5
difference in the prices of the simulated share price and the published price. This suggests that
geometric Brownian motion can be used to predict future share prices with accuracy.
Question 7
Geometric Brownian motion (GBM) is a stochastic differential equation used to define
continuous-time stochastic process (Reddy and Clinton, 2016; Kanniainen, 2009).Geometric
Brownian motion has wide applications. One of the many applications of GBM is prediction
future share prices in stock markets. Geometric Brownian motion is a product of a stock
volatility and Weiner process which takes into consideration random volatility and time (Brewer,
Feng, and Kwan, 2018; Sengupta, 2010). Even though GBM takes care of time during
calculation of drift and volatility, it has four limitations:
a) The returns of shares are log-normally distributed
b) GBM assumes that the company whose share prices are under consideration is a going
concern and its stock prices are continuous in time
c) The distribution of continuous compound returns follow a normal distribution
d) GBM also assume that all stocks/shares follow a Markov process where the only current
price can be used to predict future share prices.
According to the British Petrolium p.l.c. (BP), share prices from August 2018 to 31 October
2018 show that the drift ( μ) is -0.0006 and the annual volatility (δ) was found to be 0.244. using
GBM to simulate share prices on 16th November 2017 produced a value that is not too far from
the published value This suggests that geometric Brownian motion can be used to predict future
share prices with accuracy.
Document Page
Business Analytics 6
Reference
Brewer, K., Feng, Y. and Kwan, C. (2018). Geometric Brownian motion, option pricing, and
simulation: some spreadsheet-based exercises in financial modeling. [online]
Epublications.bond.edu.au. Available at: http://epublications.bond.edu.au/cgi/viewcontent.cgi?
article=1131&context=ejsie [Accessed 24 Nov. 2018].
Finance.yahoo.com. (2018). Yahoo is now part of Oath. [online] Available at:
https://finance.yahoo.com/quote/BP/history?p=BP [Accessed 3 Dec. 2018].
Kanniainen, J.(2009). Can properly discounted projects follow geometric Brownian
motion?’, Mathematical Methods of Operations Research, vol. 70, no. 3, pp. 435–450, viewed 3
December 2018.
Krishna Reddy and Vaughan Clinton (2016).Simulating Stock Prices Using Geometric Brownian
Motion: Evidence from Australian Companies’, Australasian Accounting, Business and Finance
Journal, Vol 10, Iss 3, Pp 23-47 (2016), (3), p. 23. doi: 10.14453/aabfj.v8i3.3.
MarketChameleon.com. (2018). Glaxosmithkline PLC (GSK) Stock Quote | Price Chart | Volume
Chart. [online] Available at: https://marketchameleon.com/Overview/GSK/ [Accessed 24 Nov.
2018].
Sengupta, C. (2010). Financial analysis and modeling using Excel and VBA. Hoboken, N.J.:
Wiley.
Document Page
Business Analytics 7
Appendix
Documented BP share price
Source: yahoo finance (2018)
tabler-icon-diamond-filled.svg

Paraphrase This Document

Need a fresh take? Get an instant paraphrase of this document with our AI Paraphraser
Document Page
Business Analytics 8
chevron_up_icon
1 out of 8
circle_padding
hide_on_mobile
zoom_out_icon
[object Object]