SIT718 Real World Analytics: Spark New Zealand Stock Analysis

Verified

Added on  2023/04/20

|7
|1265
|438
Report
AI Summary
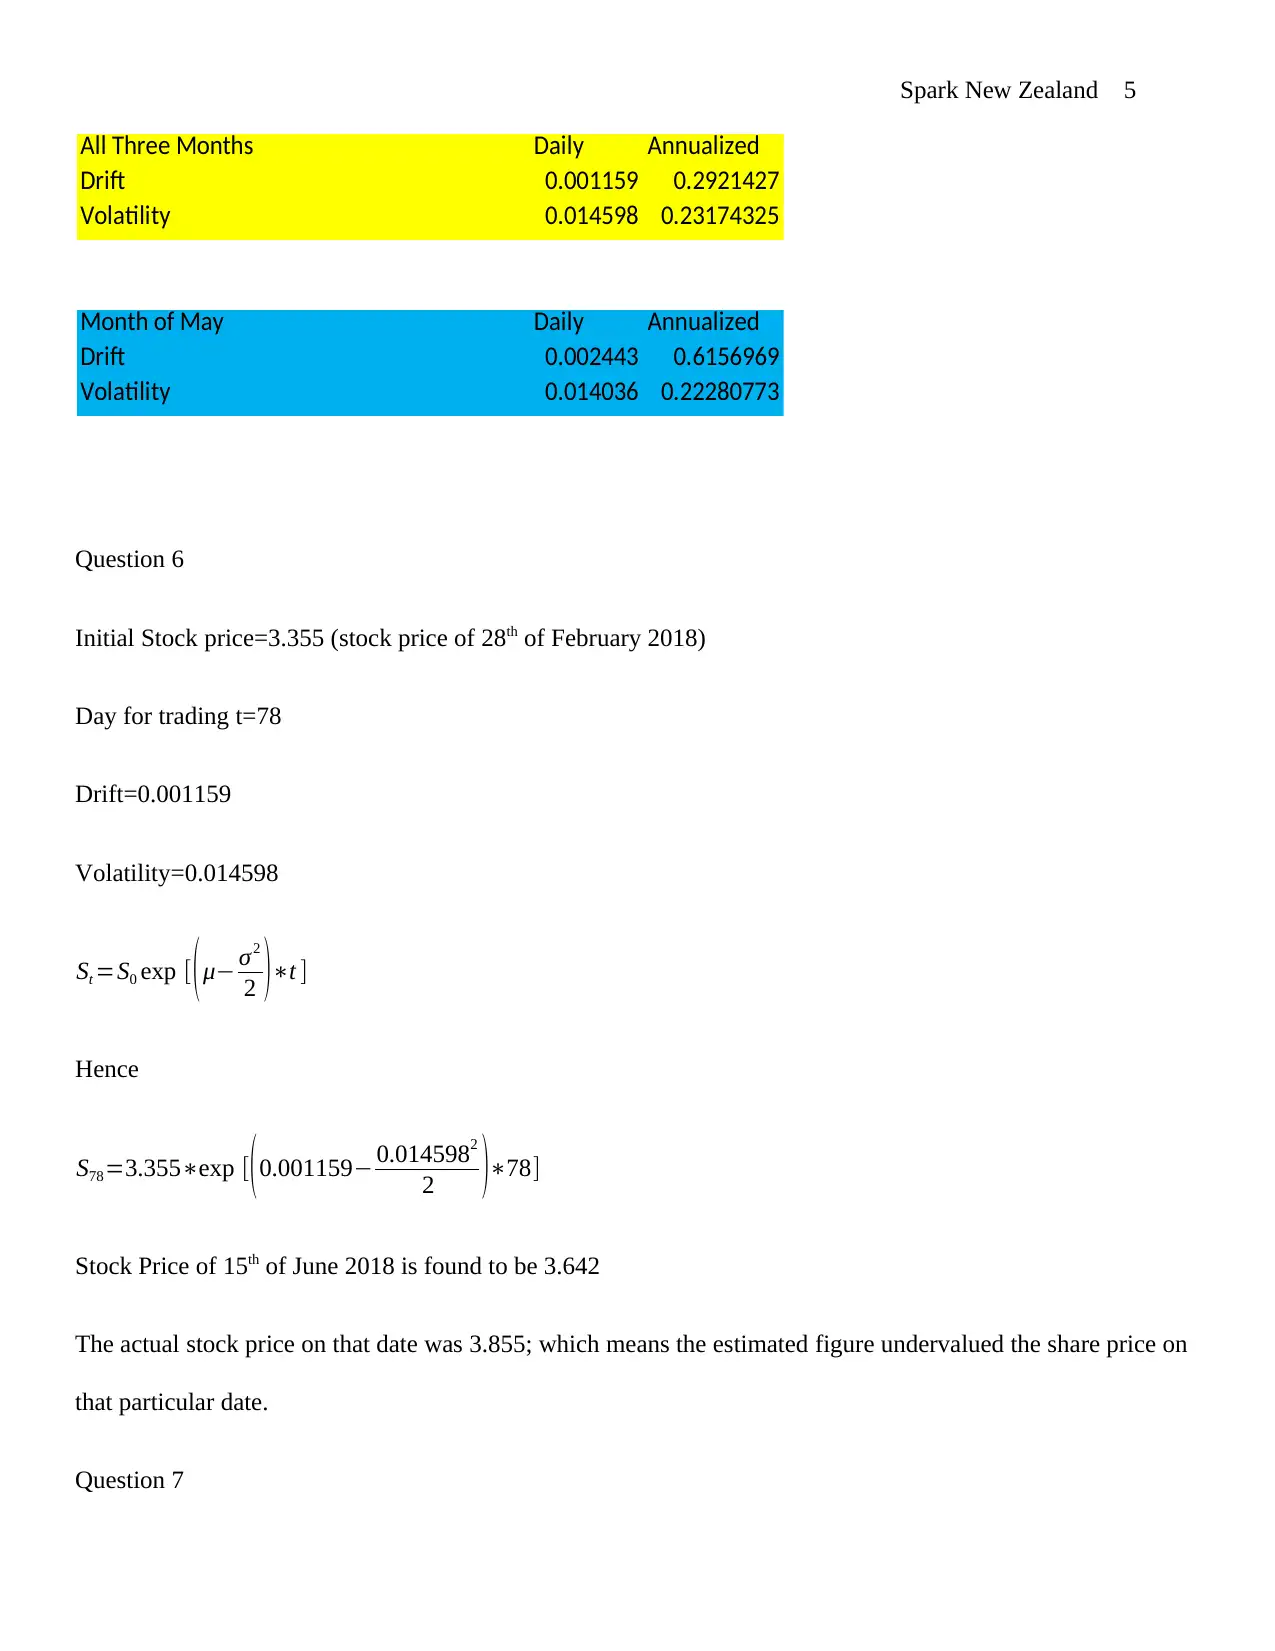
This report provides a detailed analysis of Spark New Zealand Limited (SPK.NZ) stock performance using historical data and financial models. It examines the stock's price trends, calculates drift and volatility using Geometric Brownian Motion (GBM), and assesses the distribution of stock returns. The report includes assumptions about share prices, computations of drift and volatility, and a prediction of future stock prices. It concludes with an evaluation of Spark New Zealand's financial stability, market position, and potential for international expansion. Desklib offers a wealth of resources, including solved assignments and past papers, for students seeking assistance with similar finance topics.
Document Page
Spark New Zealand 1
SPARK NEW ZEALAND LIMITED (SPK.NZ)
By (Name)
The Name of the Class (Course)
Professor (Tutor)
The Name of the School (University)
The City and State where it is located
The Date
tabler-icon-diamond-filled.svg

Secure Best Marks with AI Grader

Need help grading? Try our AI Grader for instant feedback on your assignments.
Document Page
Spark New Zealand 2
Spark New Zealand Limited (SPK.NZ)
Question 1
Spark New Zealand Limited (SPK.NZ) is a telecommunication company found in New Zealand that specializes
in the provision of mobile network, fixed telephone network, business ICT services, and Internet Services. The
company has its headquarters in Auckland, New Zealand. It has been registered as a publicly traded company in
New Zealand since 1990; it is undoubtedly one of the largest companies found in the New Zealand Exchange
(NZX) market.
Question 2
From the closing stock prices chart below we can see that the stock prices for Spark New Zealand Limited seem
to have a upward trend especially for the period between 1st of April 2018 and 31st of May 2018. The month of
March recorded considerable lows and highs without any clear trend in the direction of daily closing stock
prices. Relaying on the overall pattern of the stock prices, it is expect that in June the company will record even
higher than before stock prices (Shaik & Maheswaran 2018).
3/1/2018
3/6/2018
3/11/2018
3/16/2018
3/21/2018
3/26/2018
3/31/2018
4/5/2018
4/10/2018
4/15/2018
4/20/2018
4/25/2018
4/30/2018
5/5/2018
5/10/2018
5/15/2018
5/20/2018
5/25/2018
5/30/2018
3.1
3.2
3.3
3.4
3.5
3.6
3.7
3.8
Closing Stock Prices
Close Stock Prices
3-Months
Daily Closing Stock Prices
Document Page
Spark New Zealand 3
Question 3
Under a stochastic process that adheres to Geometric Brownian Motion (GBM) the drift ( μ) and volatility ( σ )
are constants that can be computed from the historical stock prices. The drift is considered to the average value
of stock returns for the stipulated period; while, volatility is the standard deviation of the stock return for the
same historical period.
Assuming the log returns (X) are given by
Xt =ln ( St
St1
)
Formulas for Daily Drift and Volatility
^μ= 1
N 1
i=1
N 1
Xt
^σ = Var ( Xt )
Formula for Annualized Drift and Volatility
μ=252( 1
N 1
i=1
N 1
Xt )
σ = 252Var ( Xt )
Where 252 is the number of trading days in a year
Question 4
Assumptions
(i). The share prices are continuous in nature with regard to value and time
Document Page
Spark New Zealand 4
(ii). The share prices follow a markov process under which it is expected that only the price of the current share
can be employed in the estimation of future prices.
(iii). The proportional return of a given share is expected to follow a log-normal distribution
(iv). The continuously compounded share return is expected to adhere to a normal distribution
The first two are evidence given the share prices are time-series data and they are entirely positive values that
appear to be random in nature. The remaining two can be proved though the assessment of the distribution
nature of the Spark New Zealand stock returns. We can use descriptive statistics and a histogram to determine
whether the returns are normally distributed.
Returns
Mean 0.001159296
Standard Error 0.001884652
Median 0.000687285
Mode 0
Standard Deviation 0.014598452
Sample Variance 0.000213115
Kurtosis 0.354319323
Skewness -0.312379552
Range 0.074426677
Minimum -0.040235312
Maximum 0.034191365
Sum 0.069557786
Count 60
0
5
10
15
20
25
30
35
40
-0.040235312-0.021628643-0.003021974 0.015584696 0.034191365 0.052798034
Axis Title
Axis Title
Frequency
From the results of the descriptive analysis and histogram we can state that the share prices for Spark New
Zealand Limited fulfill the requirement for Geometric Brownian Motion (GBM).
Question 5
The computations of drift and volatility in excel are presented below. From the results, we see that drift and
volatility are not constant with time. Moreover, the value of drift is higher and that of volatility is lower, when
the historical data being used is for a short period (1 month) compared to when it’s for a longer period (3
months). The Annual drift and volatility are larger than their daily counterparts (Farida, et.al. 2018).
tabler-icon-diamond-filled.svg

Secure Best Marks with AI Grader

Need help grading? Try our AI Grader for instant feedback on your assignments.
Document Page
Spark New Zealand 5
All Three Months Daily Annualized
Drift 0.001159 0.2921427
Volatility 0.014598 0.23174325
Month of May Daily Annualized
Drift 0.002443 0.6156969
Volatility 0.014036 0.22280773
Question 6
Initial Stock price=3.355 (stock price of 28th of February 2018)
Day for trading t=78
Drift=0.001159
Volatility=0.014598
St =S0 exp [ ( μ σ2
2 )t ]
Hence
S78=3.355exp [ ( 0.001159 0.0145982
2 )78]
Stock Price of 15th of June 2018 is found to be 3.642
The actual stock price on that date was 3.855; which means the estimated figure undervalued the share price on
that particular date.
Question 7
Document Page
Spark New Zealand 6
According to financial statements released by Spark New Zealand limited the daily drift and volatility for the
stock prices has changed very little over the years due to market dominance, and brand awareness. The stock
prices have increased steadily over the past 5 year. This gradual increment is an indication that the company has
a drift that is slightly larger than its volatility. The company returns can therefore be considered to be largely
positive with minimal incidences of loss (i.e. negative returns). Spark New Zealand Limited has a stable share
price that demonstrates upwards movement due to effective management, proper planning and management of
resources. On the other hand, the share value for Spark New Zealand limited stocks is considerably low due to
low dividend payouts, average profitability reports, and the presence of strong competitors in the New Zealand
market. According to financial analysts, the company can improve its overall market share value by going
international especially in the Asian and European market. If the brand realizes international success their
overall share prices would be expected to rise greatly from figures between $3 and $4 to somewhere between $6
and $10. The movement would improve the solvency of the company and increase the confidence held by
stakeholders and investors with regard to the going concern of the business; as well as, the leadership and
management techniques employed by the organization.
Document Page
Spark New Zealand 7
References
Farida, AW, Restu, AI & Putri, E 2018, 'Stock price prediction using geometric Brownian motion. ', Journal of
Physics: Conference Series. , vol 974, no. 1, pp. 1-11.
Shaik, M & Maheswaran, S 2018, ' Robust Volatility Estimation with and Without the Drift Paramete', Journal
of Quantitative Economics, vol 17, no. 2, pp. 12-14.
chevron_up_icon
1 out of 7
circle_padding
hide_on_mobile
zoom_out_icon
logo.png

Your All-in-One AI-Powered Toolkit for Academic Success.

Available 24*7 on WhatsApp / Email

[object Object]