BA30592E Recording Business Transactions - University of West London
VerifiedAdded on 2023/04/06
|16
|2195
|182
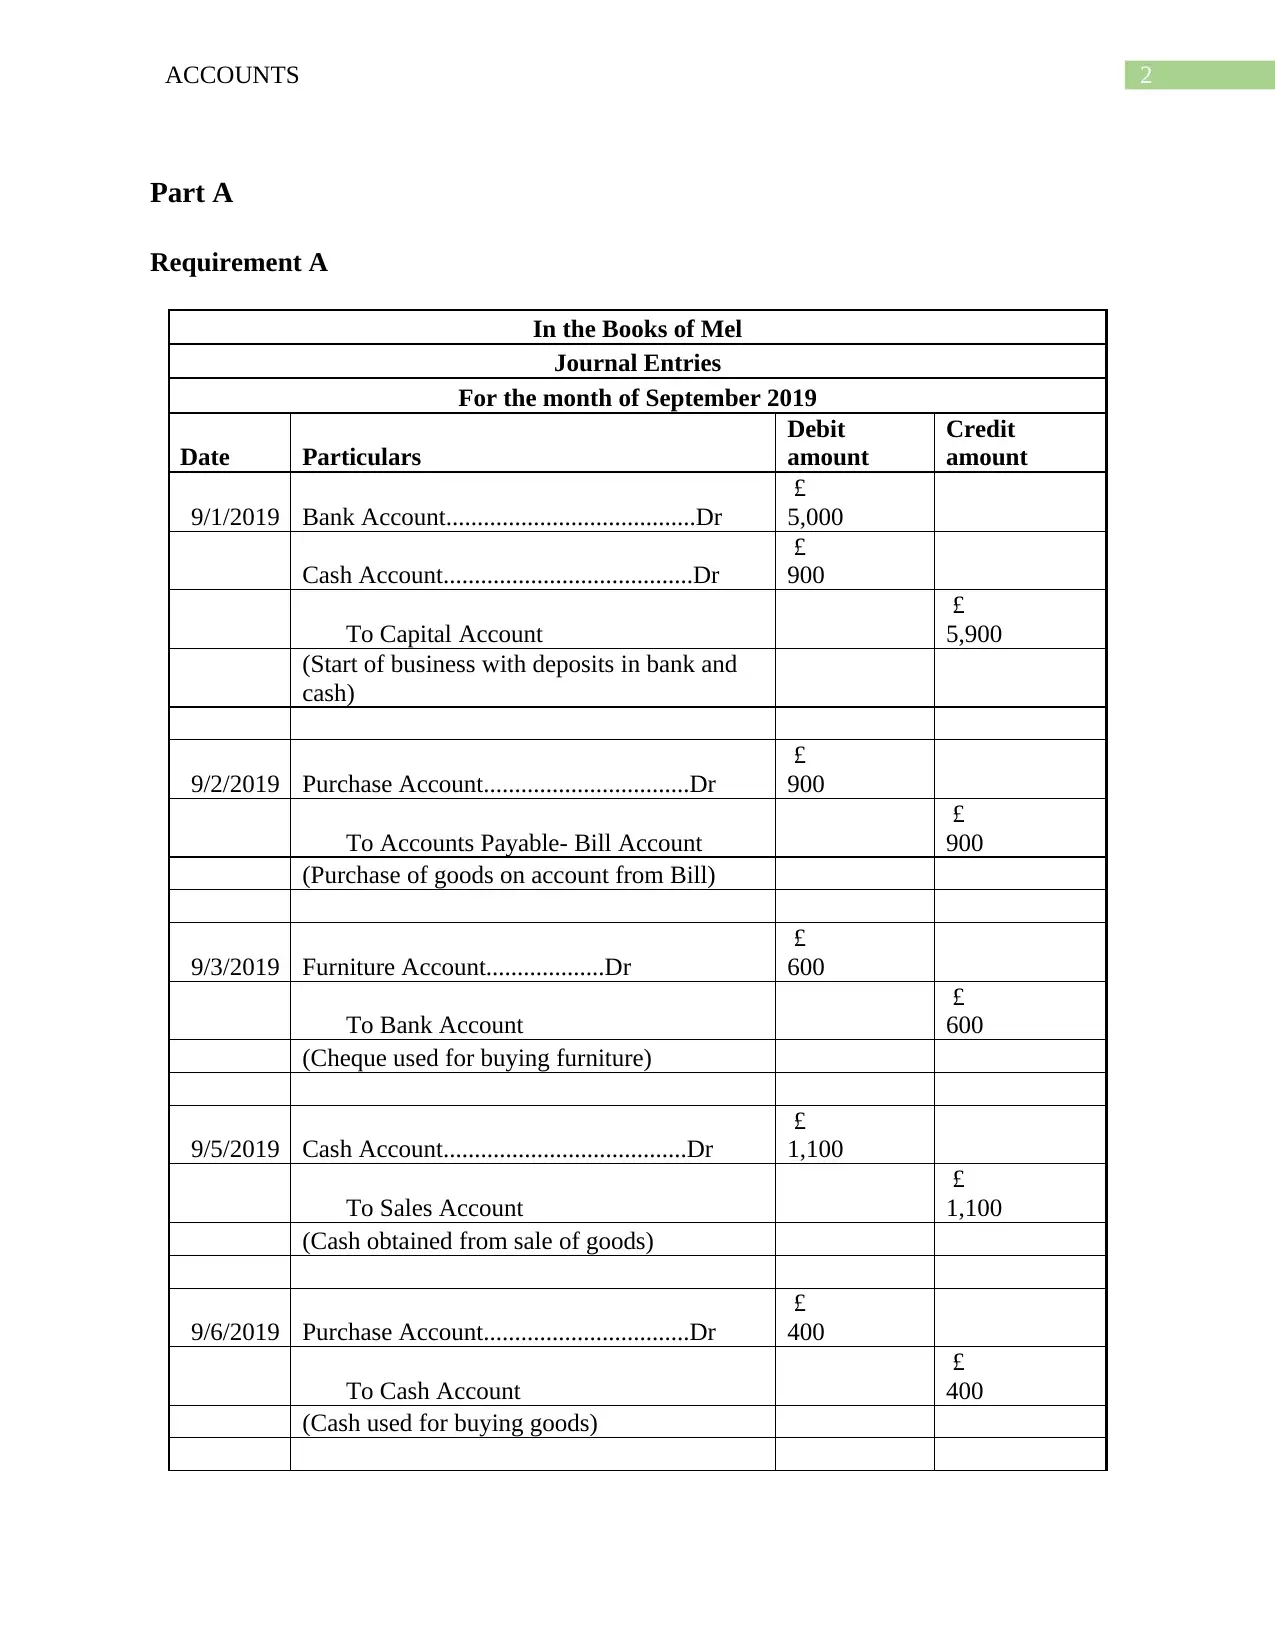
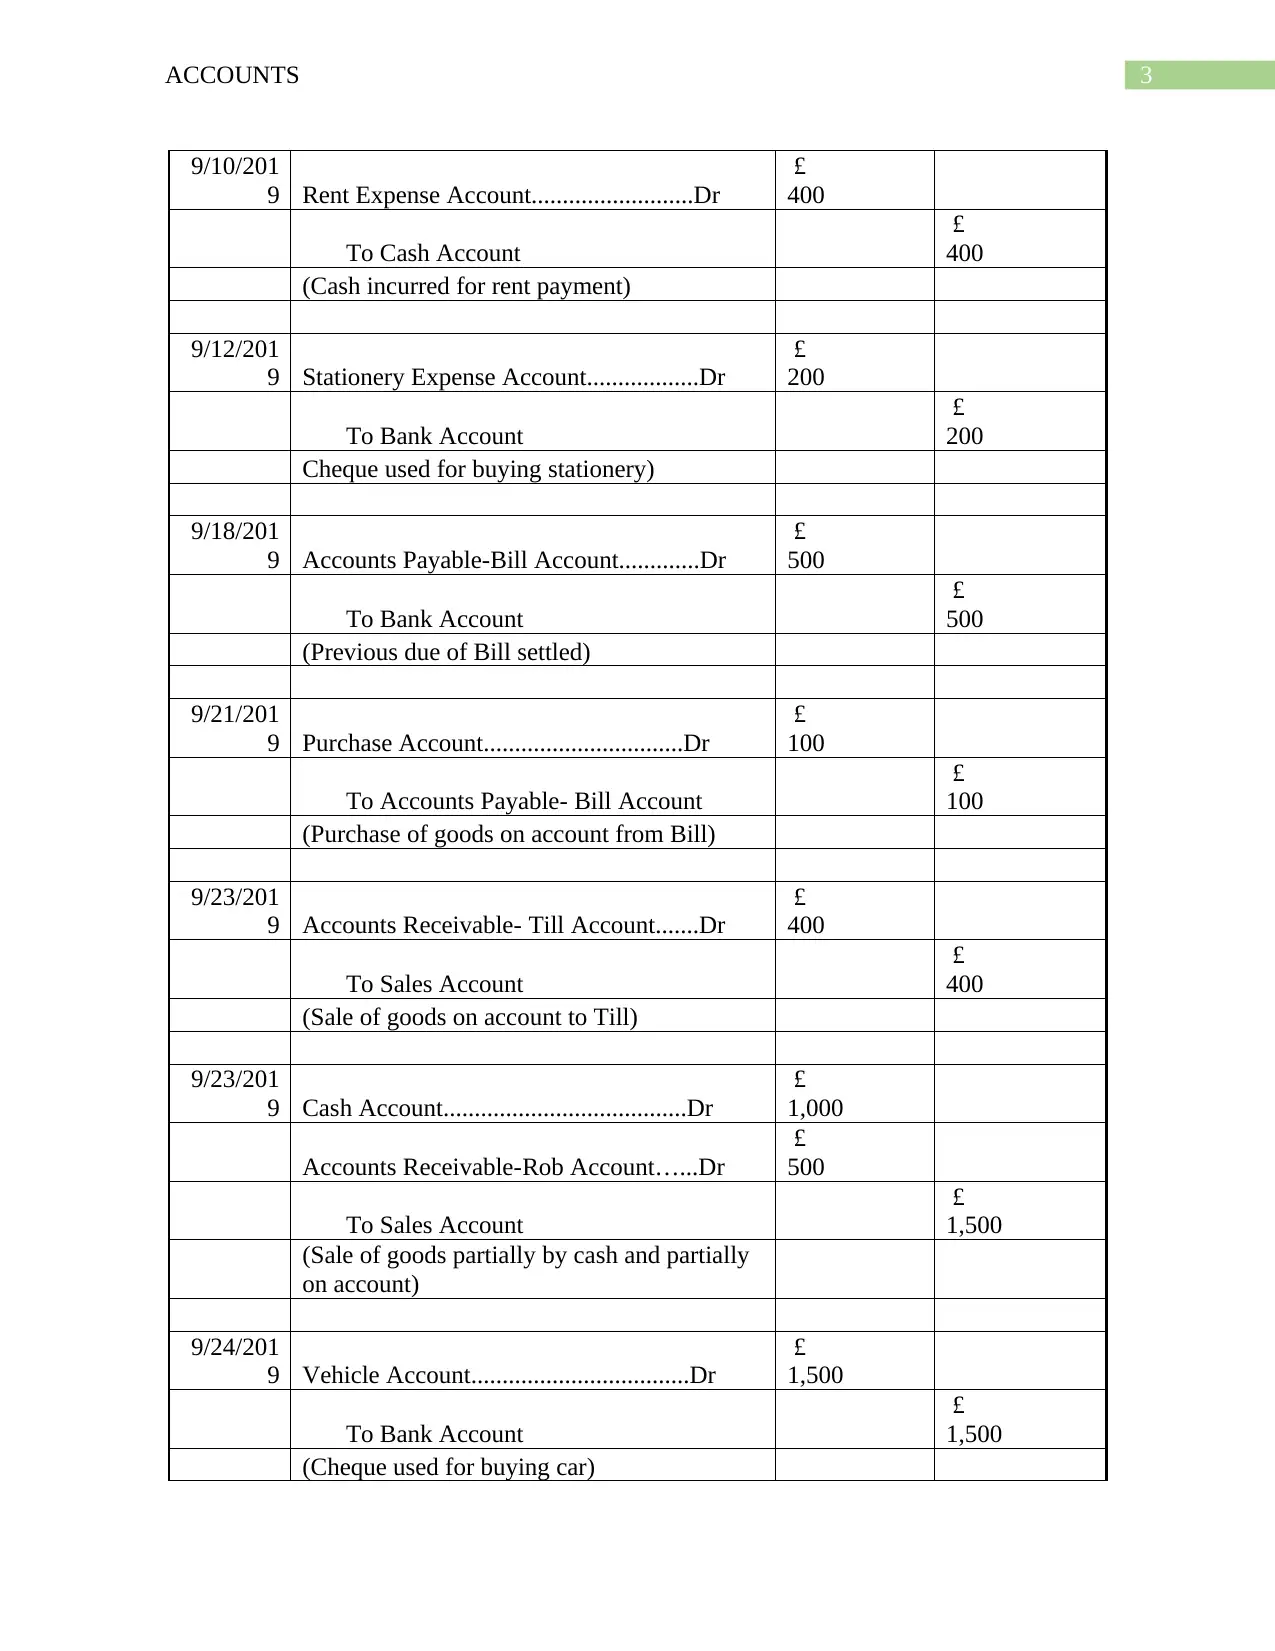
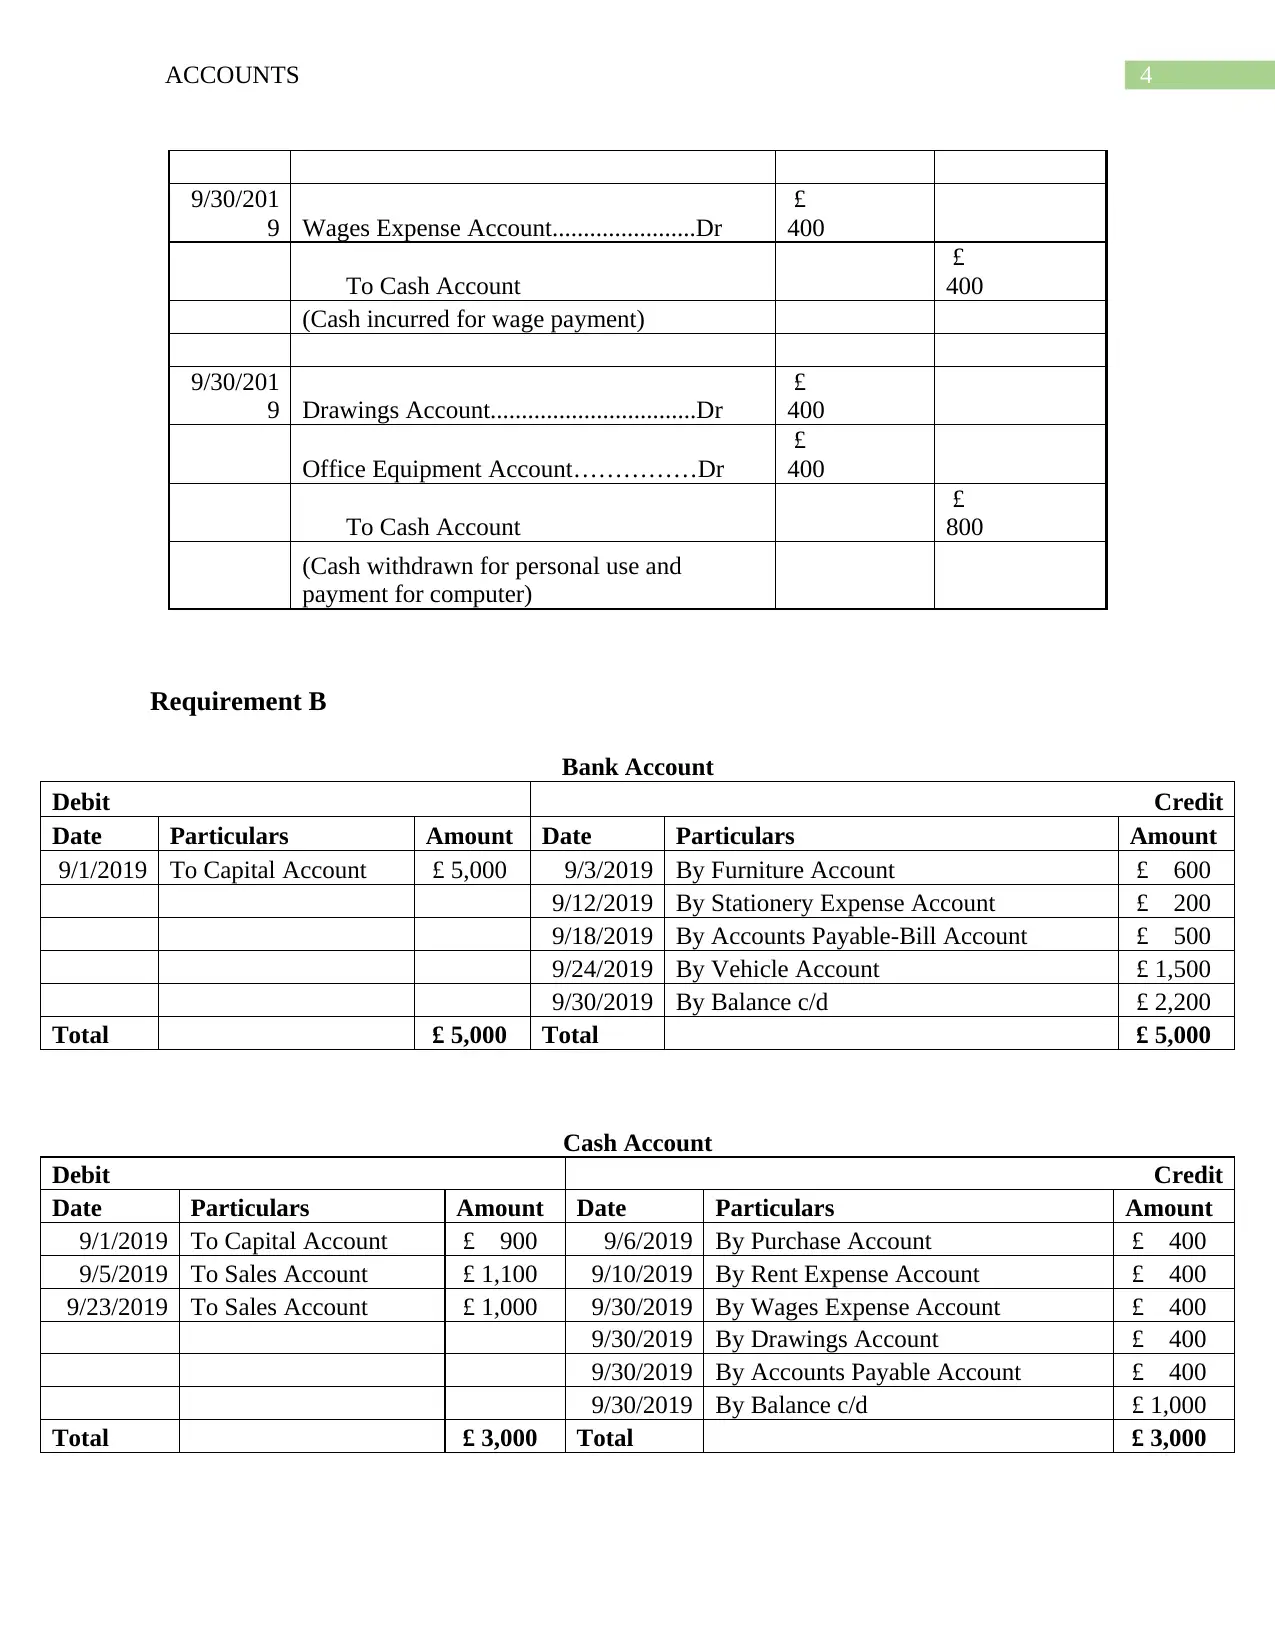
Practical Assignment
AI Summary
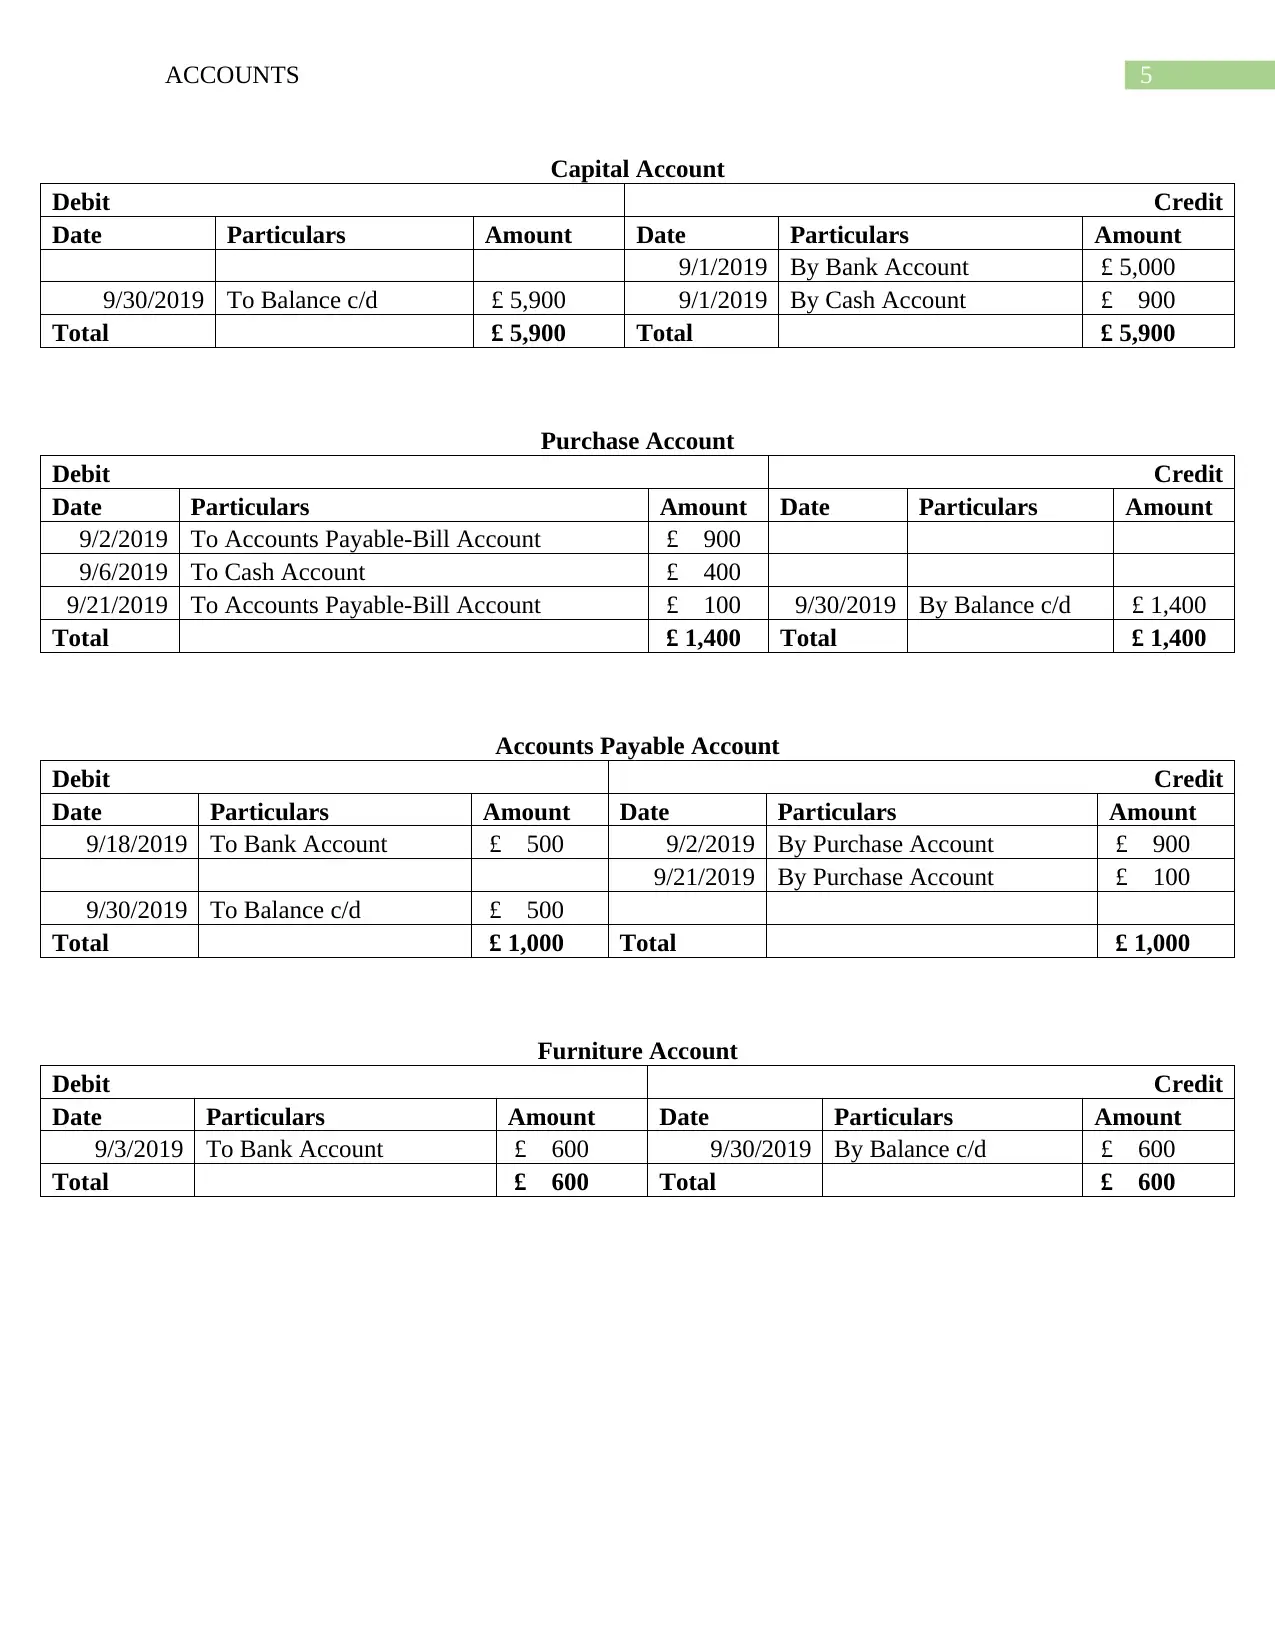
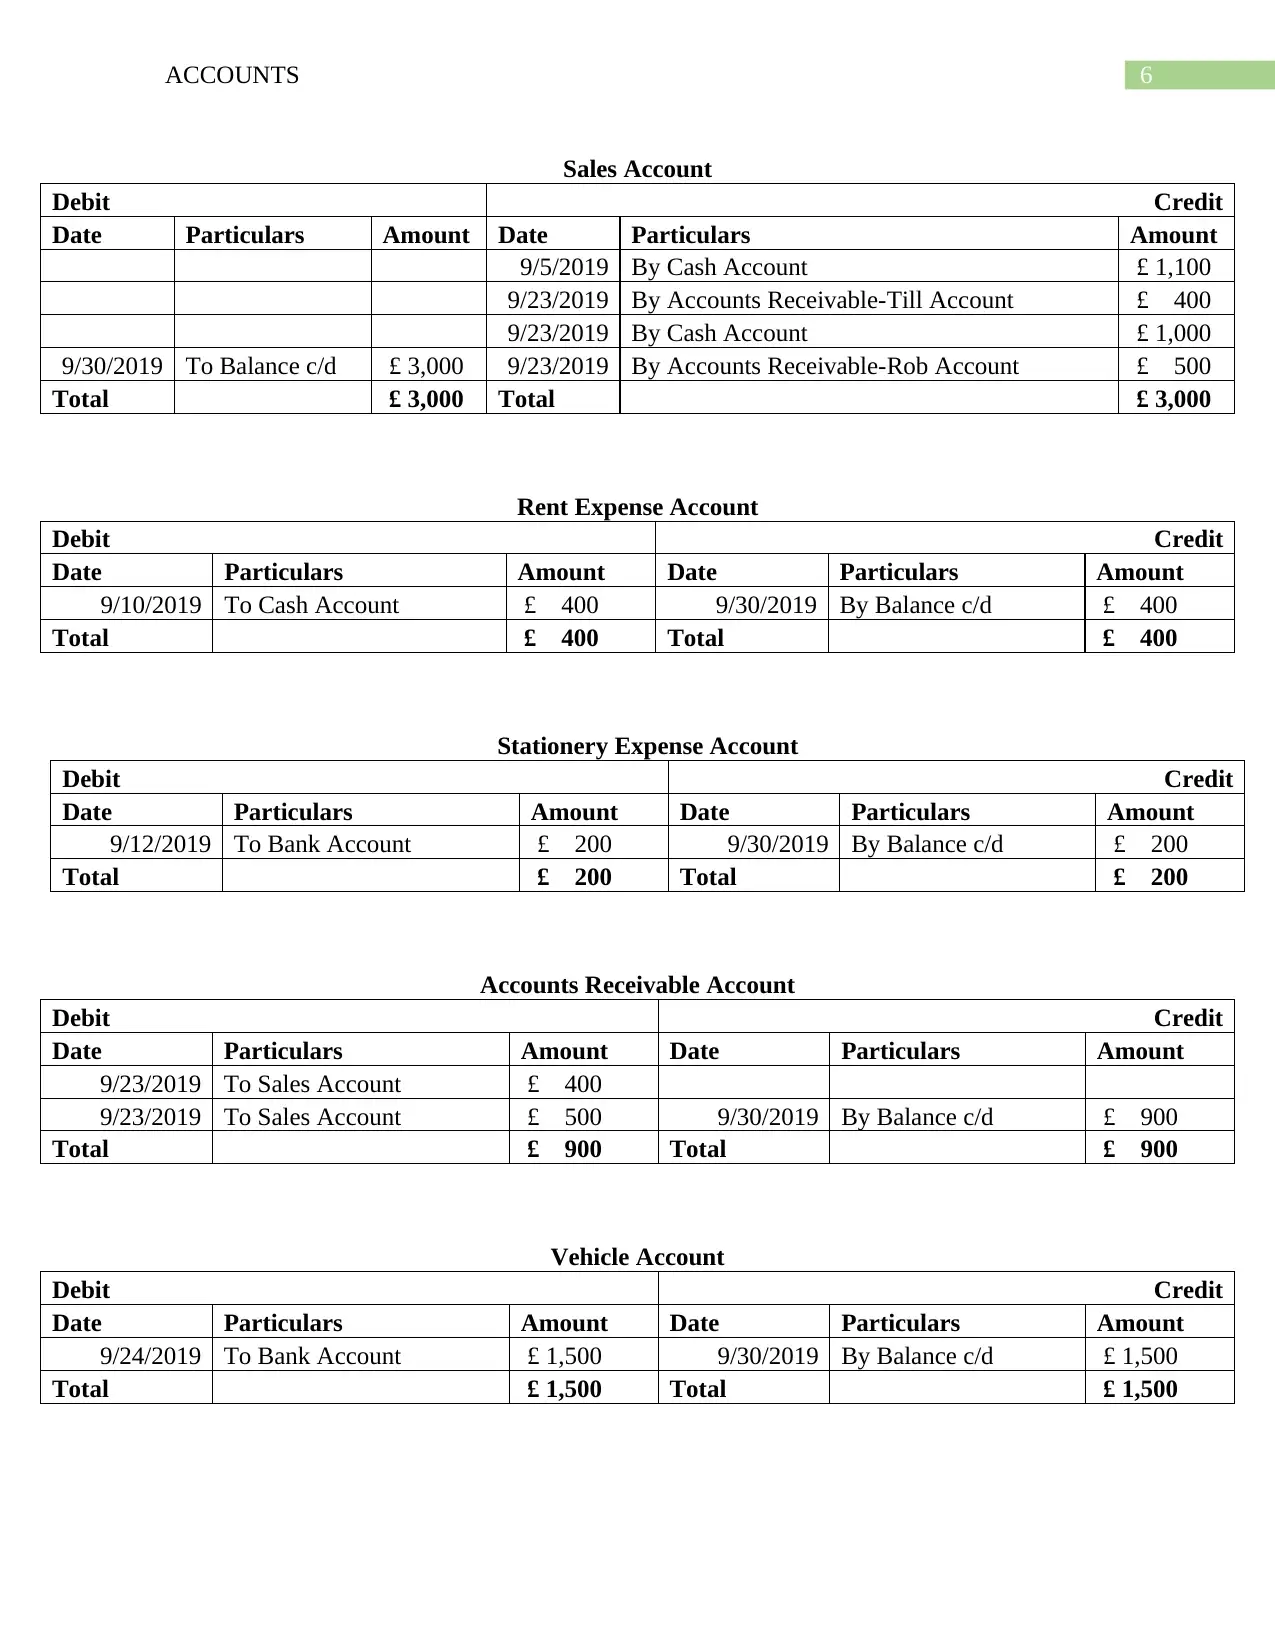
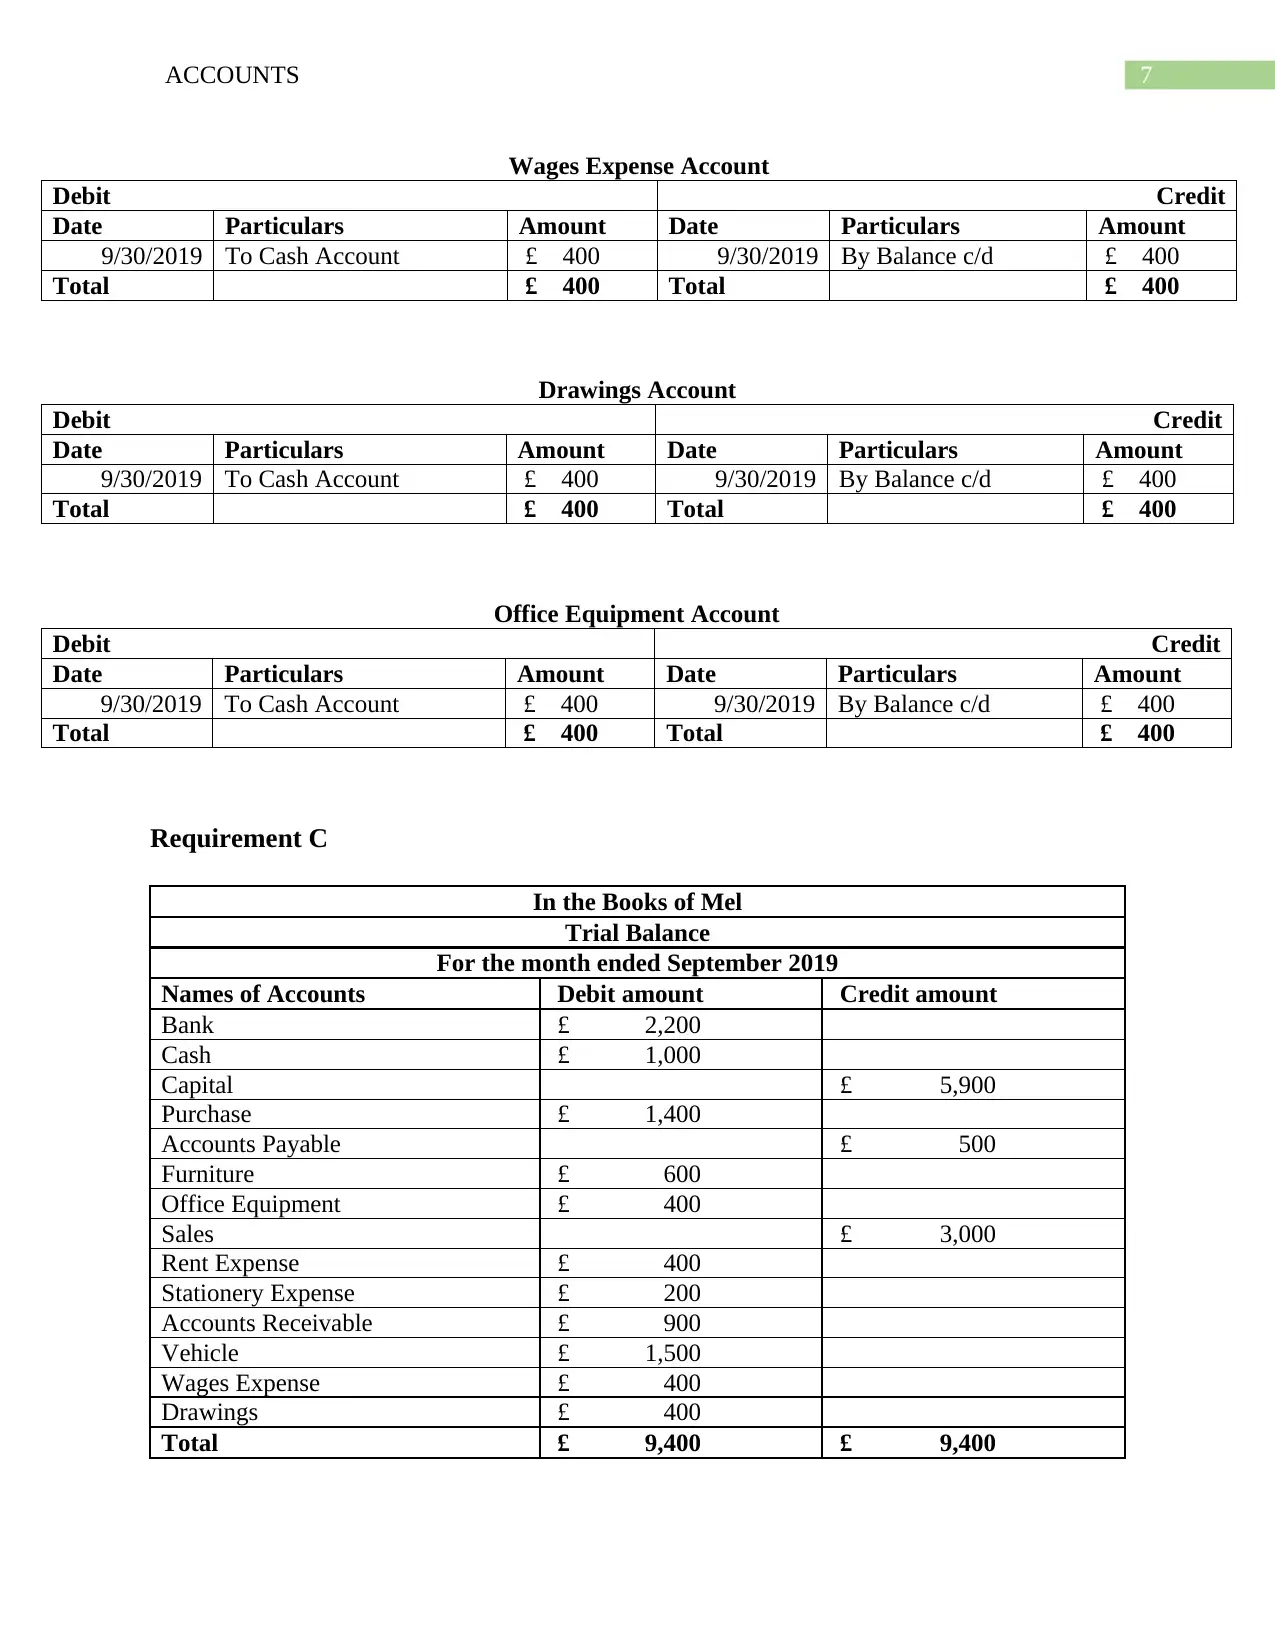
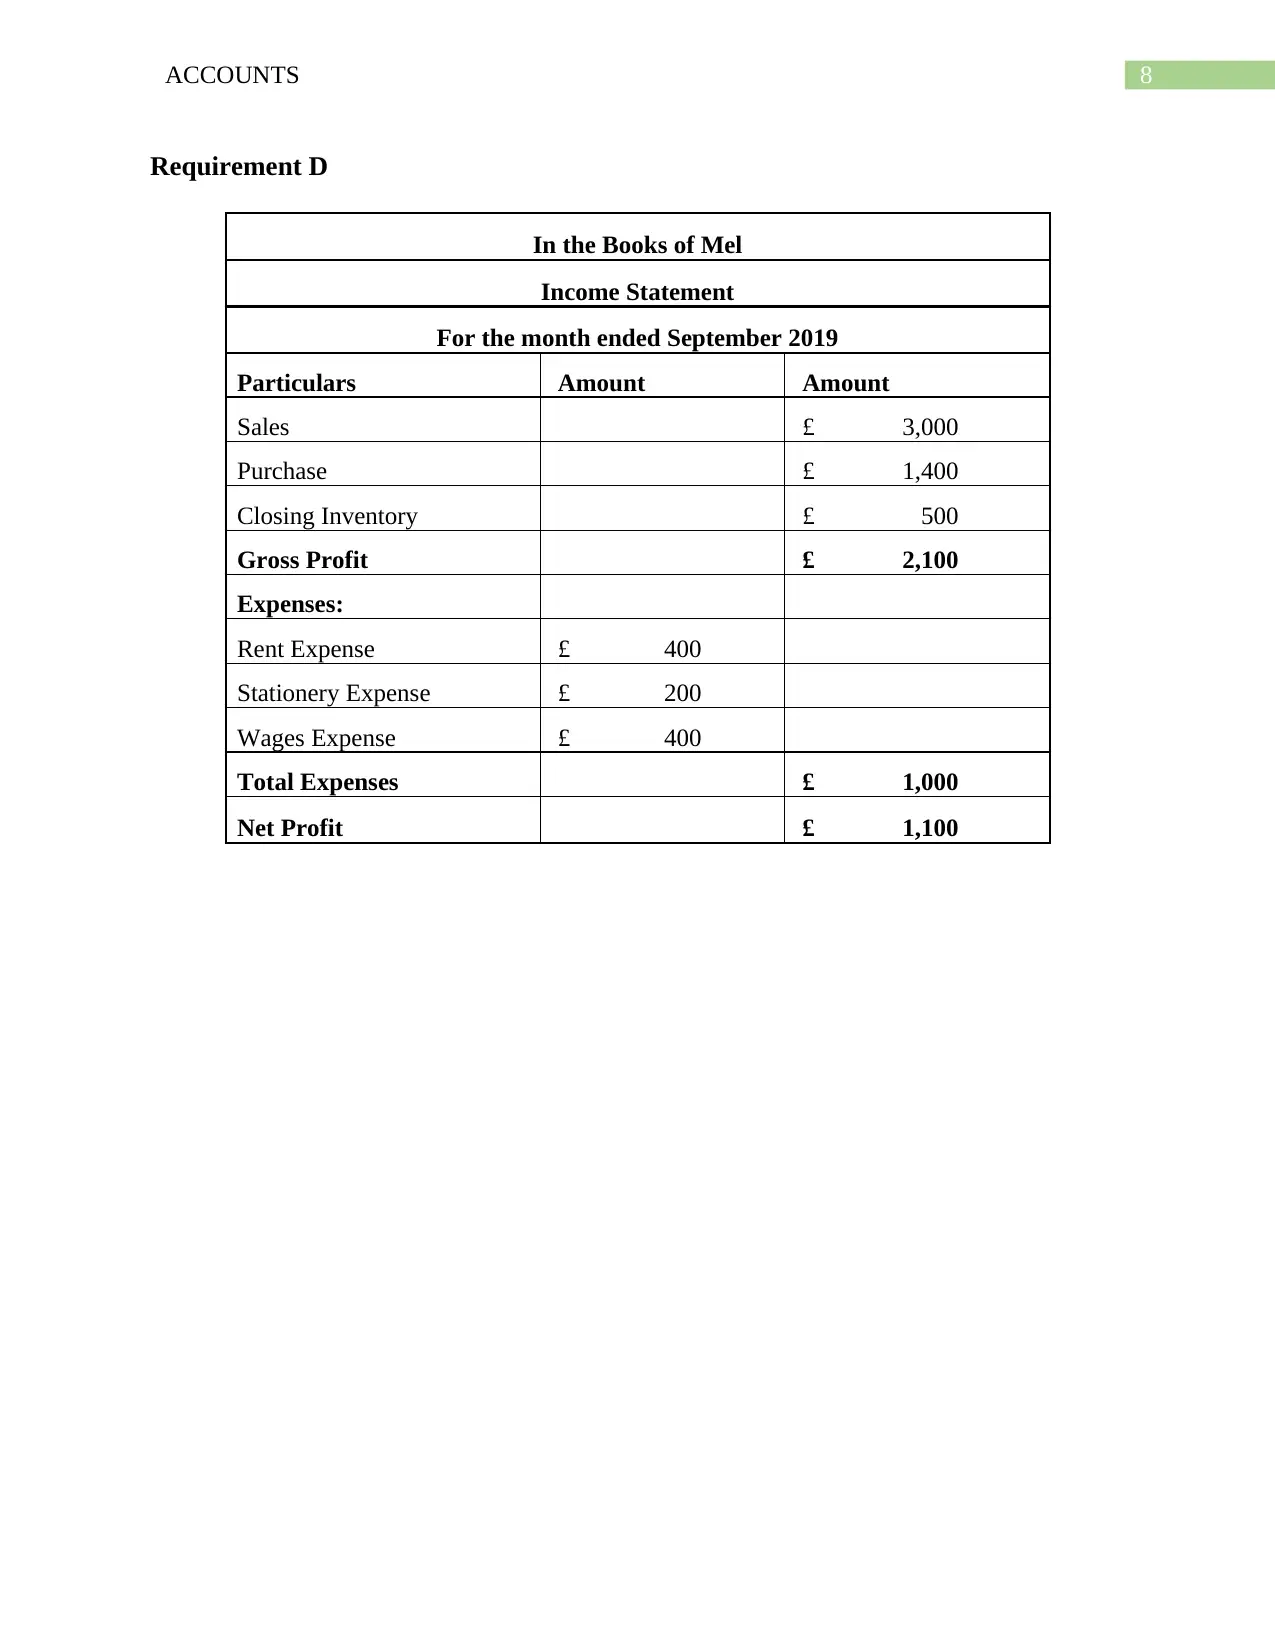
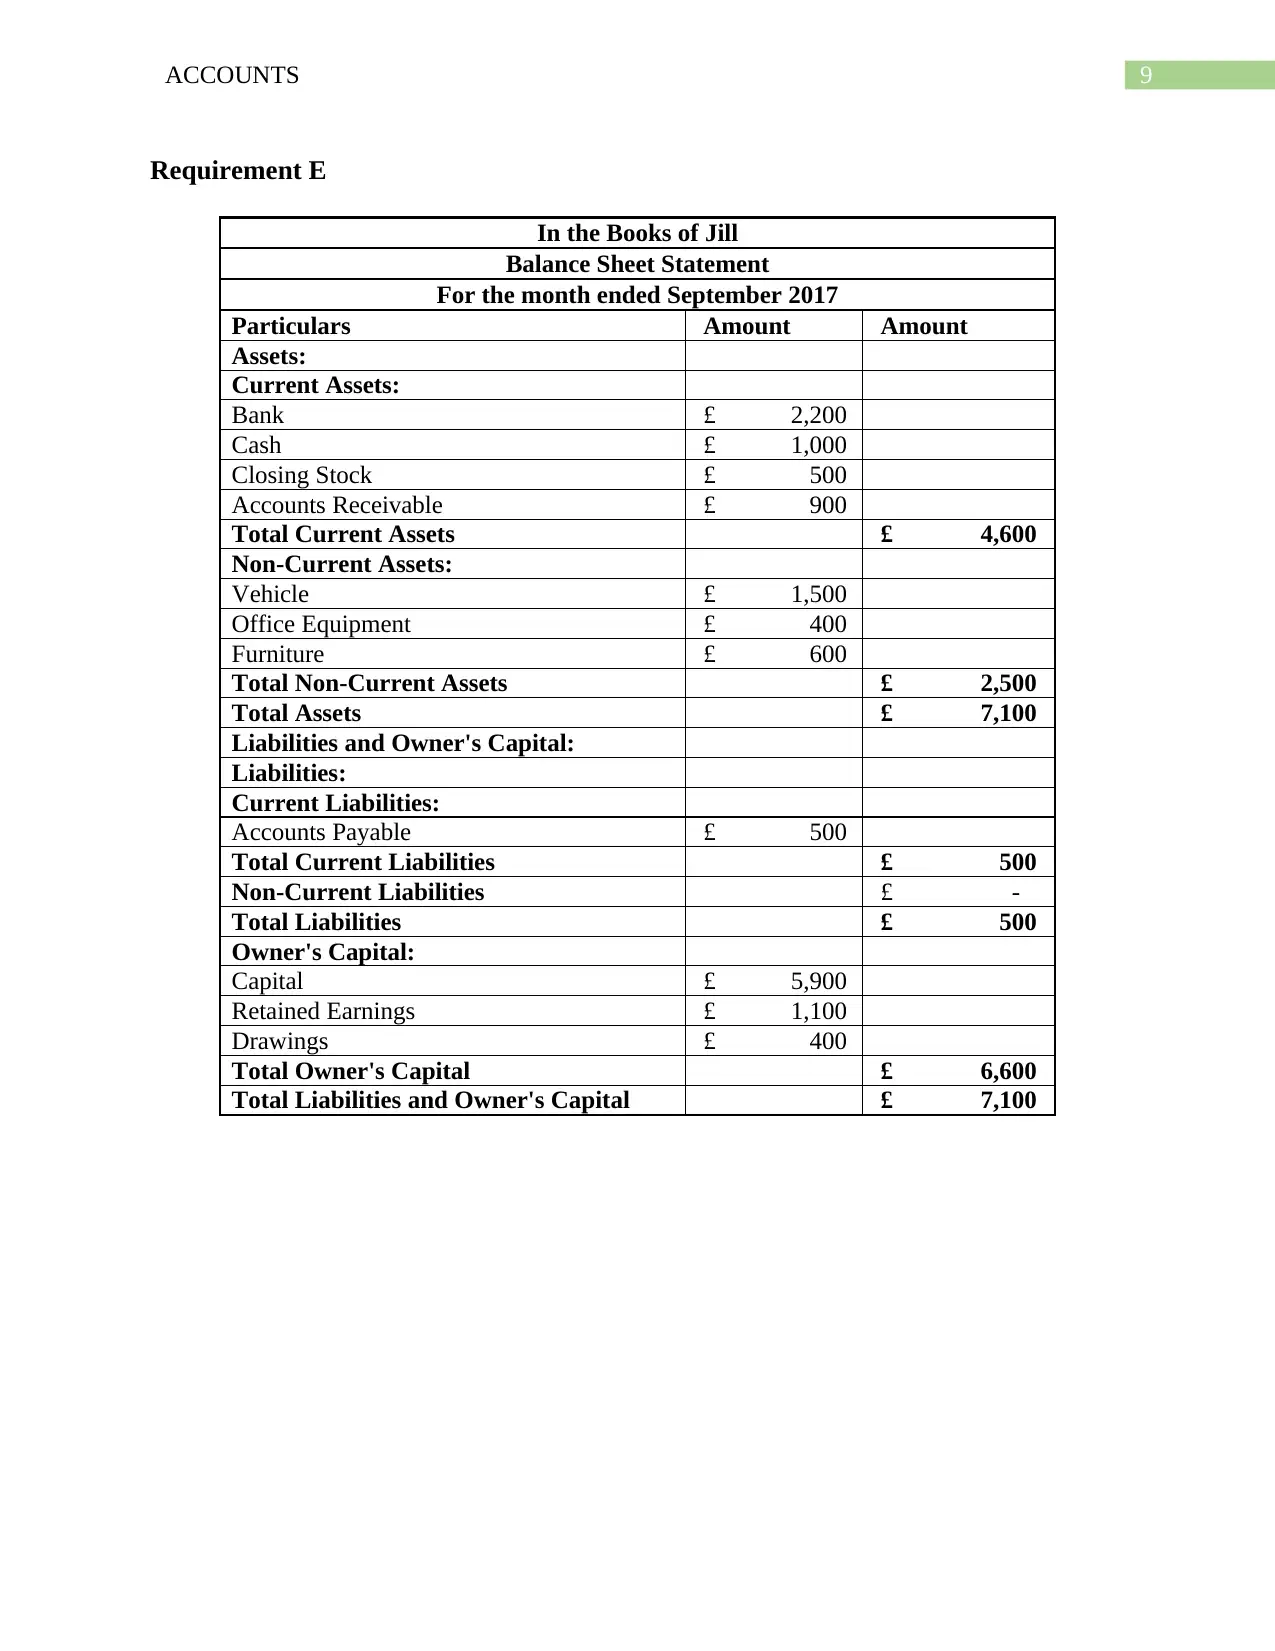
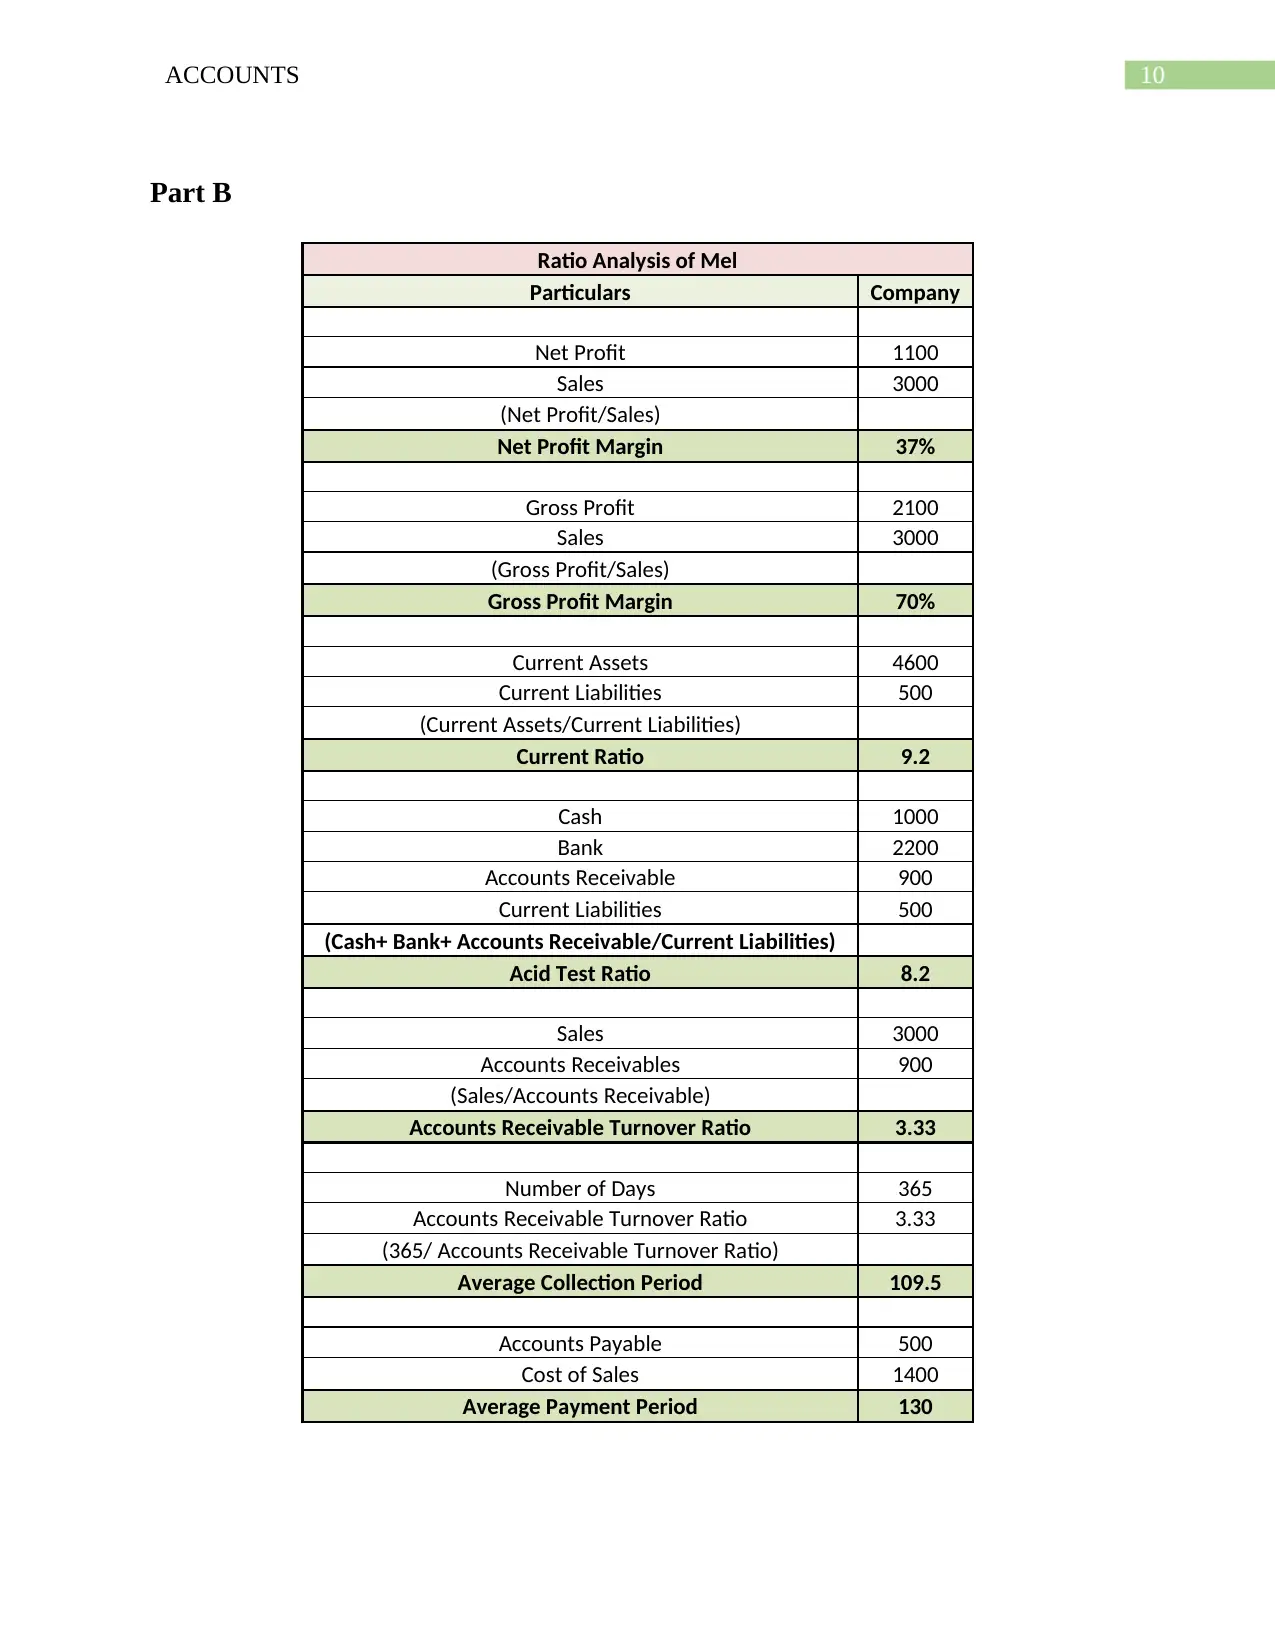
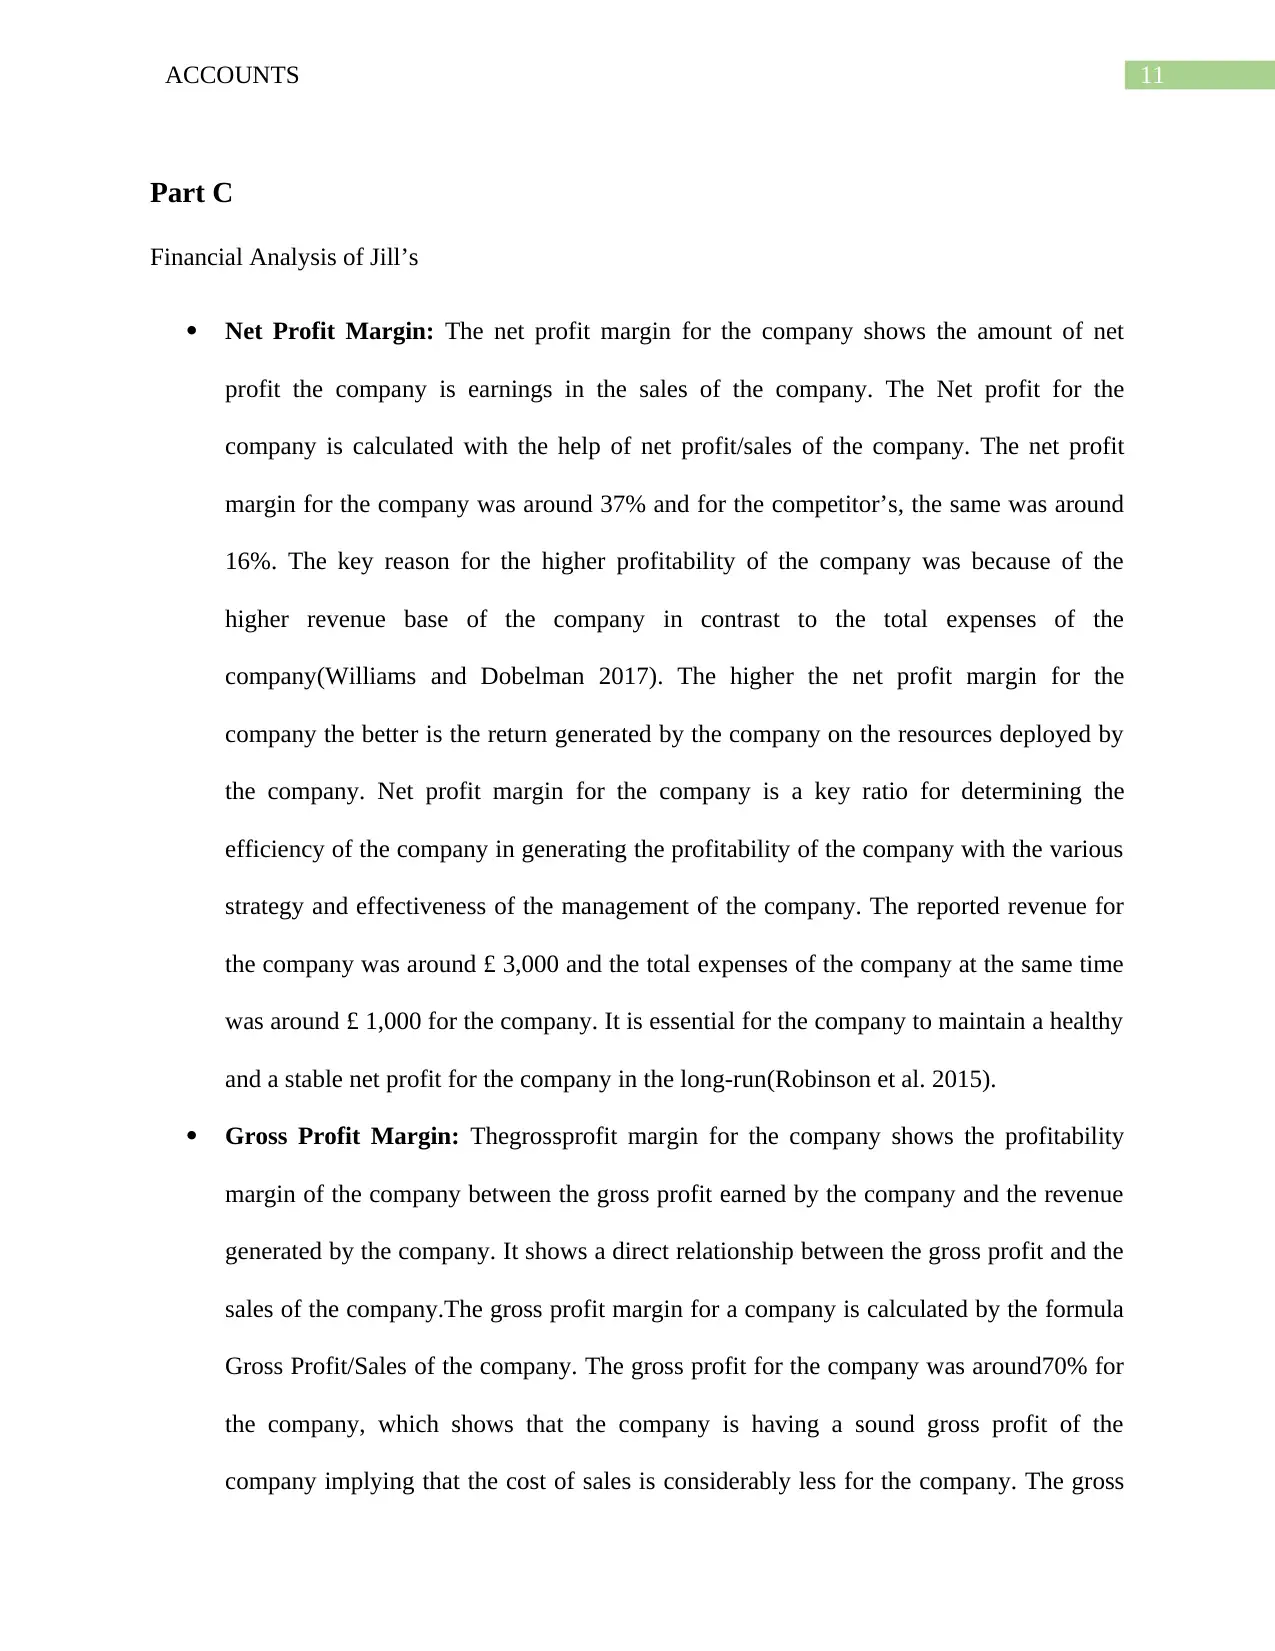
This assignment provides a detailed solution to a practical accounting problem involving the recording of business transactions for Mel, who commences trading on October 1, 2018. The solution includes journal entries for September 2019, T-accounts, a trial balance, an income statement, and a balance sheet. Additionally, the assignment includes a ratio analysis of Mel's financial performance, covering key metrics such as net profit margin, gross profit margin, current ratio, acid test ratio, accounts receivable turnover, and accounts payable payment period. Finally, a financial analysis of Jill’s company is conducted, comparing its performance against competitors, focusing on net profit margin, gross profit margin, current ratio, acid test ratio, accounts receivable collection period, and accounts payable payment period. This document is available on Desklib, a platform offering a range of study tools and solved assignments for students.
Contribute Materials
Your contribution can guide someone’s learning journey. Share your
documents today.

Running head: ACCOUNTS
Accounts
Name of the Student:
Name of the University:
Author’s Note:
Accounts
Name of the Student:
Name of the University:
Author’s Note:
Secure Best Marks with AI Grader
Need help grading? Try our AI Grader for instant feedback on your assignments.

1ACCOUNTS
Table of Contents
Part A...............................................................................................................................................2
Requirement A.............................................................................................................................2
Requirement B.............................................................................................................................4
Requirement C.............................................................................................................................7
Requirement D.............................................................................................................................8
Requirement E.............................................................................................................................9
Part B.............................................................................................................................................10
Part C.............................................................................................................................................11
Bibliography..................................................................................................................................14

2ACCOUNTS
Part A
Requirement A
In the Books of Mel
Journal Entries
For the month of September 2019
Date Particulars
Debit
amount
Credit
amount
9/1/2019 Bank Account........................................Dr
£
5,000
Cash Account........................................Dr
£
900
To Capital Account
£
5,900
(Start of business with deposits in bank and
cash)
9/2/2019 Purchase Account.................................Dr
£
900
To Accounts Payable- Bill Account
£
900
(Purchase of goods on account from Bill)
9/3/2019 Furniture Account...................Dr
£
600
To Bank Account
£
600
(Cheque used for buying furniture)
9/5/2019 Cash Account.......................................Dr
£
1,100
To Sales Account
£
1,100
(Cash obtained from sale of goods)
9/6/2019 Purchase Account.................................Dr
£
400
To Cash Account
£
400
(Cash used for buying goods)

3ACCOUNTS
9/10/201
9 Rent Expense Account..........................Dr
£
400
To Cash Account
£
400
(Cash incurred for rent payment)
9/12/201
9 Stationery Expense Account..................Dr
£
200
To Bank Account
£
200
Cheque used for buying stationery)
9/18/201
9 Accounts Payable-Bill Account.............Dr
£
500
To Bank Account
£
500
(Previous due of Bill settled)
9/21/201
9 Purchase Account................................Dr
£
100
To Accounts Payable- Bill Account
£
100
(Purchase of goods on account from Bill)
9/23/201
9 Accounts Receivable- Till Account.......Dr
£
400
To Sales Account
£
400
(Sale of goods on account to Till)
9/23/201
9 Cash Account.......................................Dr
£
1,000
Accounts Receivable-Rob Account…...Dr
£
500
To Sales Account
£
1,500
(Sale of goods partially by cash and partially
on account)
9/24/201
9 Vehicle Account...................................Dr
£
1,500
To Bank Account
£
1,500
(Cheque used for buying car)
Secure Best Marks with AI Grader
Need help grading? Try our AI Grader for instant feedback on your assignments.

4ACCOUNTS
9/30/201
9 Wages Expense Account.......................Dr
£
400
To Cash Account
£
400
(Cash incurred for wage payment)
9/30/201
9 Drawings Account.................................Dr
£
400
Office Equipment Account……………Dr
£
400
To Cash Account
£
800
(Cash withdrawn for personal use and
payment for computer)
Requirement B
Bank Account
Debit Credit
Date Particulars Amount Date Particulars Amount
9/1/2019 To Capital Account £ 5,000 9/3/2019 By Furniture Account £ 600
9/12/2019 By Stationery Expense Account £ 200
9/18/2019 By Accounts Payable-Bill Account £ 500
9/24/2019 By Vehicle Account £ 1,500
9/30/2019 By Balance c/d £ 2,200
Total £ 5,000 Total £ 5,000
Cash Account
Debit Credit
Date Particulars Amount Date Particulars Amount
9/1/2019 To Capital Account £ 900 9/6/2019 By Purchase Account £ 400
9/5/2019 To Sales Account £ 1,100 9/10/2019 By Rent Expense Account £ 400
9/23/2019 To Sales Account £ 1,000 9/30/2019 By Wages Expense Account £ 400
9/30/2019 By Drawings Account £ 400
9/30/2019 By Accounts Payable Account £ 400
9/30/2019 By Balance c/d £ 1,000
Total £ 3,000 Total £ 3,000
9/30/201
9 Wages Expense Account.......................Dr
£
400
To Cash Account
£
400
(Cash incurred for wage payment)
9/30/201
9 Drawings Account.................................Dr
£
400
Office Equipment Account……………Dr
£
400
To Cash Account
£
800
(Cash withdrawn for personal use and
payment for computer)
Requirement B
Bank Account
Debit Credit
Date Particulars Amount Date Particulars Amount
9/1/2019 To Capital Account £ 5,000 9/3/2019 By Furniture Account £ 600
9/12/2019 By Stationery Expense Account £ 200
9/18/2019 By Accounts Payable-Bill Account £ 500
9/24/2019 By Vehicle Account £ 1,500
9/30/2019 By Balance c/d £ 2,200
Total £ 5,000 Total £ 5,000
Cash Account
Debit Credit
Date Particulars Amount Date Particulars Amount
9/1/2019 To Capital Account £ 900 9/6/2019 By Purchase Account £ 400
9/5/2019 To Sales Account £ 1,100 9/10/2019 By Rent Expense Account £ 400
9/23/2019 To Sales Account £ 1,000 9/30/2019 By Wages Expense Account £ 400
9/30/2019 By Drawings Account £ 400
9/30/2019 By Accounts Payable Account £ 400
9/30/2019 By Balance c/d £ 1,000
Total £ 3,000 Total £ 3,000

5ACCOUNTS
Capital Account
Debit Credit
Date Particulars Amount Date Particulars Amount
9/1/2019 By Bank Account £ 5,000
9/30/2019 To Balance c/d £ 5,900 9/1/2019 By Cash Account £ 900
Total £ 5,900 Total £ 5,900
Purchase Account
Debit Credit
Date Particulars Amount Date Particulars Amount
9/2/2019 To Accounts Payable-Bill Account £ 900
9/6/2019 To Cash Account £ 400
9/21/2019 To Accounts Payable-Bill Account £ 100 9/30/2019 By Balance c/d £ 1,400
Total £ 1,400 Total £ 1,400
Accounts Payable Account
Debit Credit
Date Particulars Amount Date Particulars Amount
9/18/2019 To Bank Account £ 500 9/2/2019 By Purchase Account £ 900
9/21/2019 By Purchase Account £ 100
9/30/2019 To Balance c/d £ 500
Total £ 1,000 Total £ 1,000
Furniture Account
Debit Credit
Date Particulars Amount Date Particulars Amount
9/3/2019 To Bank Account £ 600 9/30/2019 By Balance c/d £ 600
Total £ 600 Total £ 600

6ACCOUNTS
Sales Account
Debit Credit
Date Particulars Amount Date Particulars Amount
9/5/2019 By Cash Account £ 1,100
9/23/2019 By Accounts Receivable-Till Account £ 400
9/23/2019 By Cash Account £ 1,000
9/30/2019 To Balance c/d £ 3,000 9/23/2019 By Accounts Receivable-Rob Account £ 500
Total £ 3,000 Total £ 3,000
Rent Expense Account
Debit Credit
Date Particulars Amount Date Particulars Amount
9/10/2019 To Cash Account £ 400 9/30/2019 By Balance c/d £ 400
Total £ 400 Total £ 400
Stationery Expense Account
Debit Credit
Date Particulars Amount Date Particulars Amount
9/12/2019 To Bank Account £ 200 9/30/2019 By Balance c/d £ 200
Total £ 200 Total £ 200
Accounts Receivable Account
Debit Credit
Date Particulars Amount Date Particulars Amount
9/23/2019 To Sales Account £ 400
9/23/2019 To Sales Account £ 500 9/30/2019 By Balance c/d £ 900
Total £ 900 Total £ 900
Vehicle Account
Debit Credit
Date Particulars Amount Date Particulars Amount
9/24/2019 To Bank Account £ 1,500 9/30/2019 By Balance c/d £ 1,500
Total £ 1,500 Total £ 1,500
Paraphrase This Document
Need a fresh take? Get an instant paraphrase of this document with our AI Paraphraser

7ACCOUNTS
Wages Expense Account
Debit Credit
Date Particulars Amount Date Particulars Amount
9/30/2019 To Cash Account £ 400 9/30/2019 By Balance c/d £ 400
Total £ 400 Total £ 400
Drawings Account
Debit Credit
Date Particulars Amount Date Particulars Amount
9/30/2019 To Cash Account £ 400 9/30/2019 By Balance c/d £ 400
Total £ 400 Total £ 400
Office Equipment Account
Debit Credit
Date Particulars Amount Date Particulars Amount
9/30/2019 To Cash Account £ 400 9/30/2019 By Balance c/d £ 400
Total £ 400 Total £ 400
Requirement C
In the Books of Mel
Trial Balance
For the month ended September 2019
Names of Accounts Debit amount Credit amount
Bank £ 2,200
Cash £ 1,000
Capital £ 5,900
Purchase £ 1,400
Accounts Payable £ 500
Furniture £ 600
Office Equipment £ 400
Sales £ 3,000
Rent Expense £ 400
Stationery Expense £ 200
Accounts Receivable £ 900
Vehicle £ 1,500
Wages Expense £ 400
Drawings £ 400
Total £ 9,400 £ 9,400

8ACCOUNTS
Requirement D
In the Books of Mel
Income Statement
For the month ended September 2019
Particulars Amount Amount
Sales £ 3,000
Purchase £ 1,400
Closing Inventory £ 500
Gross Profit £ 2,100
Expenses:
Rent Expense £ 400
Stationery Expense £ 200
Wages Expense £ 400
Total Expenses £ 1,000
Net Profit £ 1,100

9ACCOUNTS
Requirement E
In the Books of Jill
Balance Sheet Statement
For the month ended September 2017
Particulars Amount Amount
Assets:
Current Assets:
Bank £ 2,200
Cash £ 1,000
Closing Stock £ 500
Accounts Receivable £ 900
Total Current Assets £ 4,600
Non-Current Assets:
Vehicle £ 1,500
Office Equipment £ 400
Furniture £ 600
Total Non-Current Assets £ 2,500
Total Assets £ 7,100
Liabilities and Owner's Capital:
Liabilities:
Current Liabilities:
Accounts Payable £ 500
Total Current Liabilities £ 500
Non-Current Liabilities £ -
Total Liabilities £ 500
Owner's Capital:
Capital £ 5,900
Retained Earnings £ 1,100
Drawings £ 400
Total Owner's Capital £ 6,600
Total Liabilities and Owner's Capital £ 7,100
Secure Best Marks with AI Grader
Need help grading? Try our AI Grader for instant feedback on your assignments.

10ACCOUNTS
Part B
Ratio Analysis of Mel
Particulars Company
Net Profit 1100
Sales 3000
(Net Profit/Sales)
Net Profit Margin 37%
Gross Profit 2100
Sales 3000
(Gross Profit/Sales)
Gross Profit Margin 70%
Current Assets 4600
Current Liabilities 500
(Current Assets/Current Liabilities)
Current Ratio 9.2
Cash 1000
Bank 2200
Accounts Receivable 900
Current Liabilities 500
(Cash+ Bank+ Accounts Receivable/Current Liabilities)
Acid Test Ratio 8.2
Sales 3000
Accounts Receivables 900
(Sales/Accounts Receivable)
Accounts Receivable Turnover Ratio 3.33
Number of Days 365
Accounts Receivable Turnover Ratio 3.33
(365/ Accounts Receivable Turnover Ratio)
Average Collection Period 109.5
Accounts Payable 500
Cost of Sales 1400
Average Payment Period 130

11ACCOUNTS
Part C
Financial Analysis of Jill’s
Net Profit Margin: The net profit margin for the company shows the amount of net
profit the company is earnings in the sales of the company. The Net profit for the
company is calculated with the help of net profit/sales of the company. The net profit
margin for the company was around 37% and for the competitor’s, the same was around
16%. The key reason for the higher profitability of the company was because of the
higher revenue base of the company in contrast to the total expenses of the
company(Williams and Dobelman 2017). The higher the net profit margin for the
company the better is the return generated by the company on the resources deployed by
the company. Net profit margin for the company is a key ratio for determining the
efficiency of the company in generating the profitability of the company with the various
strategy and effectiveness of the management of the company. The reported revenue for
the company was around £ 3,000 and the total expenses of the company at the same time
was around £ 1,000 for the company. It is essential for the company to maintain a healthy
and a stable net profit for the company in the long-run(Robinson et al. 2015).
Gross Profit Margin: Thegrossprofit margin for the company shows the profitability
margin of the company between the gross profit earned by the company and the revenue
generated by the company. It shows a direct relationship between the gross profit and the
sales of the company.The gross profit margin for a company is calculated by the formula
Gross Profit/Sales of the company. The gross profit for the company was around70% for
the company, which shows that the company is having a sound gross profit of the
company implying that the cost of sales is considerably less for the company. The gross

12ACCOUNTS
profit margin for the competitor’s on the other hand was around 65%, which states that
the company is well ahead of the competitor’s average and saving more in terms of the
gross profitability of the company(Altman et al. 2017). It is essential for the companies to
maintain a healthy and sustainable gross and operating profitability of the company so
that the operating expenses of the company can be well paid off by the company in the
long-run.
Current Ratio: Thecurrent ratio shows the liquidity position of a company when
compared to the current liabilities of the company. The current ratio for a company shows
the ability of the company in managing the current liabilities or the obligations of the
company with the current assets of the company the current ratio for the company shows
the liquidity position of the company. The current ratio for the company was around 9.2
times which has been calculated with the help of formula Current Assets/Current
Liabilities. On the other hand, side the current ratio for the competitors company was
around 4.50 times this shows that the company has tried to well manage the current
liabilities of the company by maintain an optimal set of current assets of the
company(Penman 2015).
Acid Test Ratio: The Acid Test Ratio for the company shows the ability of company in
transferring the current assets of the company into cash for paying off the current
obligations of the company. The quick ratio for the company was around 8.2 times which
was much higher than the industry average of 4 times. This shows that the company is
having a sound liquidity position in the company(Mohanram, Saiy and Vyas 2018).
Accounts Receivable Collection Period: The receivable collection period shows the
average time taken by the company in collecting the receivables of the company from the
Paraphrase This Document
Need a fresh take? Get an instant paraphrase of this document with our AI Paraphraser

13ACCOUNTS
debtors of the company. The collection period for the company was around 110 days and
the same for the industry average was around 100 days this shows that the company on an
average is taking much greater amount of time in collecting the due amount.
Accounts Payable Payment Period: The accounts payable payment period shows the
time taken by the company for paying off the accounts payable of the company. The
accounts payable payment period for the company was around 130 days and the same for
the competitors average was around 105 days. This shows that the company is taking a
higher amount of time in paying off the obligations of the company with respect to the
competitors in the same industry(Mohanram, Saiy and Vyas 2018).

14ACCOUNTS
Bibliography
Altman, E.I., Iwanicz‐Drozdowska, M., Laitinen, E.K. and Suvas, A., 2017. Financial distress
prediction in an international context: A review and empirical analysis of Altman's Z‐score
model. Journal of International Financial Management & Accounting, 28(2), pp.131-171.
Hussin, A.H., Muda, S., Musman, M., Ramli, R., Sapari, J.M. and Zain, M.Y.M., 2017.
Accounting in 60 Minutes: Interactive Tool for Accounting Learning. In Symposium on
Innovation and Creativity (iMIT-SIC) (Vol. 1, pp. 1-4).
Lee, D.K., 2016. Method and apparatus for accounting process using integrated trial balance.
U.S. Patent Application 15/074,072.
Mohanram, P., Saiy, S. and Vyas, D., 2018. Fundamental analysis of banks: the use of financial
statement information to screen winners from losers. Review of Accounting Studies, 23(1),
pp.200-233.
Mohanram, P., Saiy, S. and Vyas, D., 2018. Fundamental analysis of banks: the use of financial
statement information to screen winners from losers. Review of Accounting Studies, 23(1),
pp.200-233.
Penman, S.H., 2015. Financial Ratios and Equity Valuation. Wiley Encyclopedia of
Management, pp.1-7
Robinson, T.R., Henry, E., Pirie, W.L. and Broihahn, M.A., 2015. International financial
statement analysis. John Wiley & Sons.
Smith, M., 2018. Luca Pacioli: The father of accounting. Available at SSRN 2320658.

15ACCOUNTS
Wibowo, A. and Delima, R., 2017. Design of Church Financial Information System with
Accounting Standards Using Rapid Application Development Method (Rad). Researchers
World, 8(4), p.93.
Williams, E.E. and Dobelman, J.A., 2017. Financial statement analysis. World Scientific Book
Chapters, pp.109-169.
1 out of 16
Related Documents

Your All-in-One AI-Powered Toolkit for Academic Success.
+13062052269
info@desklib.com
Available 24*7 on WhatsApp / Email
Unlock your academic potential
© 2024 | Zucol Services PVT LTD | All rights reserved.