Comprehensive Strategic Analysis of Red Company's Performance
VerifiedAdded on 2021/02/19
|28
|1905
|105
Report
AI Summary
This report provides a comprehensive strategic analysis of Red Company, a mobile phone manufacturer operating within a CEISM simulation. The analysis begins with a market overview, including competitor identification and an examination of geographic and technological factors influencing the market. It delves into consumer preferences, market segmentation, and sub-strategic groups. The report then applies Porter's Five Forces model and PESTEL analysis to assess the industry's external environment. A deep dive into economic factors, industry and product life cycles, industry size, and global capacity usage is conducted. The report identifies sources of competitive advantage and utilizes value chain analysis to evaluate cost structures. Furthermore, it critically analyzes the investment in R&D, followed by stakeholder analysis and management recommendations. The conclusion summarizes Red Company's performance, highlighting areas for improvement, particularly in cost control, and suggesting the application of total quality management and process reengineering techniques.

STRATEGY
Paraphrase This Document
Need a fresh take? Get an instant paraphrase of this document with our AI Paraphraser
TABLE OF CONTENT
INTRODUCTION...........................................................................................................................1
MARKET ANALYSIS....................................................................................................................1
Competitors.................................................................................................................................1
Geography and technology.........................................................................................................1
Buyers preferences and market segmentation.............................................................................2
Sub strategic groups in mobile phone industry...........................................................................2
Market shares..............................................................................................................................4
Porter five forces model..............................................................................................................4
PESTEL analysis.........................................................................................................................6
Deep dive on varied economic factors greatly affecting busienss..............................................8
Industry life cycle........................................................................................................................9
Product life cycle......................................................................................................................11
Industry size..............................................................................................................................12
Global capacity usage...............................................................................................................13
Sources of competitive advantage.................................................................................................14
Sources......................................................................................................................................14
Value chain analysis..................................................................................................................15
Cost per unit..............................................................................................................................16
Critical analysis of investment in R&D.........................................................................................18
Definition and benefits of R&D................................................................................................18
Industry analysis.......................................................................................................................18
Stakeholder analysis and recommendations as well as stakeholder management.........................19
Stakeholders needed due attention by firm...............................................................................21
Stakeholder management..........................................................................................................21
CONCLUSION..............................................................................................................................22
REFERENCES..............................................................................................................................23
Figure 1Global demand of product..................................................................................................1
Figure 2R&D expenses across firms for years................................................................................2
Figure 3Market share of firms for different years...........................................................................3
Figure 4Porter five force model.......................................................................................................5
Figure 5Business environment........................................................................................................6
Figure 6BOE base rate.....................................................................................................................8
Figure 7Use of mobile phones by people of UK.............................................................................9
Figure 8Product life cycle..............................................................................................................10
Figure 9Industry size.....................................................................................................................11
Figure 10Percentage change in industry size across years............................................................12
Figure 11Capacity use across Asia and Europe.............................................................................13
Figure 12Variable production cost for the firms...........................................................................14
Figure 13Contract manufacturing cost..........................................................................................15
Figure 14Transportation cost for the firms....................................................................................15
Figure 15Average cost of the product.......................................................................................................16
Table 1R&D expenses across firms for years..................................................................................3
Table 2Market share of firms for different years.............................................................................4
Table 3Global capacity use............................................................................................................12
Table 4Cost per unit for the firms across years.............................................................................16
⊘ This is a preview!⊘
Do you want full access?
Subscribe today to unlock all pages.
Trusted by 1+ million students worldwide
INTRODUCTION
Red is taken as company for analysis in CEISM simulation. Mentioned company operate in
the telecommunication industry and manufacture mobile of all generations from 2G to 4G. In
comparison to rival’s firm is in better position because of its R&D projects and innovation that it
made in its operations. However, on front of cost firm lagged behind its rivals. Dependency on
contractors for production of additional units is one main reason behind high cost of product.
This is the front where Red need to work to improve its performance. Thus, on analysis of
performance it can be said that firm need to make hard efforts to control cost of production.
Management is good and able to retain suppliers which lead to less fluctuation in cost of
products obtained from contractors. However, within premises cost of production is high which
make firm less competitive to rivals. Investment in R&D is made almost equally, if economic
condition become stable and demand of smartphones plunged then in that case firm may failed to
make available technology updated mobiles to people relative to rivals. Such kind of scenario
will make firm less competitive in the market. Thus, it can be said that firm position in front of
rivals to moderately is competitive.
MARKET ANALYSIS
Competitors
In CEISM simulation there are some competitors namely Blue, Leaders, grey, Ochre, Pink,
Navy and Yellow. All these firms operate in the mobile industry and have core competency in
multiple fronts like innovation and cost control etc.
Geography and technology
In CEISM simulation there is one nation USA and two continents namely Asia and
Europe. Markets are very different from each other. In Europe and Asia people prefer to use
products that are different in front of price (Giachetti and Marchi, 2010). Specially, people prefer
cheaper products. Hence, firms need to serve both continent and USA people in different
manner. This create main challenge for the firms and make competition more tough for them.
1
Paraphrase This Document
Need a fresh take? Get an instant paraphrase of this document with our AI Paraphraser
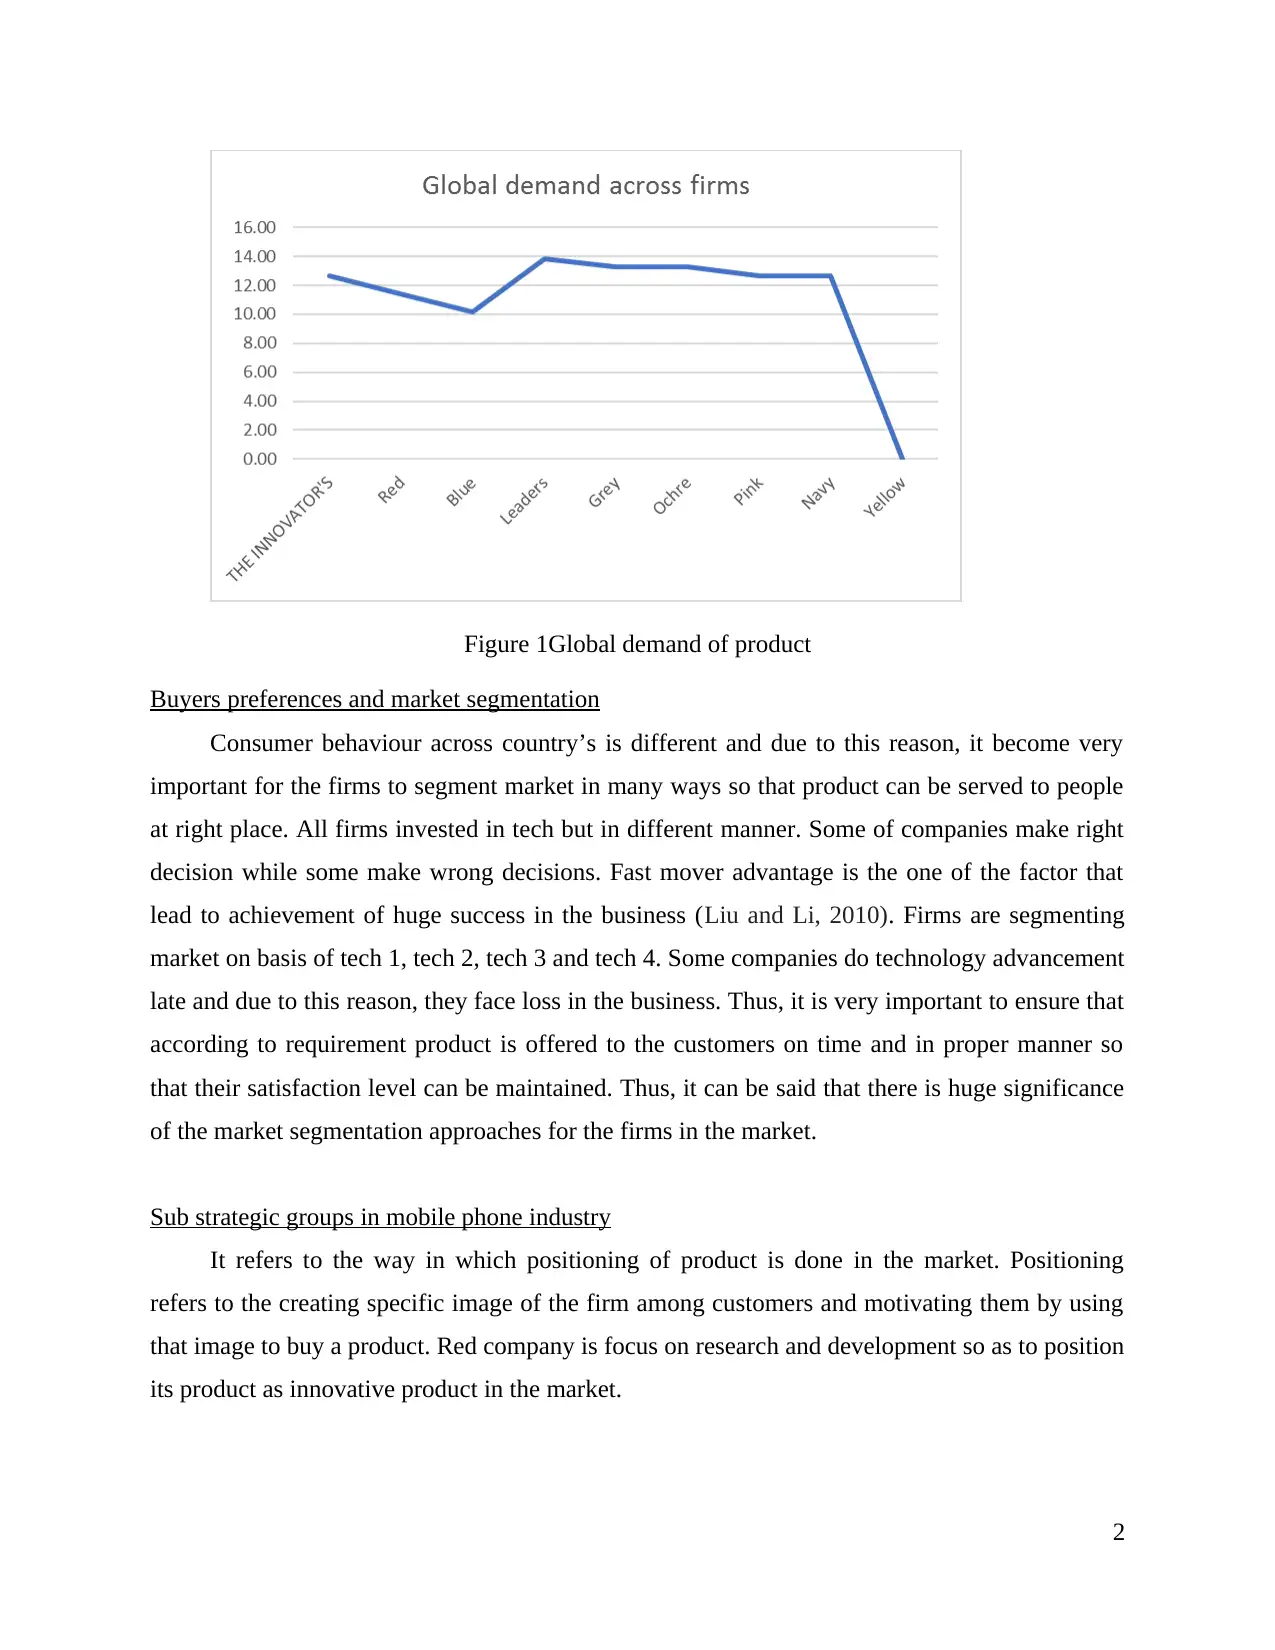
Figure 1Global demand of product
Buyers preferences and market segmentation
Consumer behaviour across country’s is different and due to this reason, it become very
important for the firms to segment market in many ways so that product can be served to people
at right place. All firms invested in tech but in different manner. Some of companies make right
decision while some make wrong decisions. Fast mover advantage is the one of the factor that
lead to achievement of huge success in the business (Liu and Li, 2010). Firms are segmenting
market on basis of tech 1, tech 2, tech 3 and tech 4. Some companies do technology advancement
late and due to this reason, they face loss in the business. Thus, it is very important to ensure that
according to requirement product is offered to the customers on time and in proper manner so
that their satisfaction level can be maintained. Thus, it can be said that there is huge significance
of the market segmentation approaches for the firms in the market.
Sub strategic groups in mobile phone industry
It refers to the way in which positioning of product is done in the market. Positioning
refers to the creating specific image of the firm among customers and motivating them by using
that image to buy a product. Red company is focus on research and development so as to position
its product as innovative product in the market.
2
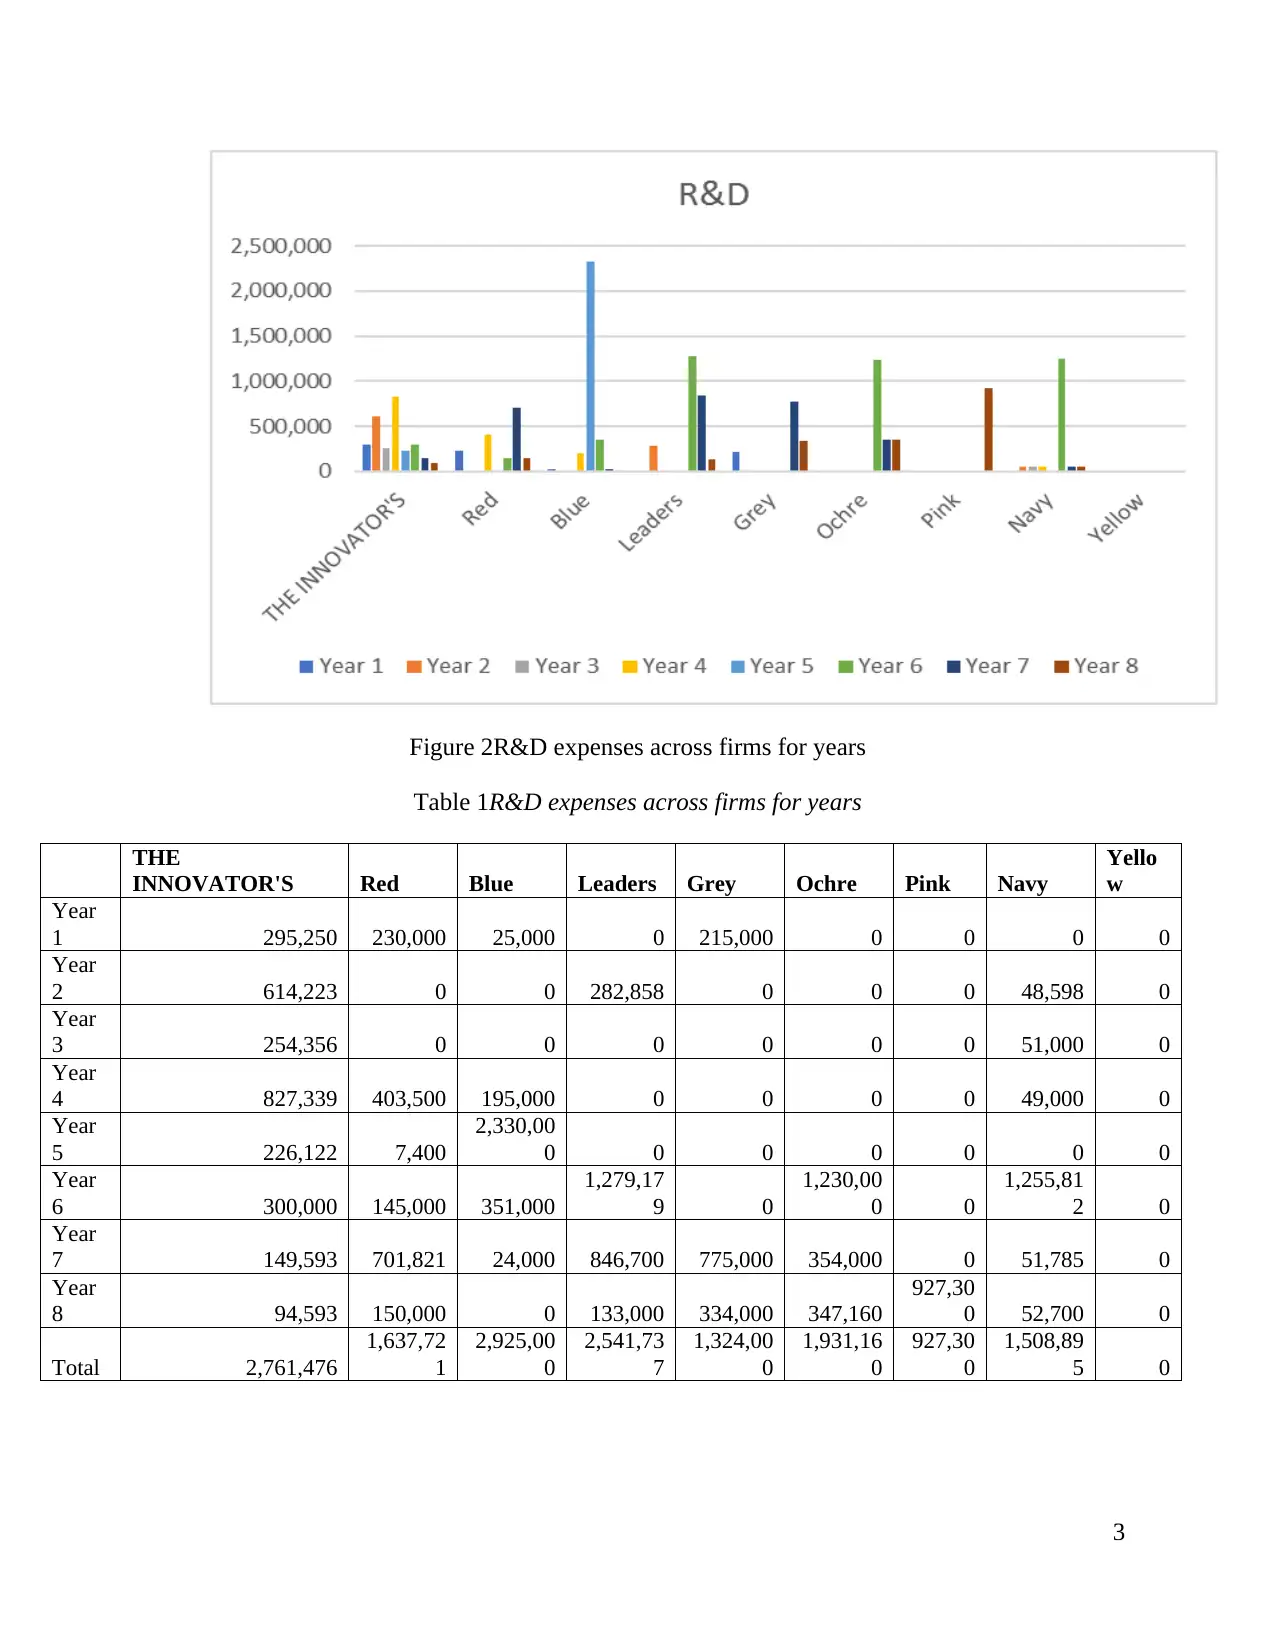
Figure 2R&D expenses across firms for years
Table 1R&D expenses across firms for years
THE
INNOVATOR'S Red Blue Leaders Grey Ochre Pink Navy
Yello
w
Year
1 295,250 230,000 25,000 0 215,000 0 0 0 0
Year
2 614,223 0 0 282,858 0 0 0 48,598 0
Year
3 254,356 0 0 0 0 0 0 51,000 0
Year
4 827,339 403,500 195,000 0 0 0 0 49,000 0
Year
5 226,122 7,400
2,330,00
0 0 0 0 0 0 0
Year
6 300,000 145,000 351,000
1,279,17
9 0
1,230,00
0 0
1,255,81
2 0
Year
7 149,593 701,821 24,000 846,700 775,000 354,000 0 51,785 0
Year
8 94,593 150,000 0 133,000 334,000 347,160
927,30
0 52,700 0
Total 2,761,476
1,637,72
1
2,925,00
0
2,541,73
7
1,324,00
0
1,931,16
0
927,30
0
1,508,89
5 0
3
⊘ This is a preview!⊘
Do you want full access?
Subscribe today to unlock all pages.
Trusted by 1+ million students worldwide
Not only Red, its rivals are also spending lots of amount on R&D. from table given above it can
be observed that most of firms are making heavy investment on R&D only in specific year.
However, Red is making balanced investment on R&D each year which make it competitive
towards its competitors.
Market shares
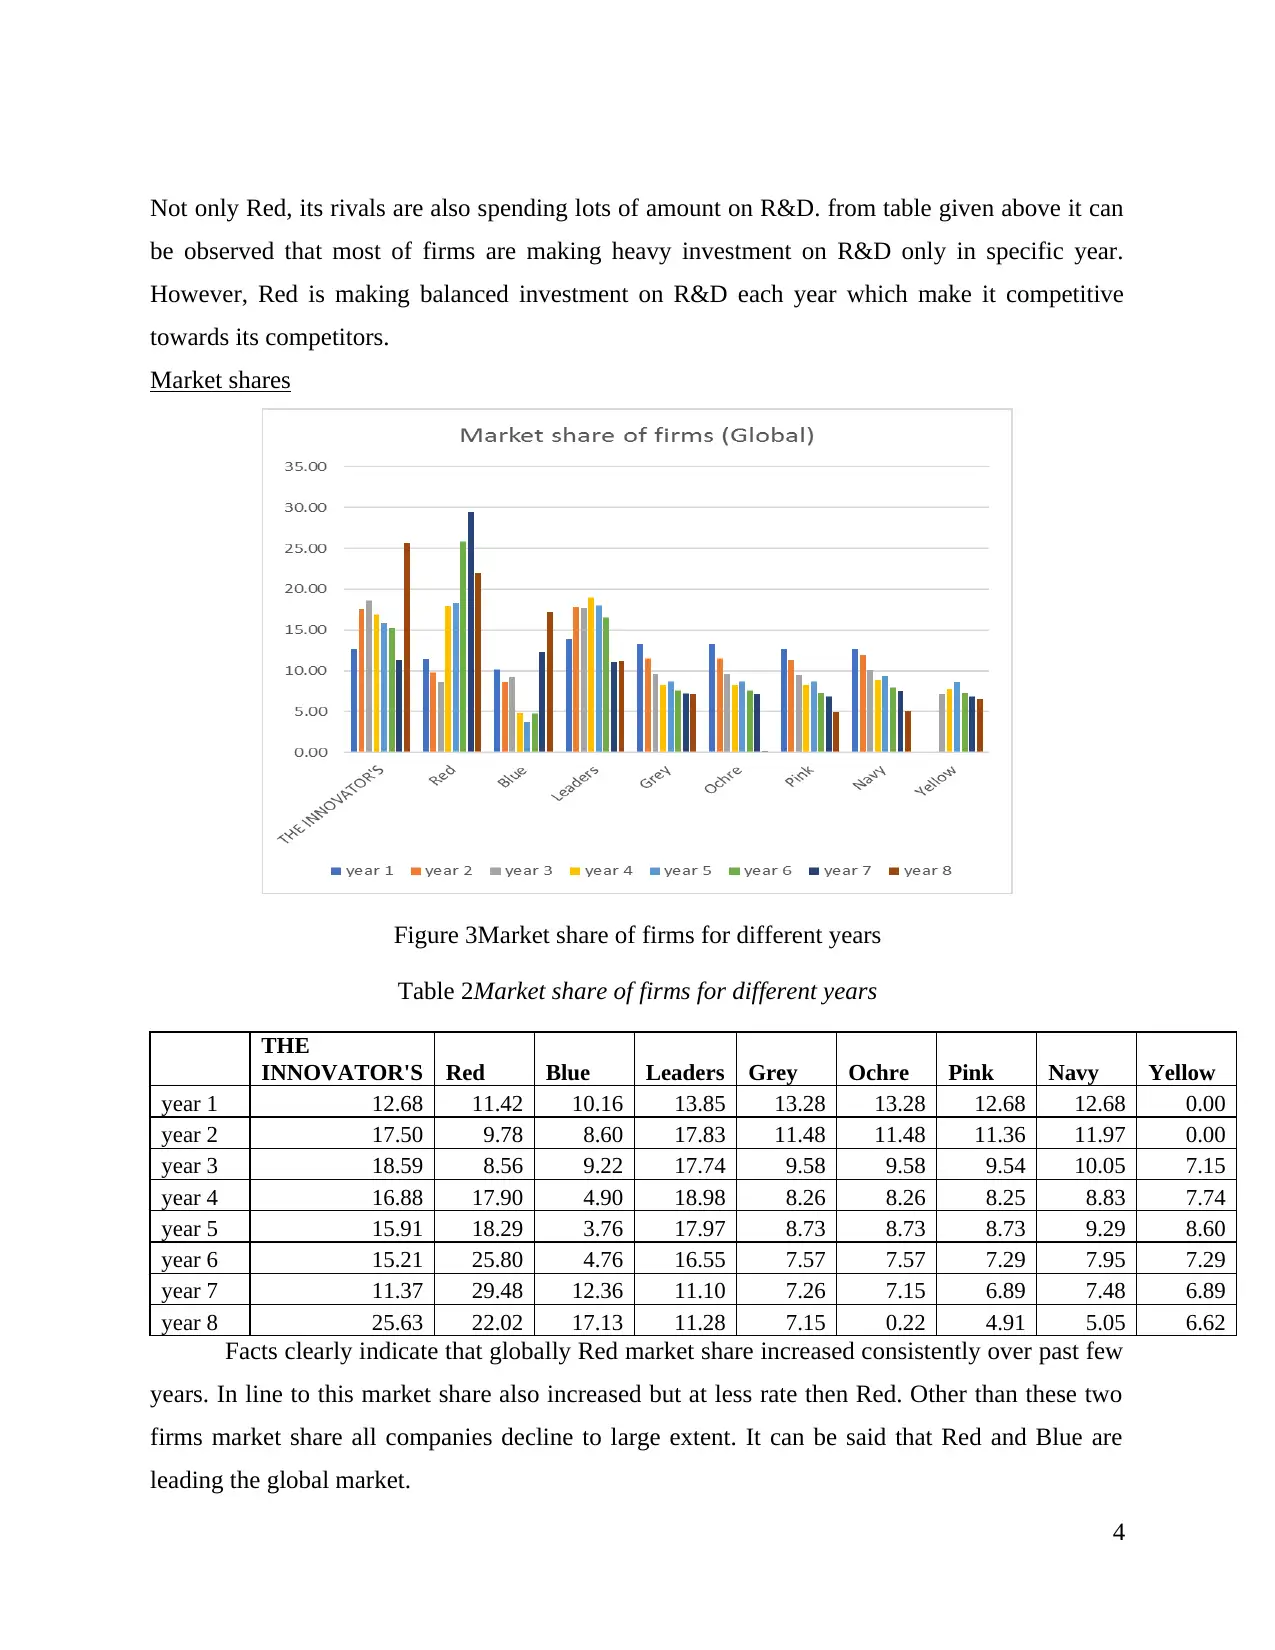
Figure 3Market share of firms for different years
Table 2Market share of firms for different years
THE
INNOVATOR'S Red Blue Leaders Grey Ochre Pink Navy Yellow
year 1 12.68 11.42 10.16 13.85 13.28 13.28 12.68 12.68 0.00
year 2 17.50 9.78 8.60 17.83 11.48 11.48 11.36 11.97 0.00
year 3 18.59 8.56 9.22 17.74 9.58 9.58 9.54 10.05 7.15
year 4 16.88 17.90 4.90 18.98 8.26 8.26 8.25 8.83 7.74
year 5 15.91 18.29 3.76 17.97 8.73 8.73 8.73 9.29 8.60
year 6 15.21 25.80 4.76 16.55 7.57 7.57 7.29 7.95 7.29
year 7 11.37 29.48 12.36 11.10 7.26 7.15 6.89 7.48 6.89
year 8 25.63 22.02 17.13 11.28 7.15 0.22 4.91 5.05 6.62
Facts clearly indicate that globally Red market share increased consistently over past few
years. In line to this market share also increased but at less rate then Red. Other than these two
firms market share all companies decline to large extent. It can be said that Red and Blue are
leading the global market.
4
be observed that most of firms are making heavy investment on R&D only in specific year.
However, Red is making balanced investment on R&D each year which make it competitive
towards its competitors.
Market shares
Figure 3Market share of firms for different years
Table 2Market share of firms for different years
THE
INNOVATOR'S Red Blue Leaders Grey Ochre Pink Navy Yellow
year 1 12.68 11.42 10.16 13.85 13.28 13.28 12.68 12.68 0.00
year 2 17.50 9.78 8.60 17.83 11.48 11.48 11.36 11.97 0.00
year 3 18.59 8.56 9.22 17.74 9.58 9.58 9.54 10.05 7.15
year 4 16.88 17.90 4.90 18.98 8.26 8.26 8.25 8.83 7.74
year 5 15.91 18.29 3.76 17.97 8.73 8.73 8.73 9.29 8.60
year 6 15.21 25.80 4.76 16.55 7.57 7.57 7.29 7.95 7.29
year 7 11.37 29.48 12.36 11.10 7.26 7.15 6.89 7.48 6.89
year 8 25.63 22.02 17.13 11.28 7.15 0.22 4.91 5.05 6.62
Facts clearly indicate that globally Red market share increased consistently over past few
years. In line to this market share also increased but at less rate then Red. Other than these two
firms market share all companies decline to large extent. It can be said that Red and Blue are
leading the global market.
4
Paraphrase This Document
Need a fresh take? Get an instant paraphrase of this document with our AI Paraphraser
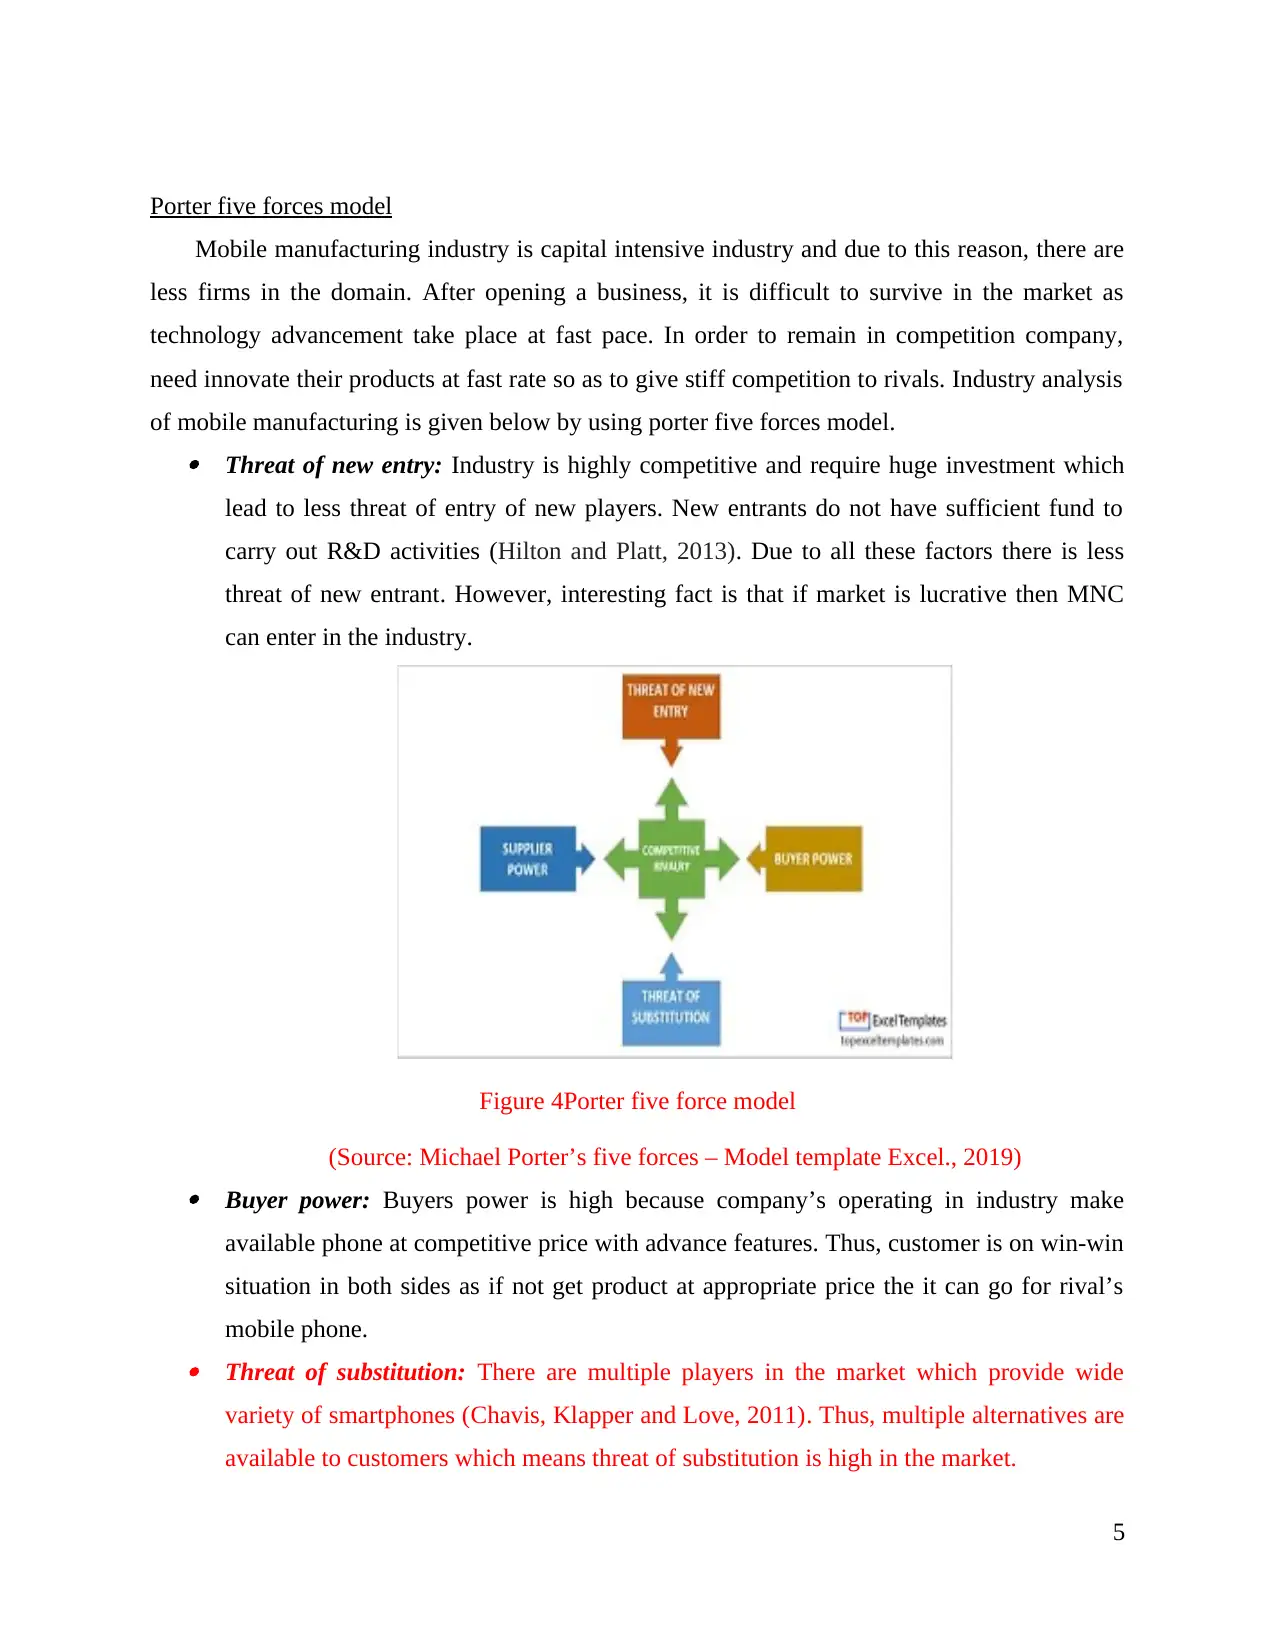
Porter five forces model
Mobile manufacturing industry is capital intensive industry and due to this reason, there are
less firms in the domain. After opening a business, it is difficult to survive in the market as
technology advancement take place at fast pace. In order to remain in competition company,
need innovate their products at fast rate so as to give stiff competition to rivals. Industry analysis
of mobile manufacturing is given below by using porter five forces model. Threat of new entry: Industry is highly competitive and require huge investment which
lead to less threat of entry of new players. New entrants do not have sufficient fund to
carry out R&D activities (Hilton and Platt, 2013). Due to all these factors there is less
threat of new entrant. However, interesting fact is that if market is lucrative then MNC
can enter in the industry.
Figure 4Porter five force model
(Source: Michael Porter’s five forces – Model template Excel., 2019) Buyer power: Buyers power is high because company’s operating in industry make
available phone at competitive price with advance features. Thus, customer is on win-win
situation in both sides as if not get product at appropriate price the it can go for rival’s
mobile phone. Threat of substitution: There are multiple players in the market which provide wide
variety of smartphones (Chavis, Klapper and Love, 2011). Thus, multiple alternatives are
available to customers which means threat of substitution is high in the market.
5
Supplier power: There is medium power of suppliers because mobile phone producers
trust only on those suppliers which make available quality of components to them at
competitive prices. Complementary forces: Bargaining power of complementary forces is moderate because
firm specifically rely only on few one to get prepared chargers and batteries as well as ear
phones.
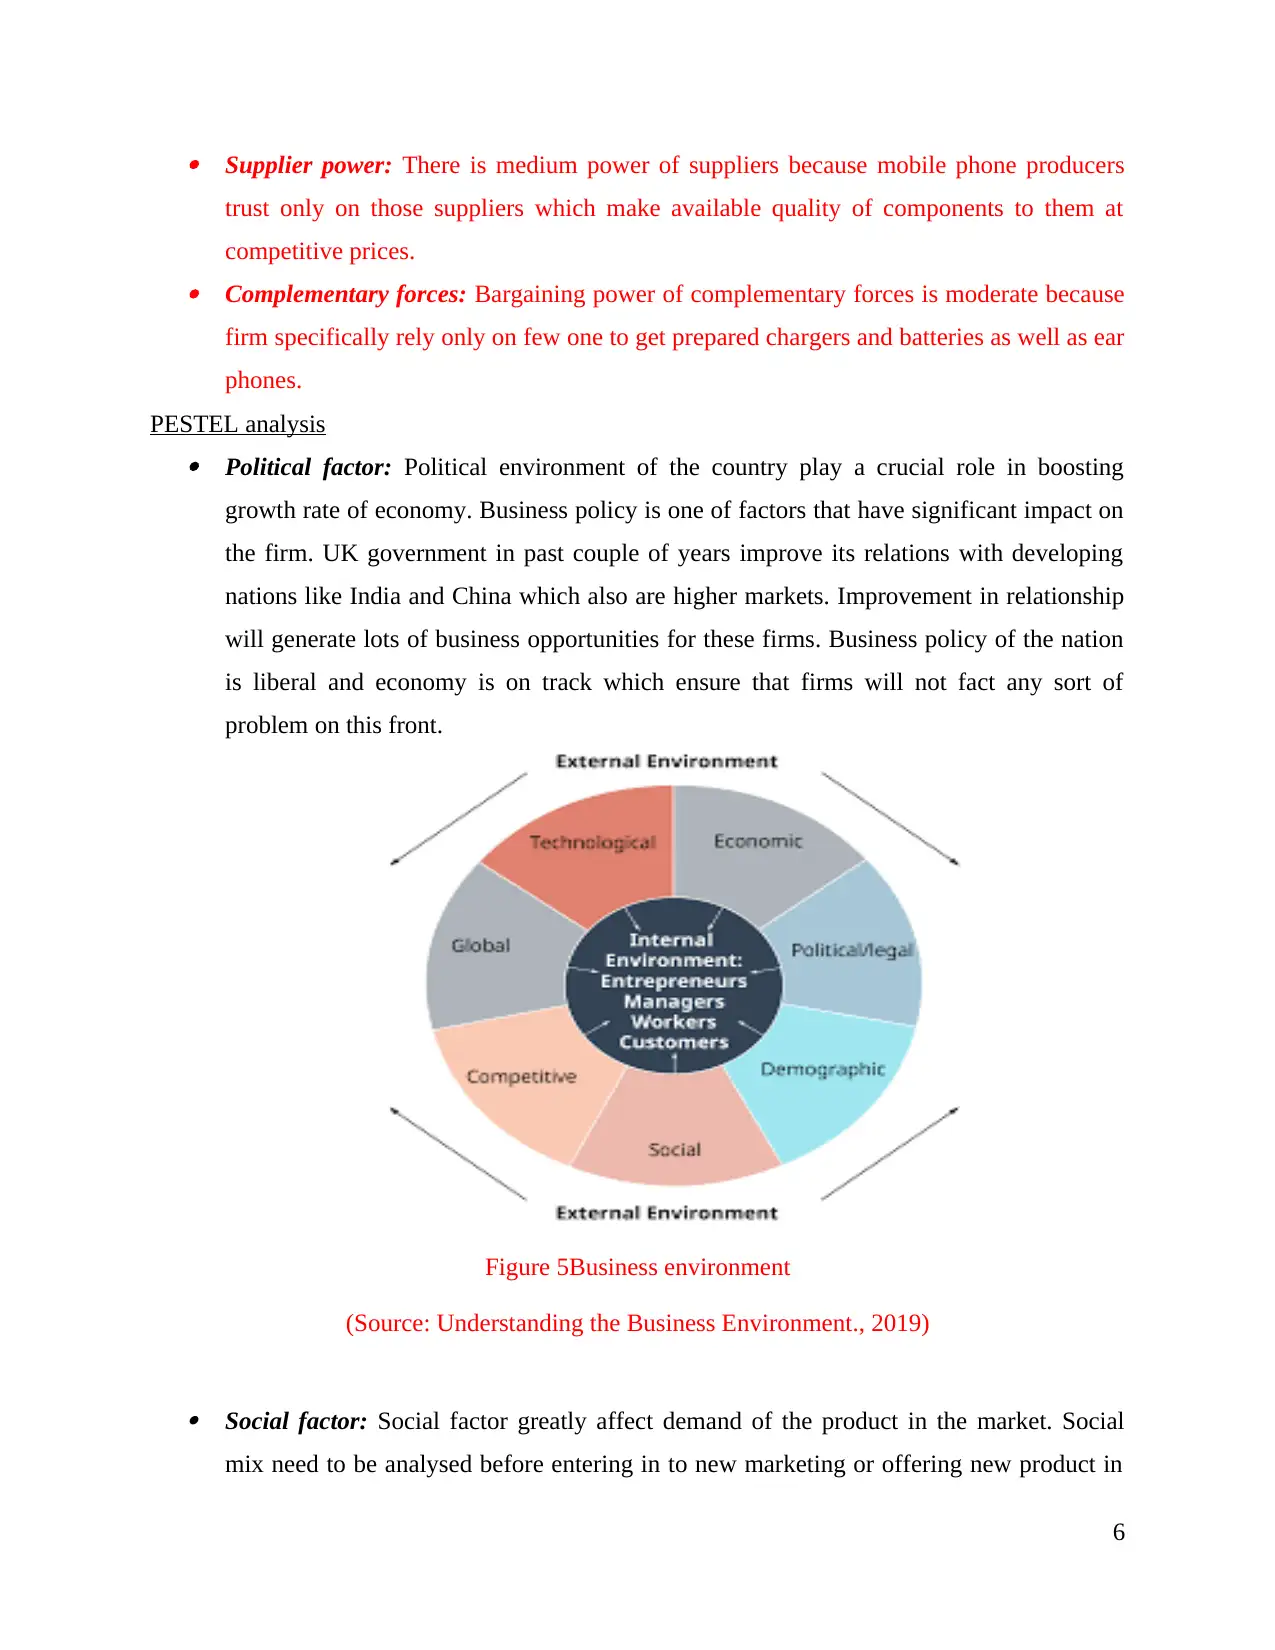
PESTEL analysis Political factor: Political environment of the country play a crucial role in boosting
growth rate of economy. Business policy is one of factors that have significant impact on
the firm. UK government in past couple of years improve its relations with developing
nations like India and China which also are higher markets. Improvement in relationship
will generate lots of business opportunities for these firms. Business policy of the nation
is liberal and economy is on track which ensure that firms will not fact any sort of
problem on this front.
Figure 5Business environment
(Source: Understanding the Business Environment., 2019)
Social factor: Social factor greatly affect demand of the product in the market. Social
mix need to be analysed before entering in to new marketing or offering new product in
6
trust only on those suppliers which make available quality of components to them at
competitive prices. Complementary forces: Bargaining power of complementary forces is moderate because
firm specifically rely only on few one to get prepared chargers and batteries as well as ear
phones.
PESTEL analysis Political factor: Political environment of the country play a crucial role in boosting
growth rate of economy. Business policy is one of factors that have significant impact on
the firm. UK government in past couple of years improve its relations with developing
nations like India and China which also are higher markets. Improvement in relationship
will generate lots of business opportunities for these firms. Business policy of the nation
is liberal and economy is on track which ensure that firms will not fact any sort of
problem on this front.
Figure 5Business environment
(Source: Understanding the Business Environment., 2019)
Social factor: Social factor greatly affect demand of the product in the market. Social
mix need to be analysed before entering in to new marketing or offering new product in
6
⊘ This is a preview!⊘
Do you want full access?
Subscribe today to unlock all pages.
Trusted by 1+ million students worldwide
the existing market (Teece, 2010). If in any nation there are large majority of educated
people demand of high priced items related to leisure and tourism increased at rapid pace.
People in larger markets prefer low priced high-quality mobiles. Mobile manufacturers
need to understand such kind of behaviour of people. Thus, firms need to evaluate social
structure or mix and accordingly must offer product to the people. In UK most of people
belong to middle class and are highly educated. Hence, demand of product will certainly
have increased with passage of time period.
Economic factor: This factor has huge impact on the firms that manufacture mobiles.
This is because if economy is not in better condition then in that case inflation remain
high which lead to fast increase in price of raw items. Mobile manufacturers can not pass
pressure of elevation of cost to the customers and due to this reason with slight increase
in cost profitability decline. In current time period economic condition of UK is good and
due to this reason, it is expected that cost will remain in control and will lead to instant
solution of the problem,
Technological factor: It is another factor where by attention is paid on the technology
used by the firm in its business operation. Every year huge investment is made on mobile
technology which lead to cut throat competition among business firms (Hillary, 2017).
Hence, it can be said that it is another where huge risk is present. Hence, firms need to be
very careful on this front.
Legal factor: Time to time government make amendments in their rules and regulations
and firms need to be aware about same. In case of violation of rules and regulations
penalty is charged by the court on the firm which heavily affect financial condition of the
firm and image in the market. Hence, mangers need to ensure that all rules and
regulations are followed in proper manner at the workplace.
Environmental factor: It is another factor on which firms pay due attention specially
those engaged in manufacturing of products. This is because waste generated in the
business if properly not treated then in that case it harms natural environment. In such
7
Paraphrase This Document
Need a fresh take? Get an instant paraphrase of this document with our AI Paraphraser
kind of situation government take strict action against the firm which sometimes lead to
closing of business operations. Thus, on this front also attention need to be paid by the
managers.
Deep dive on varied economic factors greatly affecting busienss
There are number of factors in economic environment which are greatly affecting
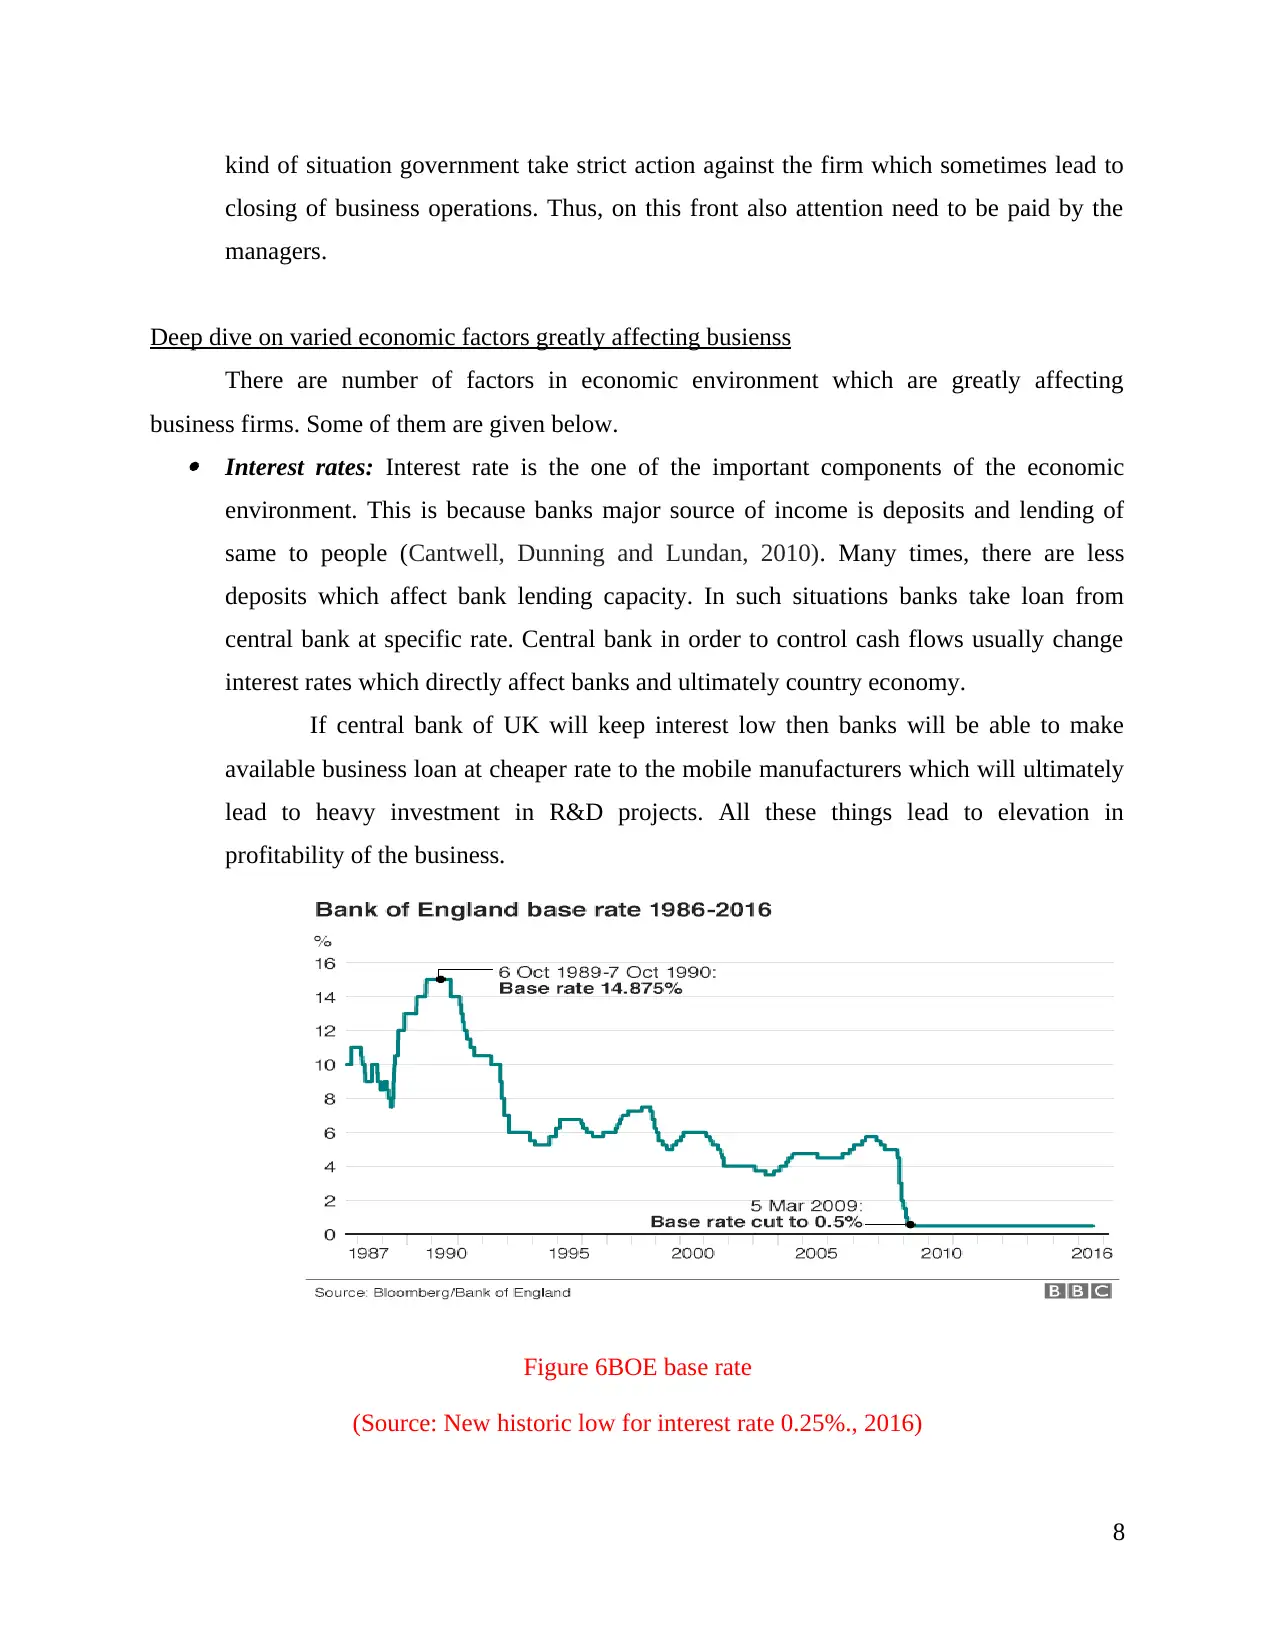
business firms. Some of them are given below. Interest rates: Interest rate is the one of the important components of the economic
environment. This is because banks major source of income is deposits and lending of
same to people (Cantwell, Dunning and Lundan, 2010). Many times, there are less
deposits which affect bank lending capacity. In such situations banks take loan from
central bank at specific rate. Central bank in order to control cash flows usually change
interest rates which directly affect banks and ultimately country economy.
If central bank of UK will keep interest low then banks will be able to make
available business loan at cheaper rate to the mobile manufacturers which will ultimately
lead to heavy investment in R&D projects. All these things lead to elevation in
profitability of the business.
Figure 6BOE base rate
(Source: New historic low for interest rate 0.25%., 2016)
8
closing of business operations. Thus, on this front also attention need to be paid by the
managers.
Deep dive on varied economic factors greatly affecting busienss
There are number of factors in economic environment which are greatly affecting
business firms. Some of them are given below. Interest rates: Interest rate is the one of the important components of the economic
environment. This is because banks major source of income is deposits and lending of
same to people (Cantwell, Dunning and Lundan, 2010). Many times, there are less
deposits which affect bank lending capacity. In such situations banks take loan from
central bank at specific rate. Central bank in order to control cash flows usually change
interest rates which directly affect banks and ultimately country economy.
If central bank of UK will keep interest low then banks will be able to make
available business loan at cheaper rate to the mobile manufacturers which will ultimately
lead to heavy investment in R&D projects. All these things lead to elevation in
profitability of the business.
Figure 6BOE base rate
(Source: New historic low for interest rate 0.25%., 2016)
8
Inflation rate: It is another important term that buzz specially after 2008 recession across
the market. More inflation rate is high product price increased and lead to less demand of
the product in the market. In current time period in the domestic market there is low
inflation rate and in developing nations or larger markets also (Ullah and Lai, 2011). This
situation is positive for mobile manufacturers and they can expect strong boost in sales
revenue. GDP: GDP is also known as economic growth rate of the nation. Economic growth rate
indicate increase in production of goods and services and trade in the nation. All these
things ultimately lead to increase in job opportunities and income level of individual. All
these things boost demand in the economy and ultimately lead to increase in profitability
of the business firms. In current time period GDP of the UK is increasing which reflects
that in future time period demand for mobile hand sets will increase consistently. Thus,
there are good earning prospects for mobile manufacturers in the UK. Current account deficit: It is another important term that is used in economic analysis by
experts. Current account deficit refers to the situation where government made more
expenses then it receives as income (Cohen and Kietzmann, 2014). In such kind of
situation infrastructure building reduce which affect nation growth rate. It can be said that
current account deficit must be kept in control in the nation. Trade deficit: Term refers to the situation where import of the nation is higher than
export. Thus, domestic currency gets devaluated and import become dearer. Hence, if
such kind of situation comes in existence then UK mobile manufacturers have to pay
higher amount to purchase raw material from foreign nation. All these things lead to
increase in cost of production. Thus, exchange rates have huge impact on the business.
Industry life cycle
Industry life cycle is the concept which reflect the current state of the industry. It can be
observed that industry have three life cycle stage namely growth, maturity and decline.
9
⊘ This is a preview!⊘
Do you want full access?
Subscribe today to unlock all pages.
Trusted by 1+ million students worldwide
1 out of 28
Related Documents


Your All-in-One AI-Powered Toolkit for Academic Success.
+13062052269
info@desklib.com
Available 24*7 on WhatsApp / Email
![[object Object]](/_next/static/media/star-bottom.7253800d.svg)
Unlock your academic potential
Copyright © 2020–2026 A2Z Services. All Rights Reserved. Developed and managed by ZUCOL.