Detailed Financial Analysis: Redrow Plc vs Bellway Plc - UK Market
VerifiedAdded on 2023/06/03
|23
|4774
|57
Report
AI Summary
This report presents a comprehensive financial analysis comparing Redrow Plc and Bellway Plc, two prominent UK housebuilders. Utilizing a CORE approach (Context, Overview, Ratios, Evaluation), the analysis examines their financial performance based on their annual reports, focusing on liquidity, profitability, solvency, and efficiency ratios. The report includes SWOT analyses for both companies, identifies key issues affecting their performance, and concludes with a recommendation, based on the financial data, for Persimmon Plc regarding potential acquisition targets. The analysis suggests Bellway Plc outperformed Redrow Plc during the analyzed period, primarily due to higher sales, operating profit, and net profit margins, although areas for improvement, such as debt management and efficient utilization of liquid resources, are also highlighted.

RUNNING HEAD: MANAGEMENT ACCOUNTING
Management accounting
Management accounting
Paraphrase This Document
Need a fresh take? Get an instant paraphrase of this document with our AI Paraphraser

Management accounting 2
Case A: Redrow v Bellway
Executive summary
The report deals with the overall analysis of the financial performance of two UK based
companies operating in the House building sector. The report undertakes the evaluation of annual
report of Redrow Plc for the year 2018 and Bellway Plc for the year 2017. It has adopted a
CORE approach which covers the whole analysis of both the companies.
It commences with a brief introduction and then later on explains the context of the case. The
section includes the description of both the firms including their SWOT analysis respectively.
After that an overview of the case has been provided which covers the issues observed during the
analysis. A ratio analysis has been conducted on the basis of annual reports collected for both the
firms and it has been evaluated that Bellway Plc has performed pretty much well than Redrow
Plc during the year 2017. Therefore, it is recommended to Persimmon Plc that it should acquire
Bellway over Redrow.

Management accounting 3
Contents
Section A.....................................................................................................................................................4
Introduction.................................................................................................................................................4
Context........................................................................................................................................................4
Redrow Plc..............................................................................................................................................4
Bellway Plc.............................................................................................................................................6
Overview.....................................................................................................................................................8
Ratio analysis..............................................................................................................................................9
Liquidity ratios........................................................................................................................................9
Profitability ratios..................................................................................................................................10
Solvency ratios......................................................................................................................................12
Efficiency ratios....................................................................................................................................13
Market value ratios................................................................................................................................15
Evaluation and conclusion.........................................................................................................................16
Section B...................................................................................................................................................17
Case B1.....................................................................................................................................................17
Introduction...........................................................................................................................................17
Capital budgeting techniques.................................................................................................................17
Payback period..................................................................................................................................18
Net present value...............................................................................................................................18
Internal rate of return.........................................................................................................................19
Recommendation and Conclusion.........................................................................................................20
References.................................................................................................................................................21
⊘ This is a preview!⊘
Do you want full access?
Subscribe today to unlock all pages.
Trusted by 1+ million students worldwide
Management accounting 4
Section A
Introduction
Financial performance analysis is a procedure of evaluating and analyzing the performance and
position of the company from every financial aspect. It identifies the strengths and weaknesses of
the firm by measuring the each and every item of balance sheet and profit and loss account.
Financial analysis can be performed by using many techniques such as ratio analysis, horizontal
and vertical analysis, trend analysis and others. The main objective of conducting the analysis is
to evaluate the financial situation of the firm in terms of solvency, profitability, liquidity and
others. The data is collected from the published annual reports of the company on its official
website and is properly evaluated for making suitable decisions (Gibson, 2011).
The report deals with the financial analysis of Redrow Plc and Bellway Plc for the year 2017 and
2018. It has adopted a CORE approach which provides context, overview, ratios and evaluation
of both the companies’ performance during the years. The report highlights the issues arose
which affected the position and performance of the firms as a whole. CORE approach provides
the overall outline of the analysis and is best suited for enhancing the understanding of the
reader.
Context
Redrow Plc
It is the United Kingdom based company engaged in the residential housing development. The
firm is one of the largest British house builders having 15 operational divisions across the
Paraphrase This Document
Need a fresh take? Get an instant paraphrase of this document with our AI Paraphraser

Management accounting 5
country. The core activities of the company involve construction of residential houses throughout
England and Wales. The product range is focused on the concept of traditional family housing in
its regional business. The properties owned by Redrow involve Heritage Collection, Regent
Collection, Abode Collection and Bespoke Collection. The company is listed on London Stock
Exchange and is traded with a ticker RDW: LSE. The SWOT analysis of Redrow Plc is as
follows (FT.com. 2018).
Strengths
Redrow Plc has a wide network of distribution across the country which makes sure that
its products are easily accessible and available to its customers in timely manner.
The company has built a strong dealer community by establishing a relationship between
the dealer and distributer. The dealers not only promote the products but also invest in the
training program of sales team.
Redrow has strong free cash flow position which enables it to expand its business in new
markets.
Weaknesses
The company failed at facing the challenges given by new entrants in the sector and
should focus on improving the feedback mechanism internally from the sales team to
counter the challenges.
Despite making huge investment in Research and Development, Redrow is not able to
compete with the leading players in the industry from the aspect of innovation.

Management accounting 6
The company is not good at predicting the demand for its products as compare to its
competitors.
Opportunities
Increase in consumer spending and slow growth rate provides an opportunity to Redrow
to increase its customer base and market share.
The development of market will reduce the competitor’s advantage and enable the
company to improve its competitiveness.
Threats
One of the threats to the company is increased competition in the market which can
impact the growth of its profits.
New entrants in the market are gaining market shares and are a threat to Redrow as it can
lose its customers to the new players.
Bellway Plc
It is a residential property developer in Uk which is based on Newcastle upon Tyne. The
company deals in constructing and selling the homes having a range from one bed room
apartments to five bedrooms family homes. In addition, it also provides social housing-to-
housing associations. It operates through 19 trading divisions including England, Manchester,
Kent, North London and many others. Other business offerings of the firm include electrical,
kitchens, gardens, bathrooms, flooring, fire surround and fire, ceramic tiling and others. The
company is listed on London stock exchange with a symbol BWY: LSE and was founded in
1946 (FT.com. 2018).
⊘ This is a preview!⊘
Do you want full access?
Subscribe today to unlock all pages.
Trusted by 1+ million students worldwide

Management accounting 7
Strengths
The company has a strong distribution network and strong dealer community. It has a
wide network which allows the firm to reach to the potential market easily.
It is has a strong base of reliable suppliers which enables the company to overcome the
supply chain bottlenecks.
Bellway has a strong portfolio and is focused on building the same so as to expand its
business.
Weaknesses
It has faced problems in moving to other product segments and has a limited success
outside its core business.
The high current and quick ratio suggested that the firm could have used its cash and
liquid resources more efficiently and effectively.
Not highly compatible while merging with big companies and with those who have
different work culture.
Opportunities
New trends in consumer spending and behavior can result in opening up new market for
Bellway Plc.
Encouragement provided by the government to build more quickly is expected to support
growth.
Strong investment in housing market by the government can create an opportunity for
Bellway to enjoy success and growth in future (IBIS World. 2018).
Paraphrase This Document
Need a fresh take? Get an instant paraphrase of this document with our AI Paraphraser

Management accounting 8
Threats
Uncertainty in housing prices and input price inflation can impact the profits of the
company
Cut throat competition prevailing in the housing industry can be a threat to the survival of
Bellway Plc.
Entry of new players and use of advanced technologies by the competitor is also a serious
threat to the company.
Overview
The sales of Bellway were higher than of Redrow during the year 2017. Also, the operating
profit of the company was higher along with the operating cash flow. The net profit of Bellway
was £454 million which was higher than Redrow’s profit worth £253 million. However, the firm
should focus on reducing its debt component so as to lower the level of its financial risk. In
addition to that, it needs to focus on its liquidity position as a lot of cash in hand can lead to some
serious issues in the business. Bellway needs to strategize properly for making the best
utilization of its liquid resources in context of company’s growth and success.
Overview Redrow Bellway
2017 2017
Turnover 1,235.0 2,191.30
Operating profit 322 571.55
Operating cash flow from
activities 128 153.1

Management accounting 9
Profit for the year 253 454
Total debt 966.0 956
Ratio analysis
It is a technique used to measure the financial data of the company with the help of its annual
reports. It evaluates the items of financial statements from each and every aspect and provides
insights about the performance and position of the firm to management and shareholders (Bragg,
2012). The analysis takes into account the quantitative data presented in the annual reports for
the years. Financial ratio analysis of Redrow Plc and Bellway Plc has been done by using the
annual report of 2017 and 2018.
Liquidity ratios
These metrics help in understanding the financial strength of the company by measuring its
competency in paying off its current financial obligations with its current assets (Bragg, 2012).
Current ratio: The below table shows that the CR of both the company has increased
over the years. For Redrow, the ratio was 3.21 in 2017 which increased to 3.23 in 2018.
Similarly, in case of Bellway, the ratio was 3.59 in 2016 that turned out to be 3.76 in
2017. Both the companies have high ratios but comparatively, Redrow Plc has lower ratio
than Bellway. It can be interpreted that the liabilities of Redrow are less and also it has
high amount of CA which makes it ratio better. However, both the companies has ratio
more than the standard one which reflected that they do not utilize its resources
efficiently.
⊘ This is a preview!⊘
Do you want full access?
Subscribe today to unlock all pages.
Trusted by 1+ million students worldwide

Management accounting 10
Redrow Bellway
Current ratio 2017 (£m) 2018 (£m) 2017 (£m) 2016(£m)
Current assets (A) 2140.0 2350.0 3,147.30 2,720.84
Current liabilities
(B) 666.0 727.0 837.60 757.61
CR (A/B) 3.21 3.23 3.76 3.59
Quick ratio: When evaluated, it has been observed that the QR of Redrow and Bellway
was less than the ideal benchmark of 1:1. Redrow has low ratio of 0.15 in 2017 while on
the other side Bellway reported a ratio of 0.21 during the same year. This was due to the
fact that Bellway has comparatively more liquid assets used for repaying the liabilities.
Redrow Bellway
Quick ratio 2017 (£m) 2018 (£m) 2017 (£m) 2016(£m)
Quick Assets (A) 97.0 132.0
179.2
0 172.54
Current Liabilities
(B) 666.0 727.0
837.6
0 757.61
QR (A/B) 0.15 0.18
0.2
1 0.23
Redrow Bellway
Current ratio 2017 (£m) 2018 (£m) 2017 (£m) 2016(£m)
Current assets (A) 2140.0 2350.0 3,147.30 2,720.84
Current liabilities
(B) 666.0 727.0 837.60 757.61
CR (A/B) 3.21 3.23 3.76 3.59
Quick ratio: When evaluated, it has been observed that the QR of Redrow and Bellway
was less than the ideal benchmark of 1:1. Redrow has low ratio of 0.15 in 2017 while on
the other side Bellway reported a ratio of 0.21 during the same year. This was due to the
fact that Bellway has comparatively more liquid assets used for repaying the liabilities.
Redrow Bellway
Quick ratio 2017 (£m) 2018 (£m) 2017 (£m) 2016(£m)
Quick Assets (A) 97.0 132.0
179.2
0 172.54
Current Liabilities
(B) 666.0 727.0
837.6
0 757.61
QR (A/B) 0.15 0.18
0.2
1 0.23
Paraphrase This Document
Need a fresh take? Get an instant paraphrase of this document with our AI Paraphraser

Management accounting 11
Profitability ratios
These financial metrics are used for measuring the overall profitability of the company. The
ratios are very much useful for the investors as to make suitable decisions regarding their
investment in a particular firm (Gibson, 2011).
Net profit ratio: it can be seen that Bellway has high NPR as compare to Redrow. During
2017, the company reported a net margin of 17.74% while its competitor Redrow
reflected NPR of 15.24%. Reason being, the firm has made high net profits due to the
strong demand of new housing across the country.
Redrow Bellway
Net profit
margin 2017 (£m)
2018
(£m) 2017 (£m) 2016(£m)
Net profit (A) 253.0 308.0 454.00 385.50
Total revenue (B) 1,660.0 1,920.0 2,558.50 2,240.65
NPR (A/B) 15.24% 16.04% 17.74% 17.20%
Gross profit ratio: The similar trend has been noticed in the gross margin of both the
companies. Bellway has high ratio of 25.85% in 2017 as compare to the ratio of Redrow
which was 24.40% during the same year. This was due to the high sales reported by
Bellway during the year.
Redrow Bellway
Gross profit margin (sales 2017 (£m) 2018 2017 (£m) 2016(£m)
Management accounting 12
margin) (£m)
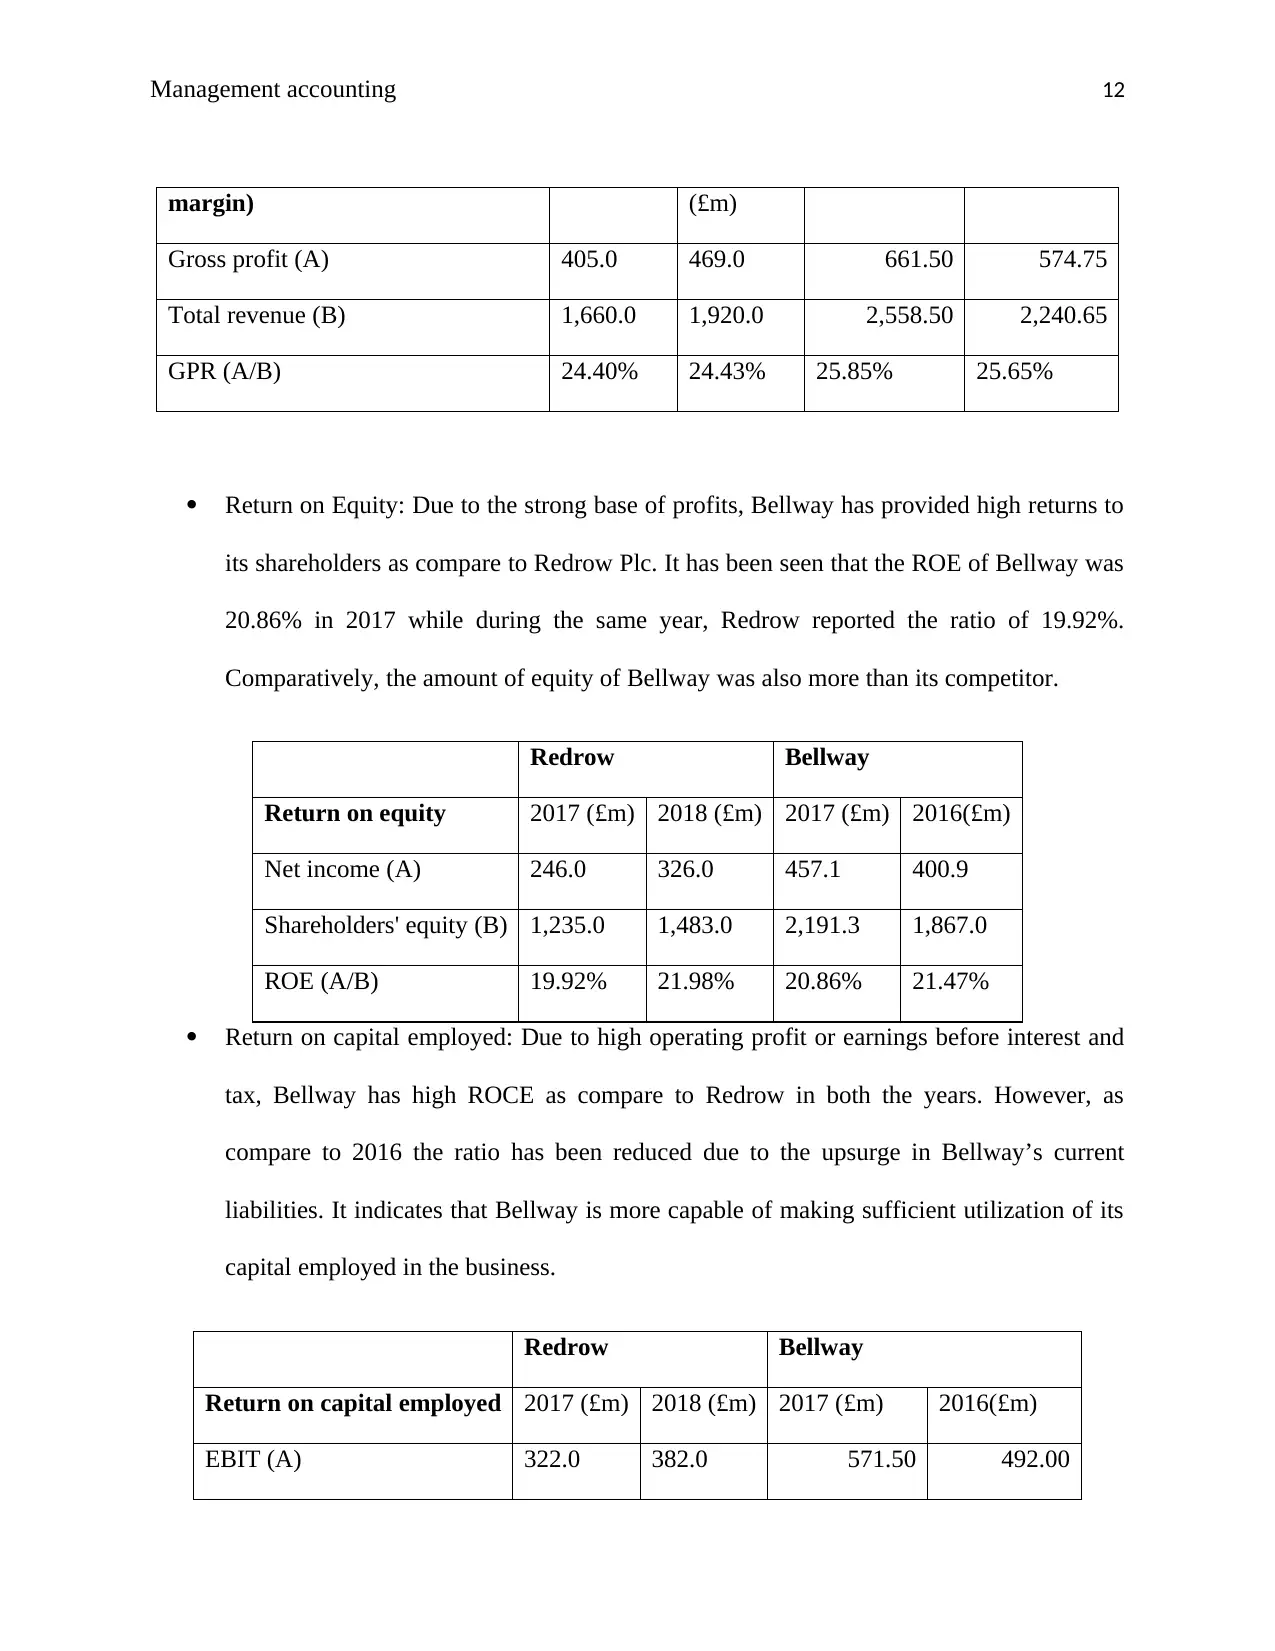
Gross profit (A) 405.0 469.0 661.50 574.75
Total revenue (B) 1,660.0 1,920.0 2,558.50 2,240.65
GPR (A/B) 24.40% 24.43% 25.85% 25.65%
Return on Equity: Due to the strong base of profits, Bellway has provided high returns to
its shareholders as compare to Redrow Plc. It has been seen that the ROE of Bellway was
20.86% in 2017 while during the same year, Redrow reported the ratio of 19.92%.
Comparatively, the amount of equity of Bellway was also more than its competitor.
Redrow Bellway
Return on equity 2017 (£m) 2018 (£m) 2017 (£m) 2016(£m)
Net income (A) 246.0 326.0 457.1 400.9
Shareholders' equity (B) 1,235.0 1,483.0 2,191.3 1,867.0
ROE (A/B) 19.92% 21.98% 20.86% 21.47%
Return on capital employed: Due to high operating profit or earnings before interest and
tax, Bellway has high ROCE as compare to Redrow in both the years. However, as
compare to 2016 the ratio has been reduced due to the upsurge in Bellway’s current
liabilities. It indicates that Bellway is more capable of making sufficient utilization of its
capital employed in the business.
Redrow Bellway
Return on capital employed 2017 (£m) 2018 (£m) 2017 (£m) 2016(£m)
EBIT (A) 322.0 382.0 571.50 492.00
margin) (£m)
Gross profit (A) 405.0 469.0 661.50 574.75
Total revenue (B) 1,660.0 1,920.0 2,558.50 2,240.65
GPR (A/B) 24.40% 24.43% 25.85% 25.65%
Return on Equity: Due to the strong base of profits, Bellway has provided high returns to
its shareholders as compare to Redrow Plc. It has been seen that the ROE of Bellway was
20.86% in 2017 while during the same year, Redrow reported the ratio of 19.92%.
Comparatively, the amount of equity of Bellway was also more than its competitor.
Redrow Bellway
Return on equity 2017 (£m) 2018 (£m) 2017 (£m) 2016(£m)
Net income (A) 246.0 326.0 457.1 400.9
Shareholders' equity (B) 1,235.0 1,483.0 2,191.3 1,867.0
ROE (A/B) 19.92% 21.98% 20.86% 21.47%
Return on capital employed: Due to high operating profit or earnings before interest and
tax, Bellway has high ROCE as compare to Redrow in both the years. However, as
compare to 2016 the ratio has been reduced due to the upsurge in Bellway’s current
liabilities. It indicates that Bellway is more capable of making sufficient utilization of its
capital employed in the business.
Redrow Bellway
Return on capital employed 2017 (£m) 2018 (£m) 2017 (£m) 2016(£m)
EBIT (A) 322.0 382.0 571.50 492.00
⊘ This is a preview!⊘
Do you want full access?
Subscribe today to unlock all pages.
Trusted by 1+ million students worldwide
1 out of 23
Related Documents


Your All-in-One AI-Powered Toolkit for Academic Success.
+13062052269
info@desklib.com
Available 24*7 on WhatsApp / Email
![[object Object]](/_next/static/media/star-bottom.7253800d.svg)
Unlock your academic potential
Copyright © 2020–2026 A2Z Services. All Rights Reserved. Developed and managed by ZUCOL.