GEO2221: Comprehensive Regional Report on Ontario's Economic Landscape
VerifiedAdded on 2022/09/09
|9
|2384
|21
Report
AI Summary
This report provides a comprehensive analysis of the Ontario region, focusing on its economic activities, population density, and regional characteristics. The report examines Ontario's diverse economy, highlighting key sectors such as manufacturing, mining, agriculture, forestry, and the service industry. It also delves into the province's population demographics, including growth trends, population distribution, and urbanization patterns. The report discusses the concept of fault lines within the region, exploring the economic, social, and political divisions. It analyzes the impact of natural resources, including minerals, forests, and water bodies, on the region's economy and environment. The report uses statistical data, charts, and tables to illustrate key findings and trends, providing insights into the challenges and opportunities facing Ontario. It also examines the influence of the Great Lakes and the province's geographical location on its economic development. The report concludes with a discussion of potential future challenges, such as population growth, and suggests strategies for sustainable development and resource management.
1Running head: PART (II) REGIONAL REPORT
Part (II) Regional Report
[Name]
[Institutional affiliation]
Part (II) Regional Report
[Name]
[Institutional affiliation]
Paraphrase This Document
Need a fresh take? Get an instant paraphrase of this document with our AI Paraphraser
2PART (II) REGIONAL REPORT
Introduction
Ontario is one of the six regions of Canada, that has the fourth largest territorial border, when
the Nunavut and the Northwest territories are to be considered, but the second largest in area
in Canada after Quebec (World Population Review, 2019). It covers a strip of the mainland of
Canada, between James and Hudson bays that are in the north and the great lakes of St.
Lawrence river that are to its south. On the eastern and the western borders are Quebec and
Manitoba provinces respectively, with Unite States bordering it to the south. According to the
statistics of Canadian population, Ontario is the most populous province of all the provinces,
that homes more than a third of the Canadian Population which is approximately 14,446,515
as per the first quarter of the year 2019 (Statistics Canada, 2019). This paper seeks to look at
this province and region deeply, in terms of economy, population density or demography and
so on.
Economic Activities
Ontario is centrally located, favouring it in terms of proximity to the US markets and the
supplies of coal. Economically, Ontario flourishes by a combination of manufacturing,
increased innovation and resources which generates about 37% of the country’s GDP. The
major economic activities are mining of minerals, automobile manufacturing, software design
and massive technological advancements. In Ontario, there are about 51,950 farmlands,
translating to 12.3 million acres which is more than half of the highest quality of the farm
lands in Canada (Census of agriculture, 2016). The agricultural crops produced includes,
fruits (like apples, grapes, berries etc), cash crops (like soybeans, forage crops, wheat, and
barley), commercial poultry (hog, beef cattle farms, etc), and flowers.
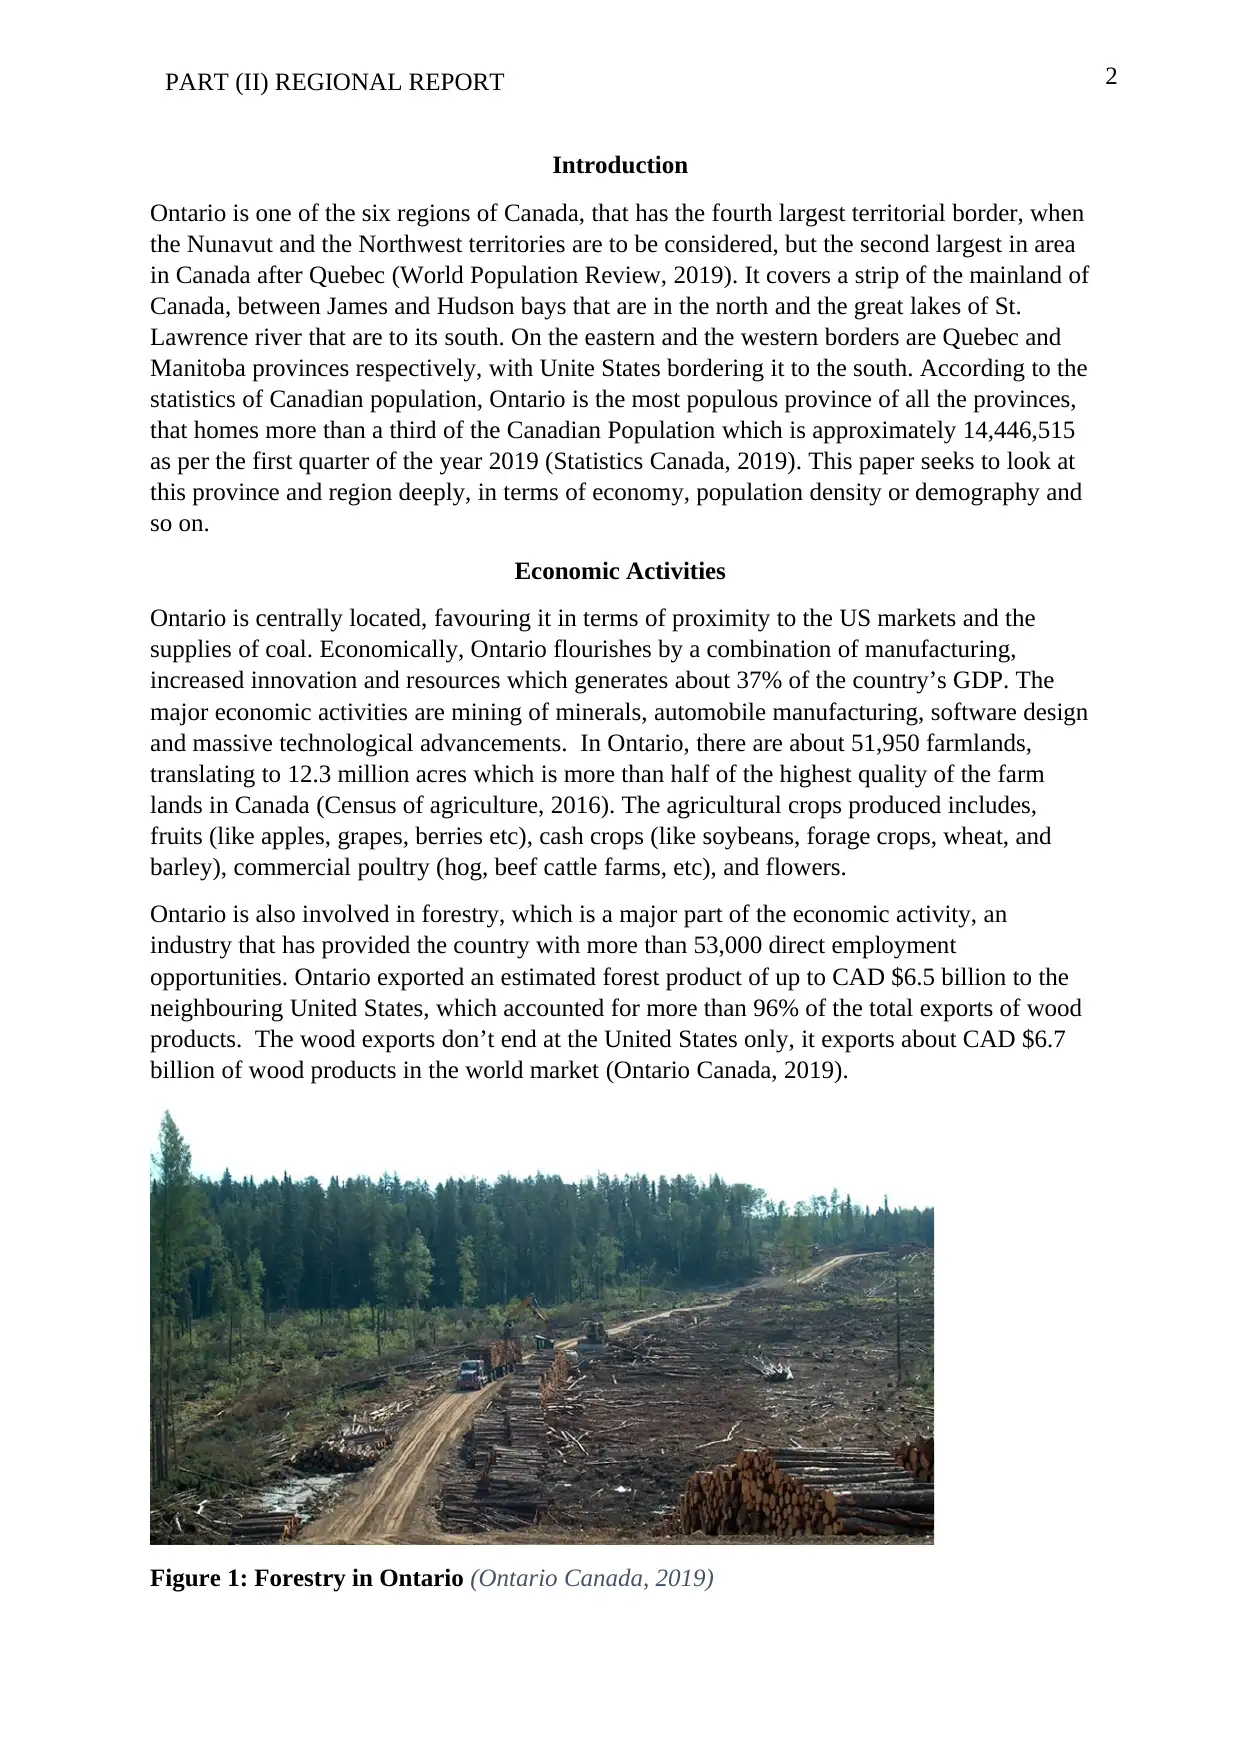
Ontario is also involved in forestry, which is a major part of the economic activity, an
industry that has provided the country with more than 53,000 direct employment
opportunities. Ontario exported an estimated forest product of up to CAD $6.5 billion to the
neighbouring United States, which accounted for more than 96% of the total exports of wood
products. The wood exports don’t end at the United States only, it exports about CAD $6.7
billion of wood products in the world market (Ontario Canada, 2019).
Figure 1: Forestry in Ontario (Ontario Canada, 2019)
Introduction
Ontario is one of the six regions of Canada, that has the fourth largest territorial border, when
the Nunavut and the Northwest territories are to be considered, but the second largest in area
in Canada after Quebec (World Population Review, 2019). It covers a strip of the mainland of
Canada, between James and Hudson bays that are in the north and the great lakes of St.
Lawrence river that are to its south. On the eastern and the western borders are Quebec and
Manitoba provinces respectively, with Unite States bordering it to the south. According to the
statistics of Canadian population, Ontario is the most populous province of all the provinces,
that homes more than a third of the Canadian Population which is approximately 14,446,515
as per the first quarter of the year 2019 (Statistics Canada, 2019). This paper seeks to look at
this province and region deeply, in terms of economy, population density or demography and
so on.
Economic Activities
Ontario is centrally located, favouring it in terms of proximity to the US markets and the
supplies of coal. Economically, Ontario flourishes by a combination of manufacturing,
increased innovation and resources which generates about 37% of the country’s GDP. The
major economic activities are mining of minerals, automobile manufacturing, software design
and massive technological advancements. In Ontario, there are about 51,950 farmlands,
translating to 12.3 million acres which is more than half of the highest quality of the farm
lands in Canada (Census of agriculture, 2016). The agricultural crops produced includes,
fruits (like apples, grapes, berries etc), cash crops (like soybeans, forage crops, wheat, and
barley), commercial poultry (hog, beef cattle farms, etc), and flowers.
Ontario is also involved in forestry, which is a major part of the economic activity, an
industry that has provided the country with more than 53,000 direct employment
opportunities. Ontario exported an estimated forest product of up to CAD $6.5 billion to the
neighbouring United States, which accounted for more than 96% of the total exports of wood
products. The wood exports don’t end at the United States only, it exports about CAD $6.7
billion of wood products in the world market (Ontario Canada, 2019).
Figure 1: Forestry in Ontario (Ontario Canada, 2019)
3PART (II) REGIONAL REPORT
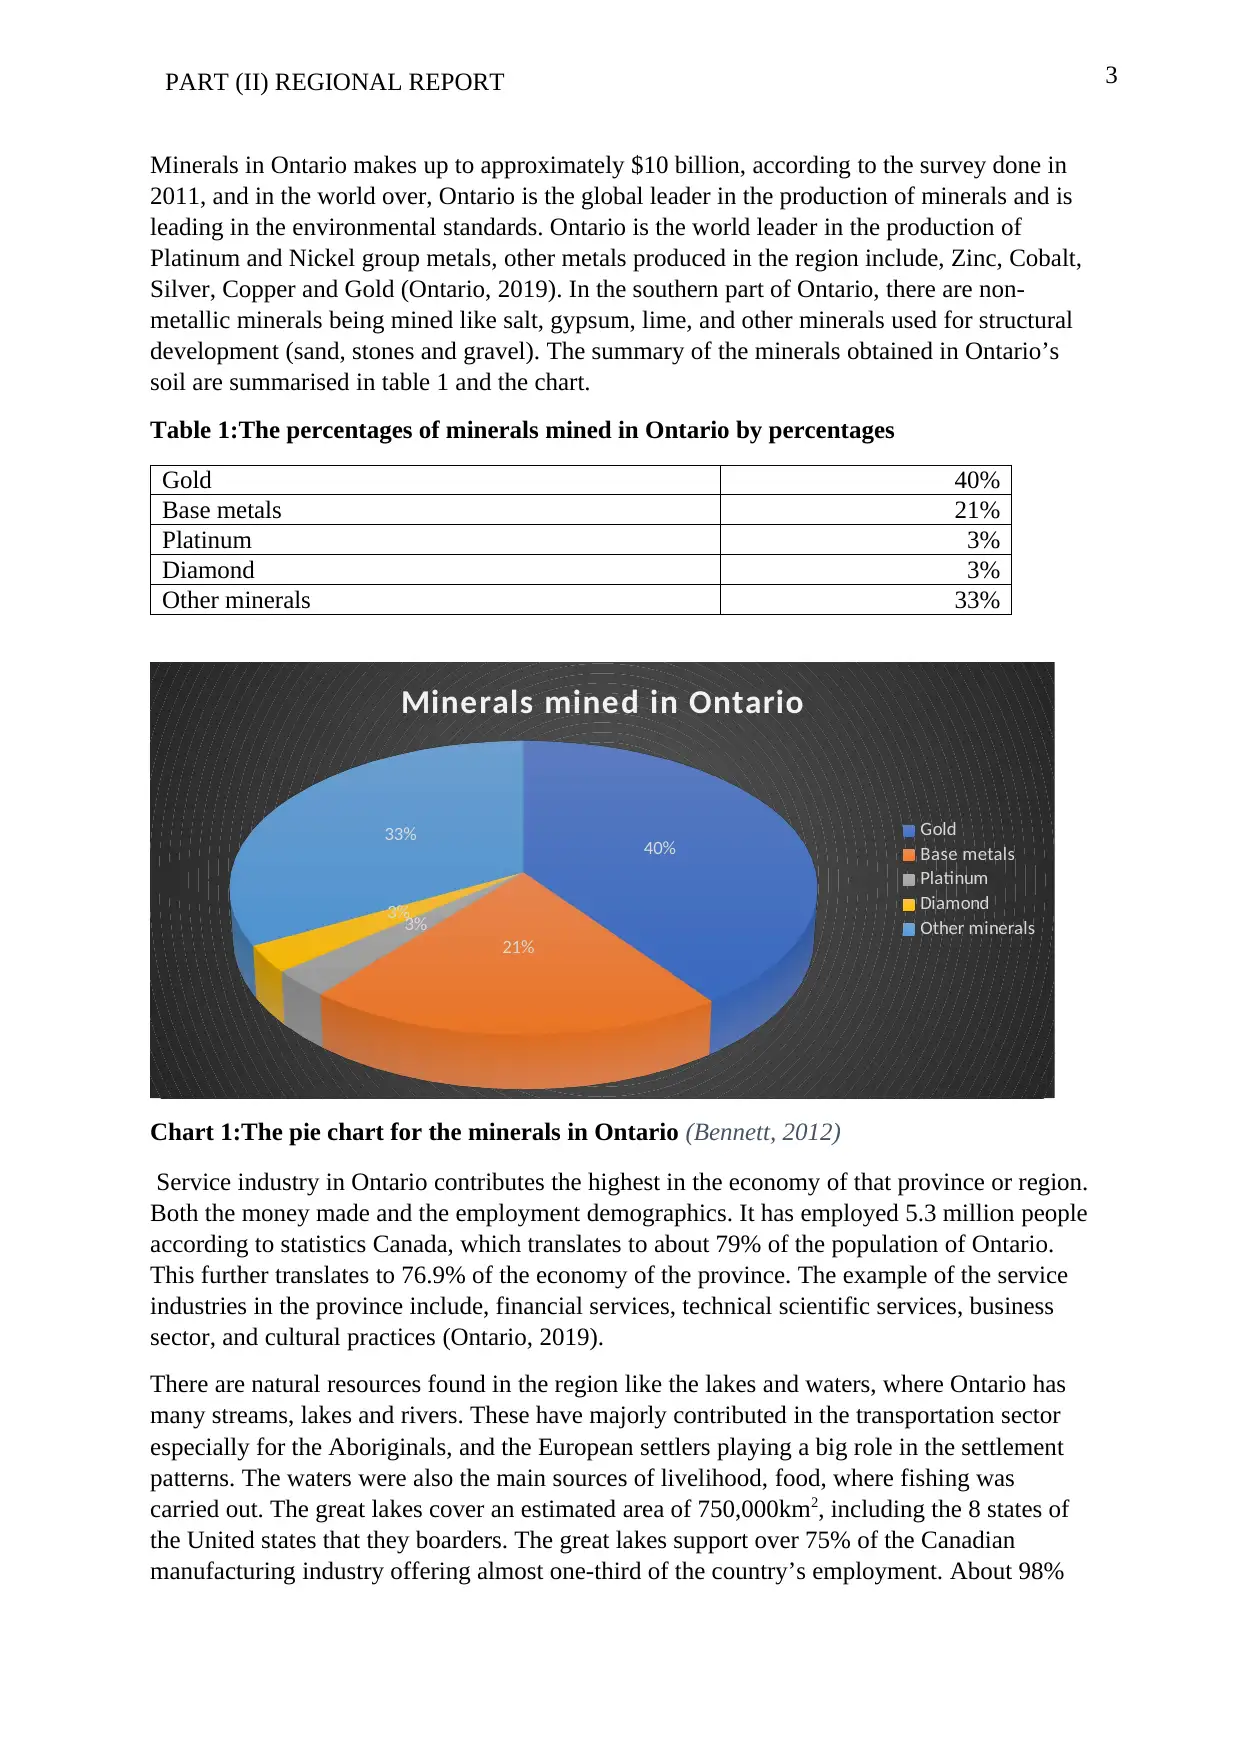
Minerals in Ontario makes up to approximately $10 billion, according to the survey done in
2011, and in the world over, Ontario is the global leader in the production of minerals and is
leading in the environmental standards. Ontario is the world leader in the production of
Platinum and Nickel group metals, other metals produced in the region include, Zinc, Cobalt,
Silver, Copper and Gold (Ontario, 2019). In the southern part of Ontario, there are non-
metallic minerals being mined like salt, gypsum, lime, and other minerals used for structural
development (sand, stones and gravel). The summary of the minerals obtained in Ontario’s
soil are summarised in table 1 and the chart.
Table 1:The percentages of minerals mined in Ontario by percentages
Gold 40%
Base metals 21%
Platinum 3%
Diamond 3%
Other minerals 33%
40%
21%
3%
3%
33%
Minerals mined in Ontario
Gold
Base metals
Platinum
Diamond
Other minerals
Chart 1:The pie chart for the minerals in Ontario (Bennett, 2012)
Service industry in Ontario contributes the highest in the economy of that province or region.
Both the money made and the employment demographics. It has employed 5.3 million people
according to statistics Canada, which translates to about 79% of the population of Ontario.
This further translates to 76.9% of the economy of the province. The example of the service
industries in the province include, financial services, technical scientific services, business
sector, and cultural practices (Ontario, 2019).
There are natural resources found in the region like the lakes and waters, where Ontario has
many streams, lakes and rivers. These have majorly contributed in the transportation sector
especially for the Aboriginals, and the European settlers playing a big role in the settlement
patterns. The waters were also the main sources of livelihood, food, where fishing was
carried out. The great lakes cover an estimated area of 750,000km2, including the 8 states of
the United states that they boarders. The great lakes support over 75% of the Canadian
manufacturing industry offering almost one-third of the country’s employment. About 98%
⊘ This is a preview!⊘
Do you want full access?
Subscribe today to unlock all pages.
Trusted by 1+ million students worldwide
4PART (II) REGIONAL REPORT
of residents of Ontario lives within the peripherals of the great lakes of St Lawrence river
basin.
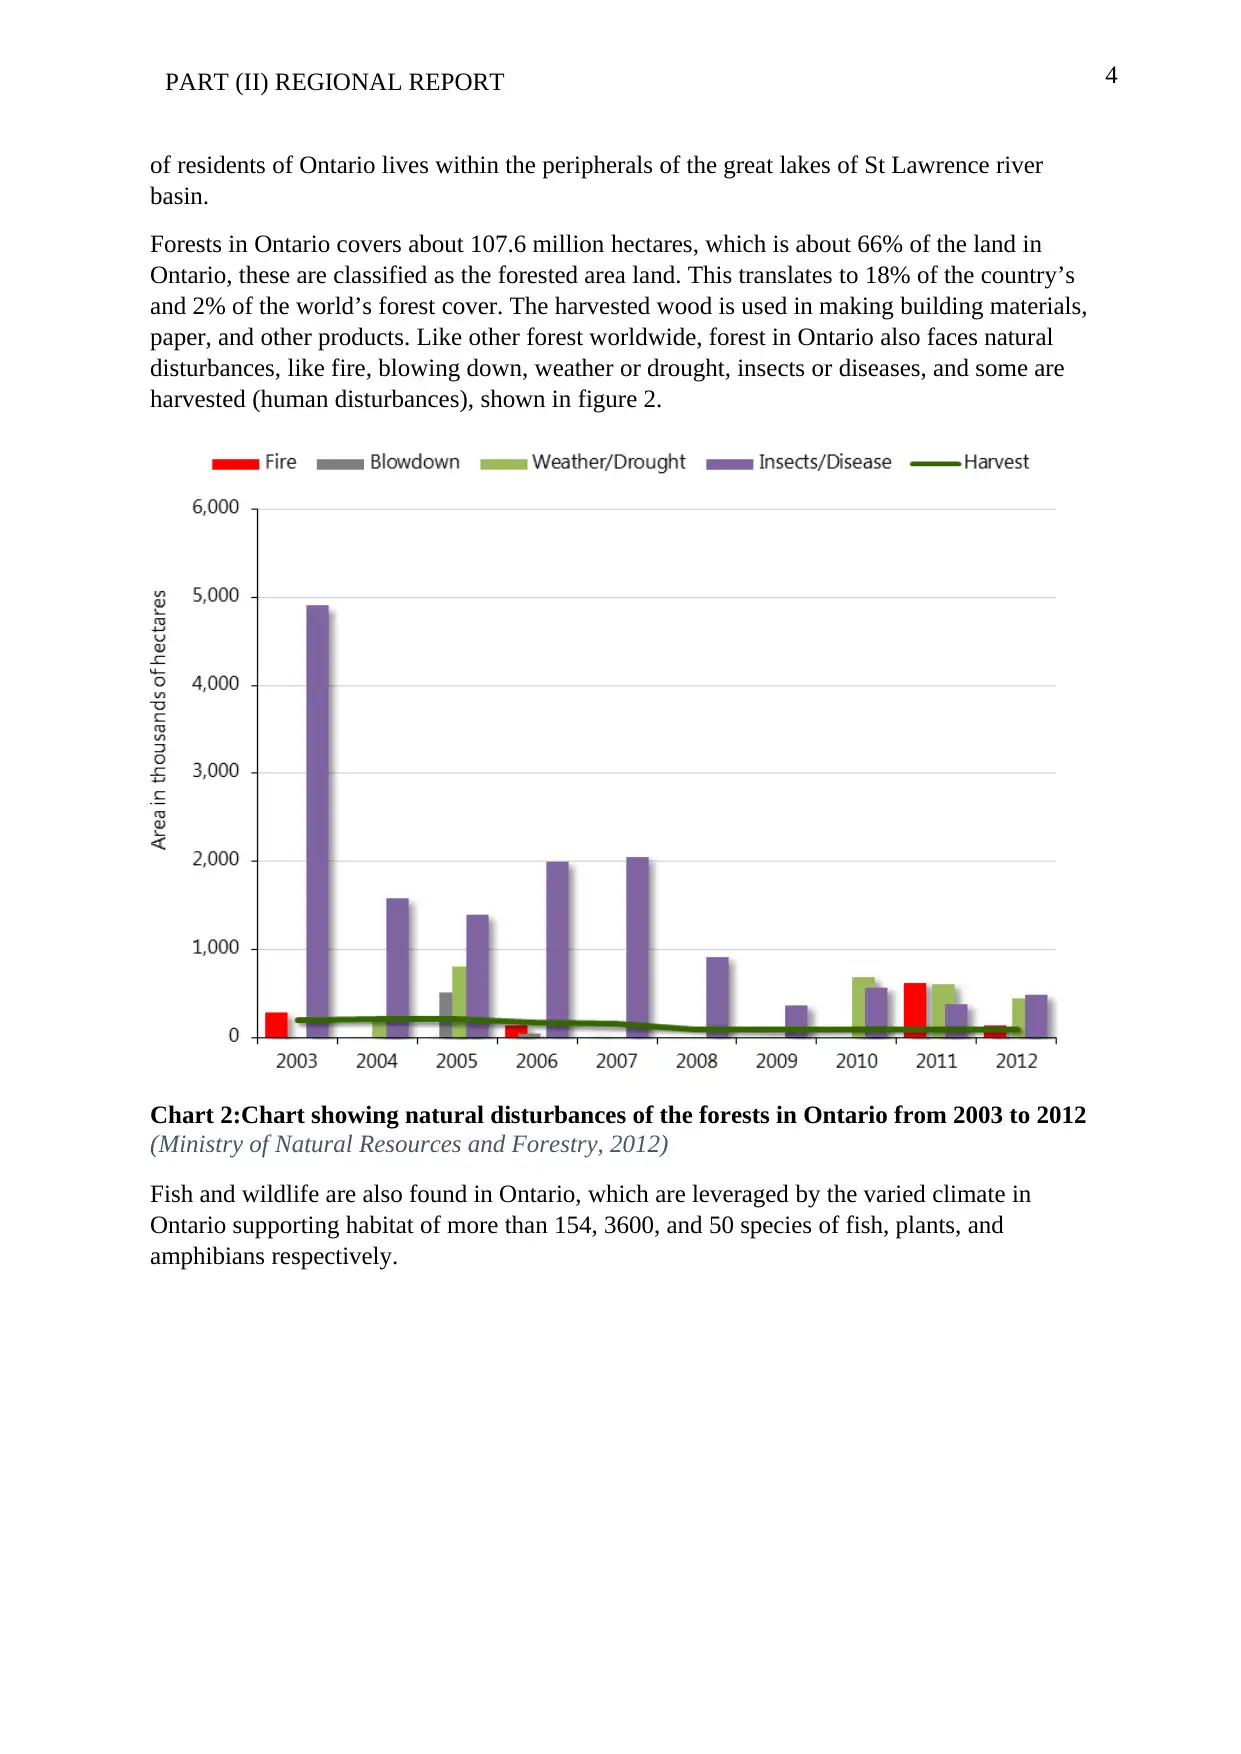
Forests in Ontario covers about 107.6 million hectares, which is about 66% of the land in
Ontario, these are classified as the forested area land. This translates to 18% of the country’s
and 2% of the world’s forest cover. The harvested wood is used in making building materials,
paper, and other products. Like other forest worldwide, forest in Ontario also faces natural
disturbances, like fire, blowing down, weather or drought, insects or diseases, and some are
harvested (human disturbances), shown in figure 2.
Chart 2:Chart showing natural disturbances of the forests in Ontario from 2003 to 2012
(Ministry of Natural Resources and Forestry, 2012)
Fish and wildlife are also found in Ontario, which are leveraged by the varied climate in
Ontario supporting habitat of more than 154, 3600, and 50 species of fish, plants, and
amphibians respectively.
of residents of Ontario lives within the peripherals of the great lakes of St Lawrence river
basin.
Forests in Ontario covers about 107.6 million hectares, which is about 66% of the land in
Ontario, these are classified as the forested area land. This translates to 18% of the country’s
and 2% of the world’s forest cover. The harvested wood is used in making building materials,
paper, and other products. Like other forest worldwide, forest in Ontario also faces natural
disturbances, like fire, blowing down, weather or drought, insects or diseases, and some are
harvested (human disturbances), shown in figure 2.
Chart 2:Chart showing natural disturbances of the forests in Ontario from 2003 to 2012
(Ministry of Natural Resources and Forestry, 2012)
Fish and wildlife are also found in Ontario, which are leveraged by the varied climate in
Ontario supporting habitat of more than 154, 3600, and 50 species of fish, plants, and
amphibians respectively.
Paraphrase This Document
Need a fresh take? Get an instant paraphrase of this document with our AI Paraphraser
5PART (II) REGIONAL REPORT
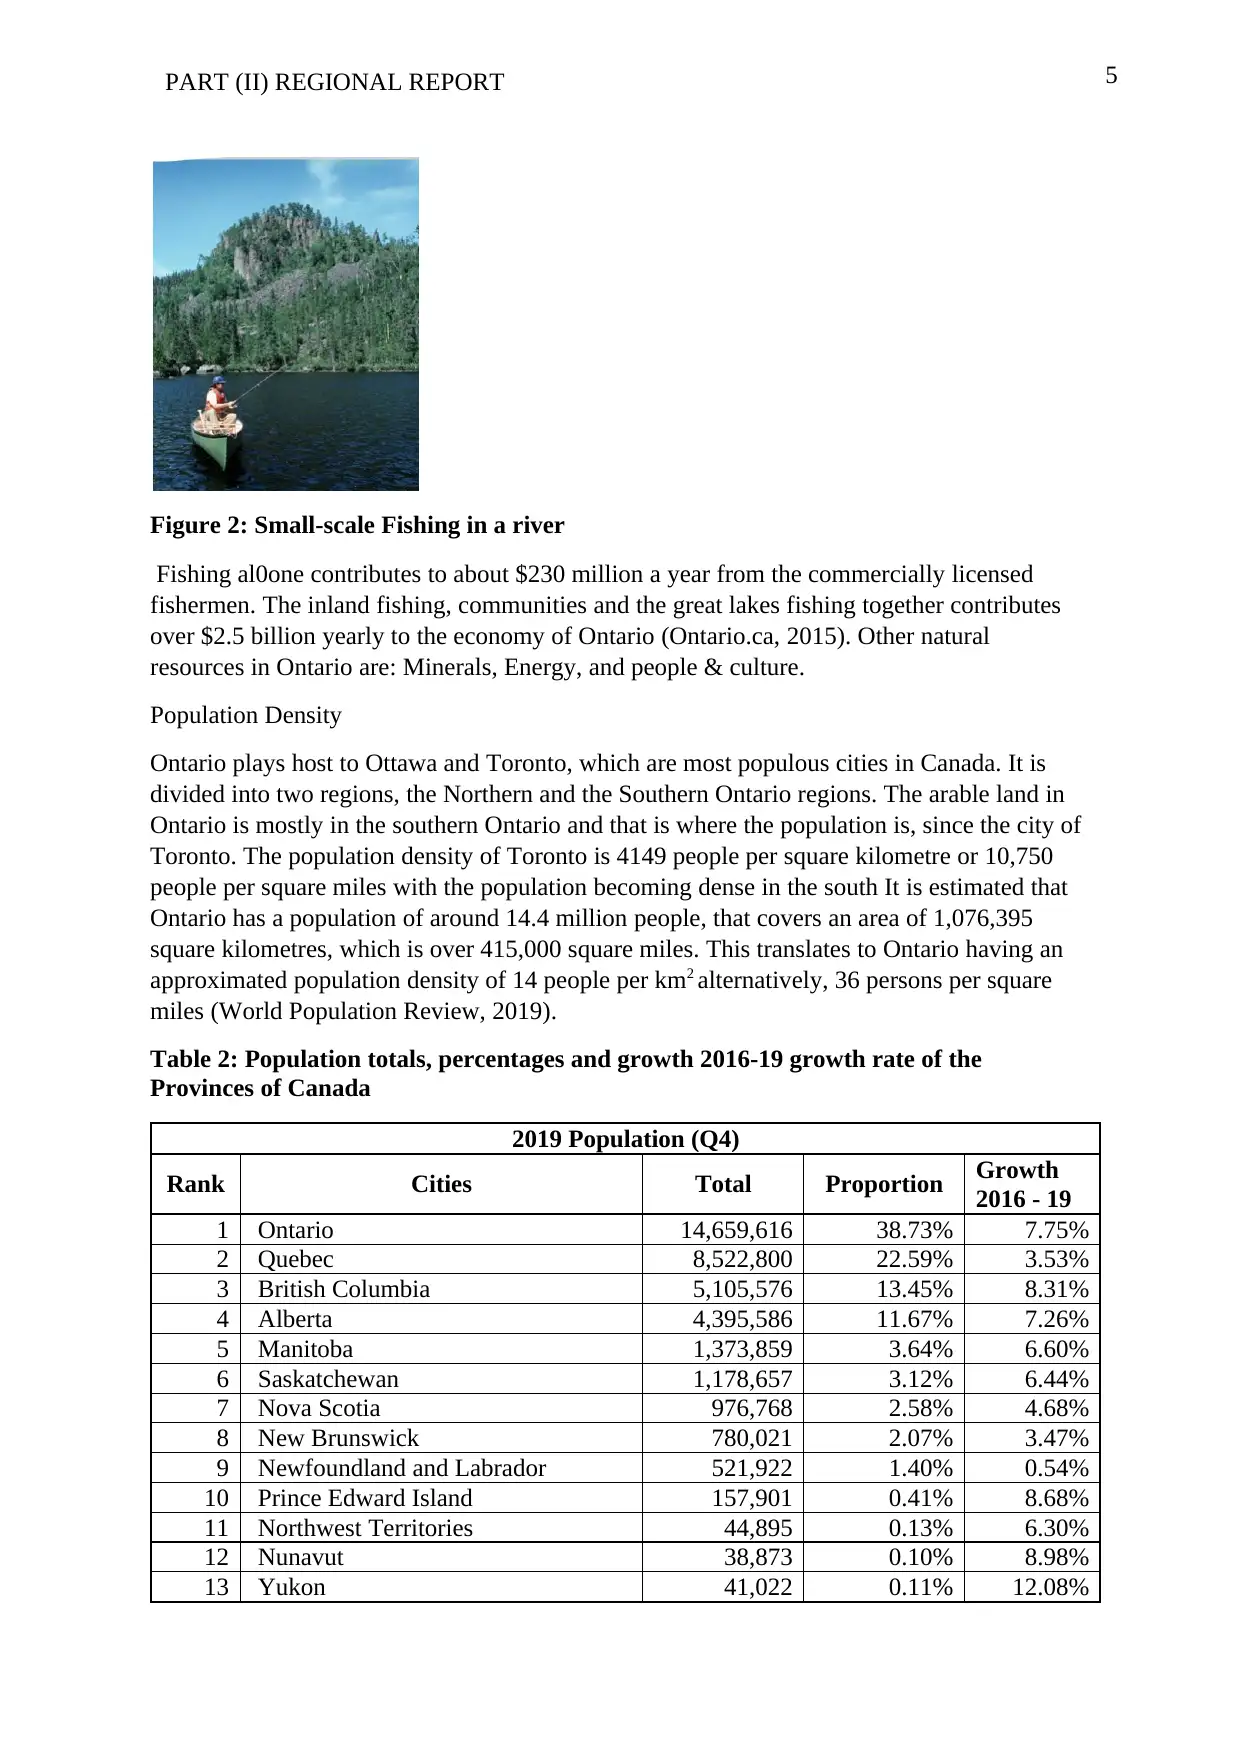
Figure 2: Small-scale Fishing in a river
Fishing al0one contributes to about $230 million a year from the commercially licensed
fishermen. The inland fishing, communities and the great lakes fishing together contributes
over $2.5 billion yearly to the economy of Ontario (Ontario.ca, 2015). Other natural
resources in Ontario are: Minerals, Energy, and people & culture.
Population Density
Ontario plays host to Ottawa and Toronto, which are most populous cities in Canada. It is
divided into two regions, the Northern and the Southern Ontario regions. The arable land in
Ontario is mostly in the southern Ontario and that is where the population is, since the city of
Toronto. The population density of Toronto is 4149 people per square kilometre or 10,750
people per square miles with the population becoming dense in the south It is estimated that
Ontario has a population of around 14.4 million people, that covers an area of 1,076,395
square kilometres, which is over 415,000 square miles. This translates to Ontario having an
approximated population density of 14 people per km2 alternatively, 36 persons per square
miles (World Population Review, 2019).
Table 2: Population totals, percentages and growth 2016-19 growth rate of the
Provinces of Canada
2019 Population (Q4)
Rank Cities Total Proportion Growth
2016 - 19
1 Ontario 14,659,616 38.73% 7.75%
2 Quebec 8,522,800 22.59% 3.53%
3 British Columbia 5,105,576 13.45% 8.31%
4 Alberta 4,395,586 11.67% 7.26%
5 Manitoba 1,373,859 3.64% 6.60%
6 Saskatchewan 1,178,657 3.12% 6.44%
7 Nova Scotia 976,768 2.58% 4.68%
8 New Brunswick 780,021 2.07% 3.47%
9 Newfoundland and Labrador 521,922 1.40% 0.54%
10 Prince Edward Island 157,901 0.41% 8.68%
11 Northwest Territories 44,895 0.13% 6.30%
12 Nunavut 38,873 0.10% 8.98%
13 Yukon 41,022 0.11% 12.08%
6PART (II) REGIONAL REPORT
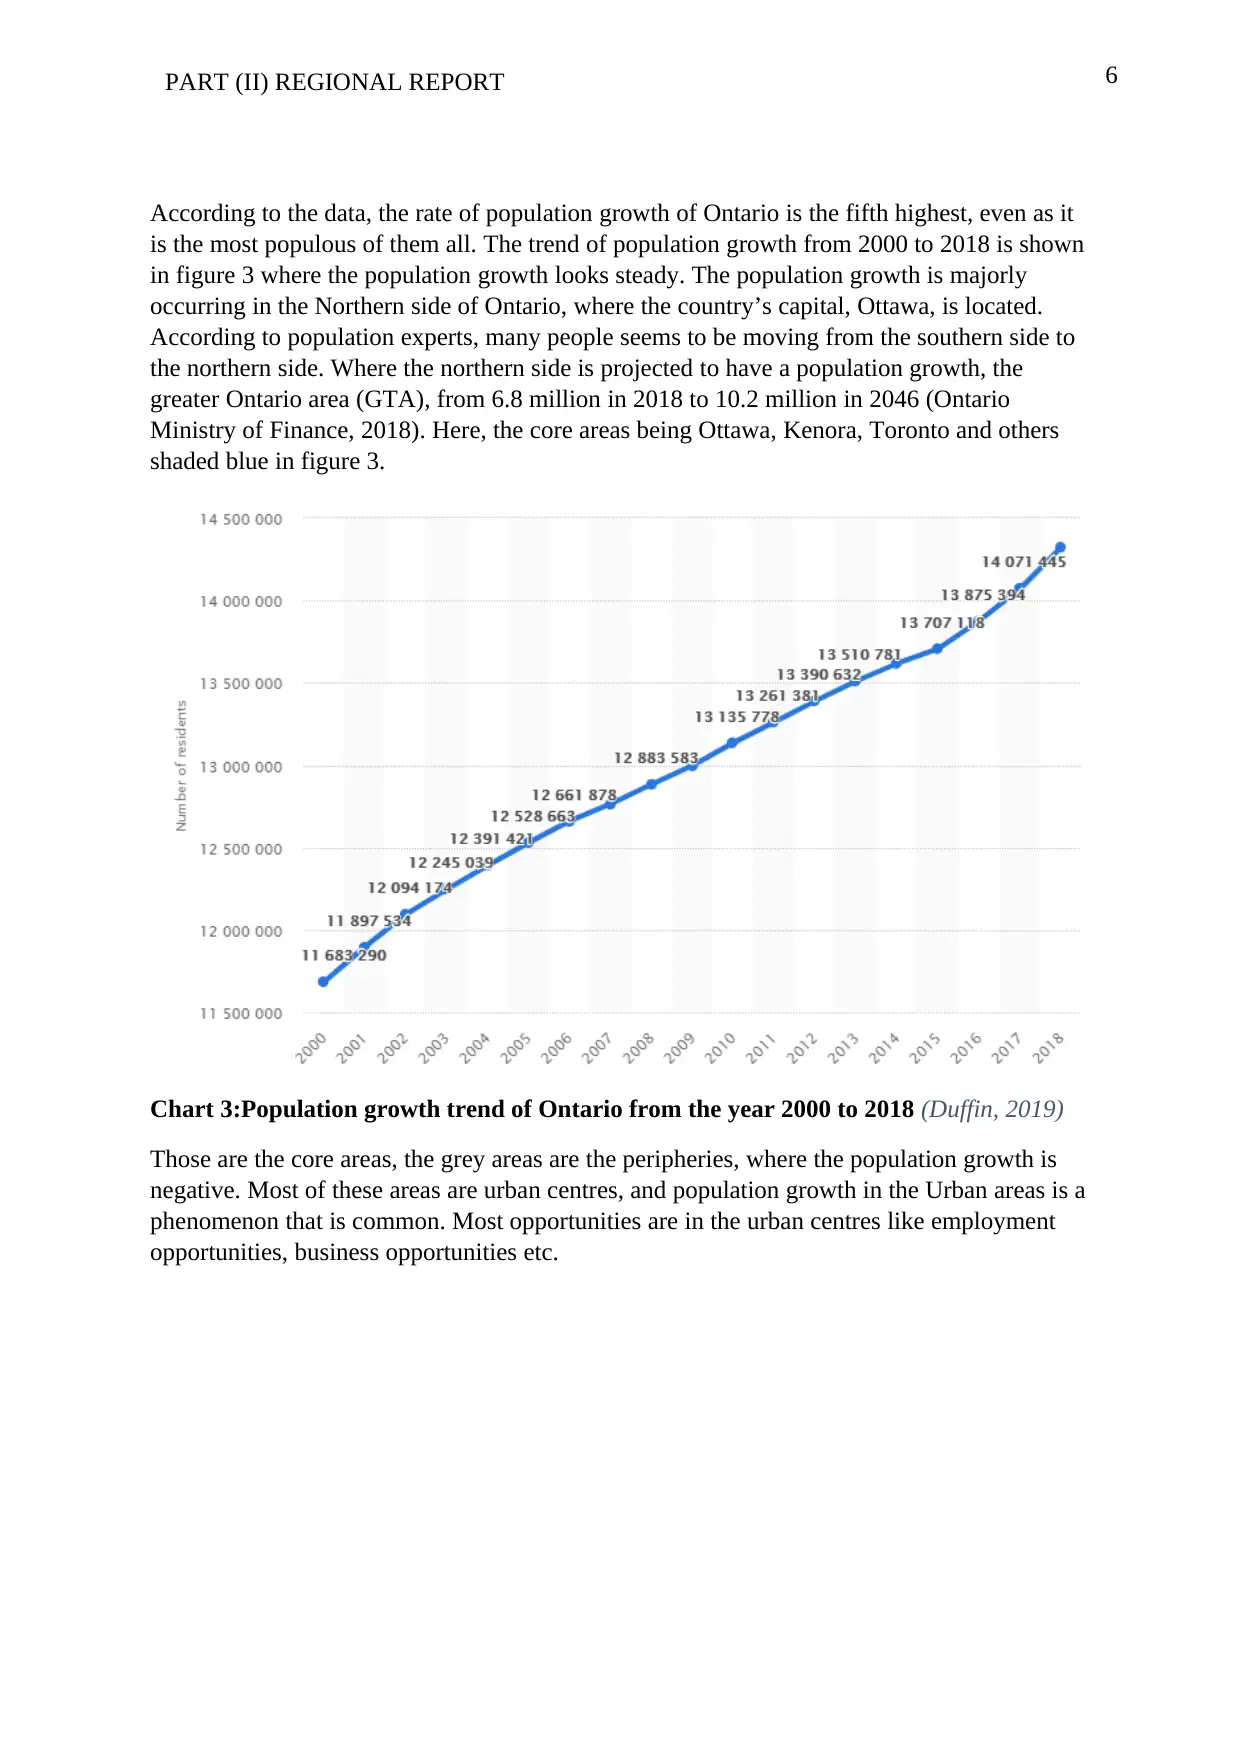
According to the data, the rate of population growth of Ontario is the fifth highest, even as it
is the most populous of them all. The trend of population growth from 2000 to 2018 is shown
in figure 3 where the population growth looks steady. The population growth is majorly
occurring in the Northern side of Ontario, where the country’s capital, Ottawa, is located.
According to population experts, many people seems to be moving from the southern side to
the northern side. Where the northern side is projected to have a population growth, the
greater Ontario area (GTA), from 6.8 million in 2018 to 10.2 million in 2046 (Ontario
Ministry of Finance, 2018). Here, the core areas being Ottawa, Kenora, Toronto and others
shaded blue in figure 3.
Chart 3:Population growth trend of Ontario from the year 2000 to 2018 (Duffin, 2019)
Those are the core areas, the grey areas are the peripheries, where the population growth is
negative. Most of these areas are urban centres, and population growth in the Urban areas is a
phenomenon that is common. Most opportunities are in the urban centres like employment
opportunities, business opportunities etc.
⊘ This is a preview!⊘
Do you want full access?
Subscribe today to unlock all pages.
Trusted by 1+ million students worldwide
7PART (II) REGIONAL REPORT
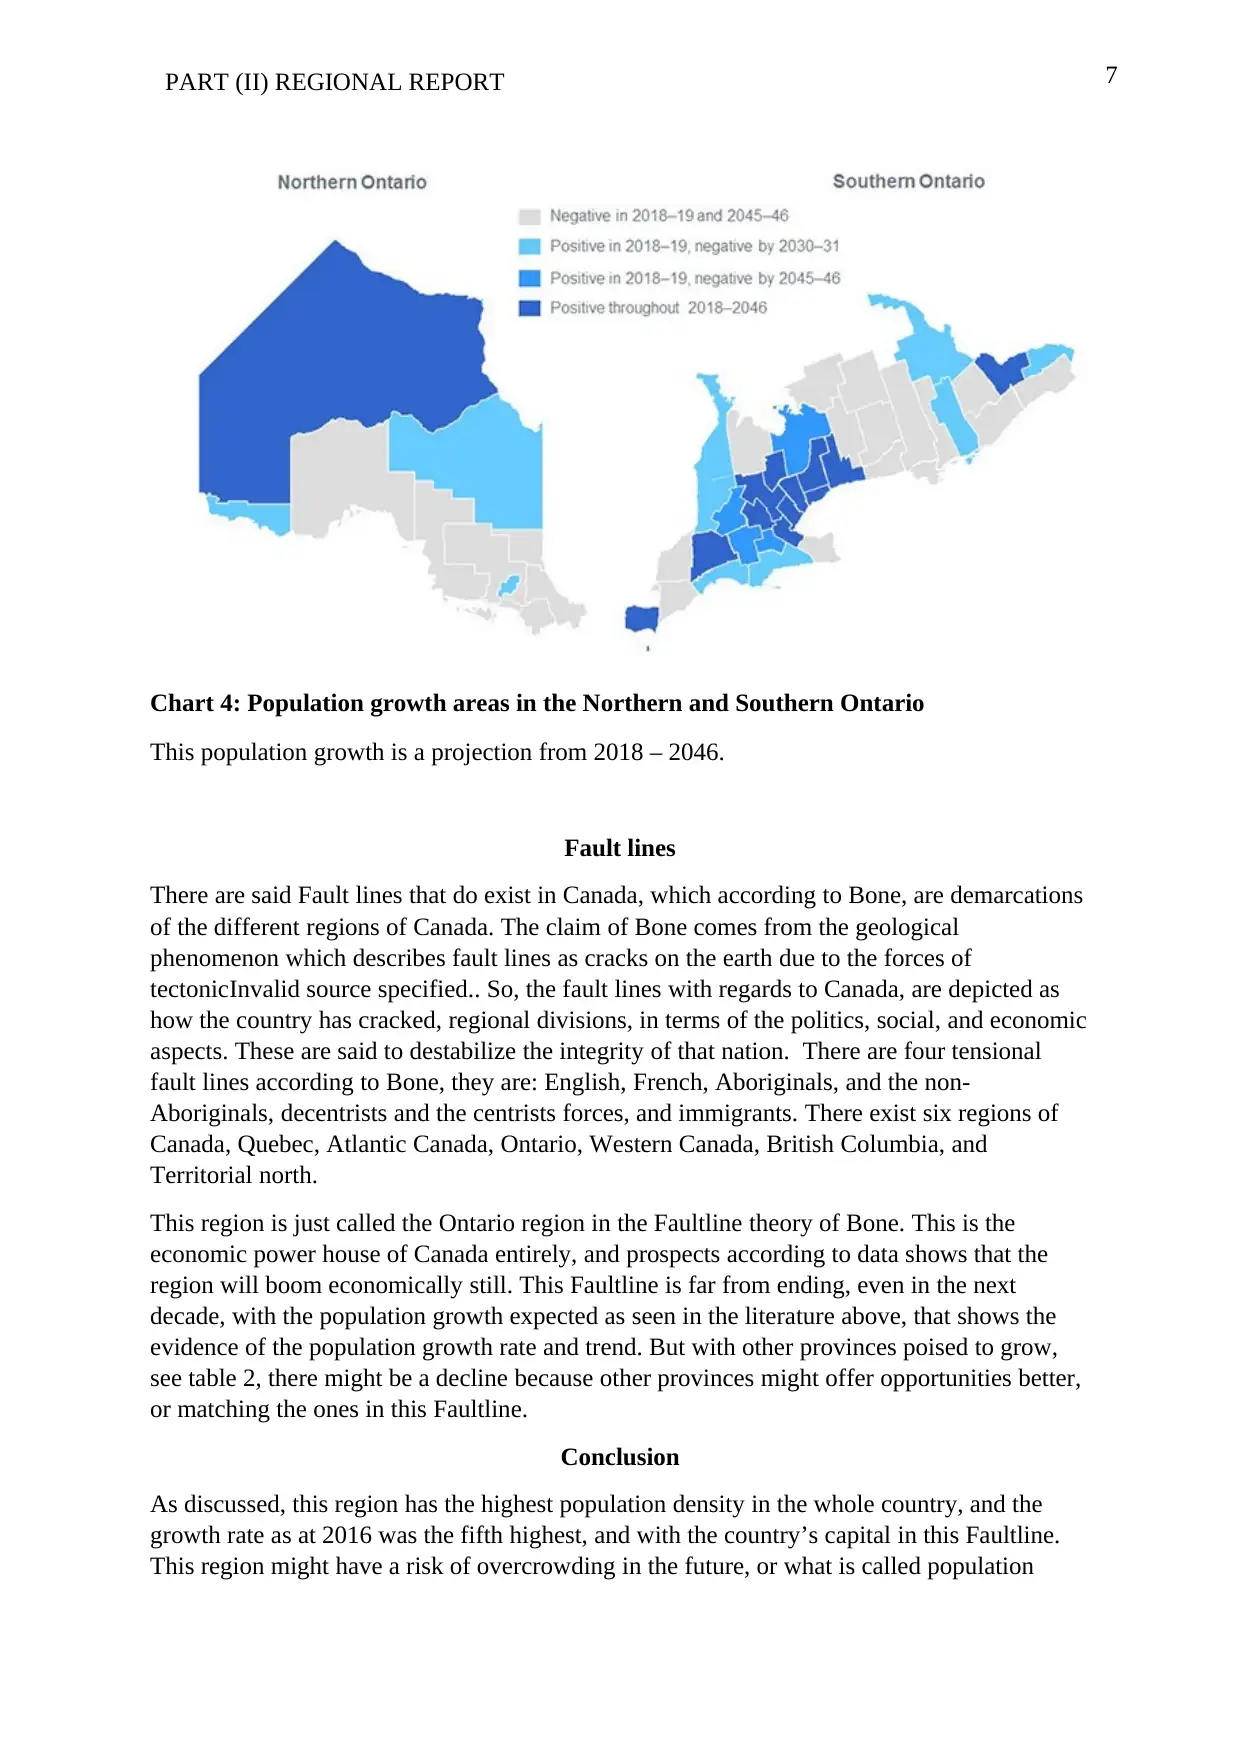
Chart 4: Population growth areas in the Northern and Southern Ontario
This population growth is a projection from 2018 – 2046.
Fault lines
There are said Fault lines that do exist in Canada, which according to Bone, are demarcations
of the different regions of Canada. The claim of Bone comes from the geological
phenomenon which describes fault lines as cracks on the earth due to the forces of
tectonicInvalid source specified.. So, the fault lines with regards to Canada, are depicted as
how the country has cracked, regional divisions, in terms of the politics, social, and economic
aspects. These are said to destabilize the integrity of that nation. There are four tensional
fault lines according to Bone, they are: English, French, Aboriginals, and the non-
Aboriginals, decentrists and the centrists forces, and immigrants. There exist six regions of
Canada, Quebec, Atlantic Canada, Ontario, Western Canada, British Columbia, and
Territorial north.
This region is just called the Ontario region in the Faultline theory of Bone. This is the
economic power house of Canada entirely, and prospects according to data shows that the
region will boom economically still. This Faultline is far from ending, even in the next
decade, with the population growth expected as seen in the literature above, that shows the
evidence of the population growth rate and trend. But with other provinces poised to grow,
see table 2, there might be a decline because other provinces might offer opportunities better,
or matching the ones in this Faultline.
Conclusion
As discussed, this region has the highest population density in the whole country, and the
growth rate as at 2016 was the fifth highest, and with the country’s capital in this Faultline.
This region might have a risk of overcrowding in the future, or what is called population
Paraphrase This Document
Need a fresh take? Get an instant paraphrase of this document with our AI Paraphraser
8PART (II) REGIONAL REPORT
explosion. The troubles that come with population explosions range from competition of the
resources that will be scarce, and insecurity incidences. This challenge is chief to the people
since most of them depend on the already scarce for their livelihood. If you look at the main
economic activity of the region, you notice that service industry takes the centre stage, when
there’s population growth, these opportunities might dwindle. There are two things that can
be done to try and mitigate this impending plight, one is internal and one is external. The
internal deals with restricting the inflow of people in the region, which has to be executed by
the authorities locally, who creates policies for that. Finally, the external solution has to be
with the central government, who can create opportunities in other regions for the population
to be distributed to other regions as well.
References
Bennett, R. (2012). Mining in Ontario: Deeper look. Ontario: Ontario Nature.
9PART (II) REGIONAL REPORT
Census of agriculture. (2016). 2016 Census of Agriculture. Retrieved December 17, 2019,
from https://www150.statcan.gc.ca/n1/daily-quotidien/170510/dq170510a-eng.htm?
indid=10441-2&indgeo=6
Duffin, E. (2019). Population estimates for Ontario, Canada from 2000 to 2018. Retrieved
December 15, 2019, from https://www.statista.com/statistics/569874/population-
estimates-ontario-canada/
Ministry of Natural Resources and Forestry. (2012). Archived - Annual report on forest
management 2012-2013. Retrieved December 18, 2019, from
http://www.ofia.com/from-the-forest/forestry-facts.html
Ontario. (2019). About Ontario. Retrieved December 14, 2019, from
https://www.ontario.ca/page/about-ontario
Ontario Canada. (2019). Forestry. Retrieved December 14, 2019, from
https://www.investinontario.com/forestry#largest-markets
Ontario Ministry of Finance. (2018). Ontario Population Projections, 2018–2046. Retrieved
December 16, 2019, from
https://www.fin.gov.on.ca/en/economy/demographics/projections/
Ontario.ca. (2015). ONTARIO’S PROVINCIAL: Fish strategy Fish for the future. Ontario:
Cette publication.
Statistics Canada. (2019). Population Ontario. Retrieved December 17, 2019, from
https://www120.statcan.gc.ca/stcsr/en/sr1/srs?q=Ontario&fq=stclac%3A2&wb-srch-
sub=search
World Population Review. (2019). Ontario Population 2019. Retrieved December 15, 2019,
from http://worldpopulationreview.com/canadian-provinces/ontario-population/
⊘ This is a preview!⊘
Do you want full access?
Subscribe today to unlock all pages.
Trusted by 1+ million students worldwide
1 out of 9
Related Documents


Your All-in-One AI-Powered Toolkit for Academic Success.
+13062052269
info@desklib.com
Available 24*7 on WhatsApp / Email
![[object Object]](/_next/static/media/star-bottom.7253800d.svg)
Unlock your academic potential
Copyright © 2020–2026 A2Z Services. All Rights Reserved. Developed and managed by ZUCOL.