Comprehensive Analysis of Regional Sales and Profit: 2013-2016 Data

Verified

Added on  2022/10/19

|13
|381
|57
Report
AI Summary
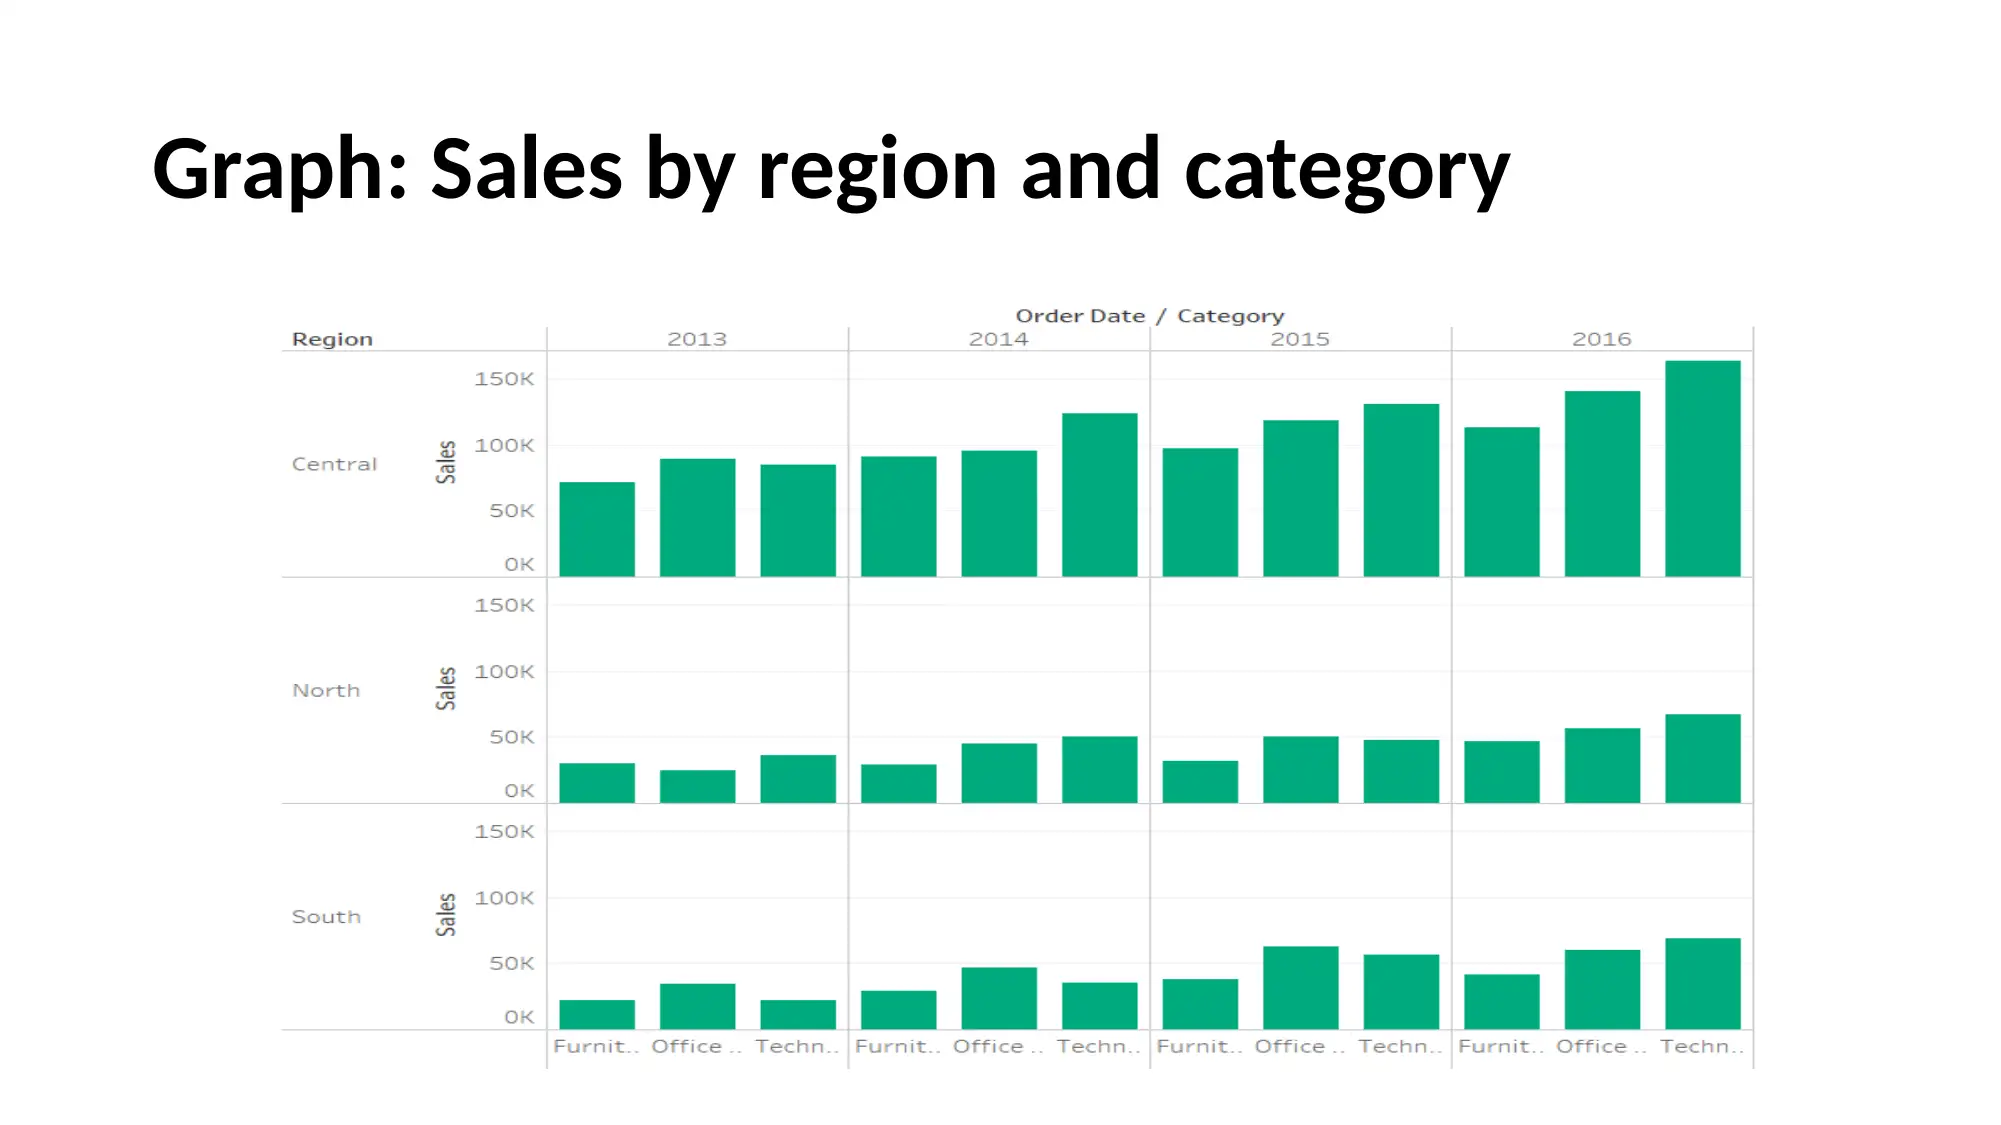
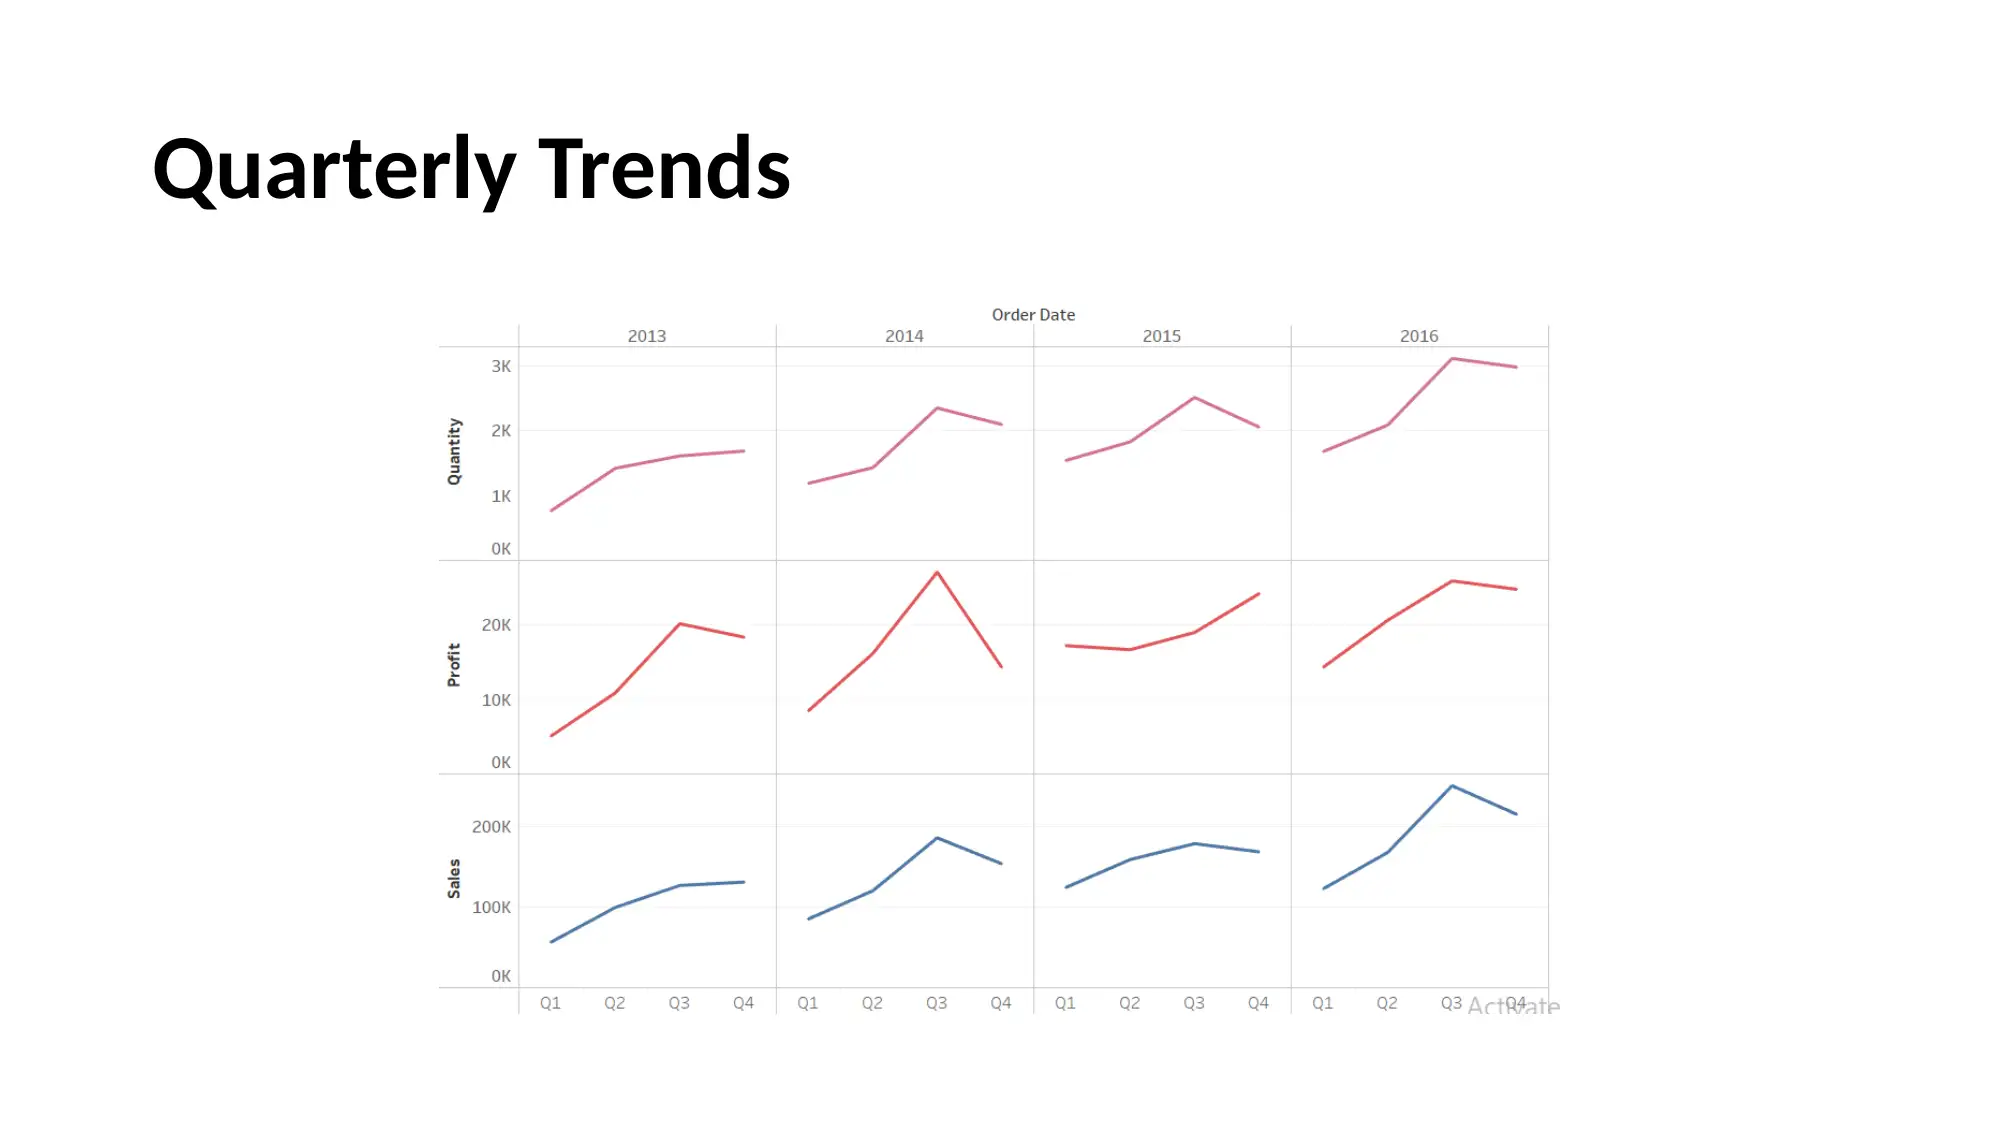
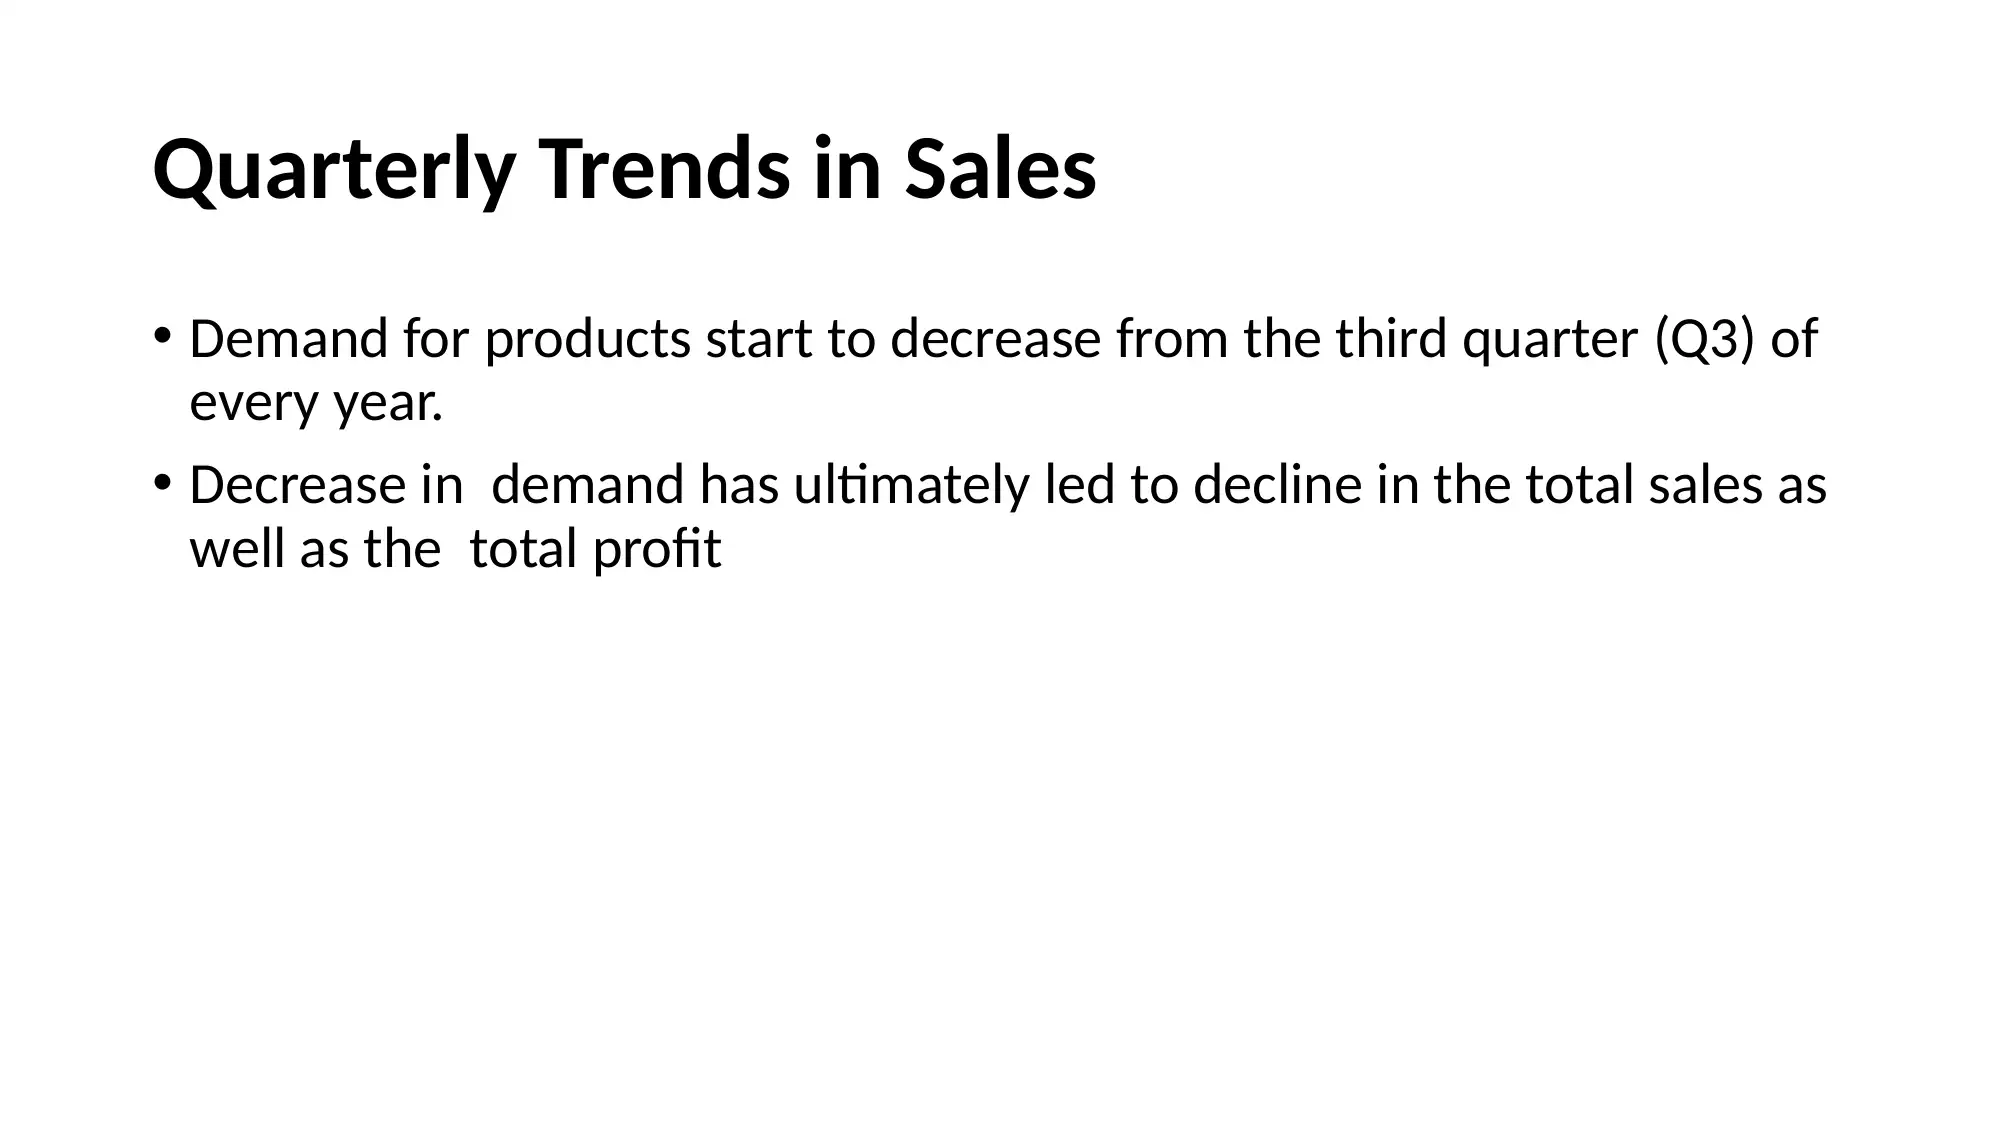
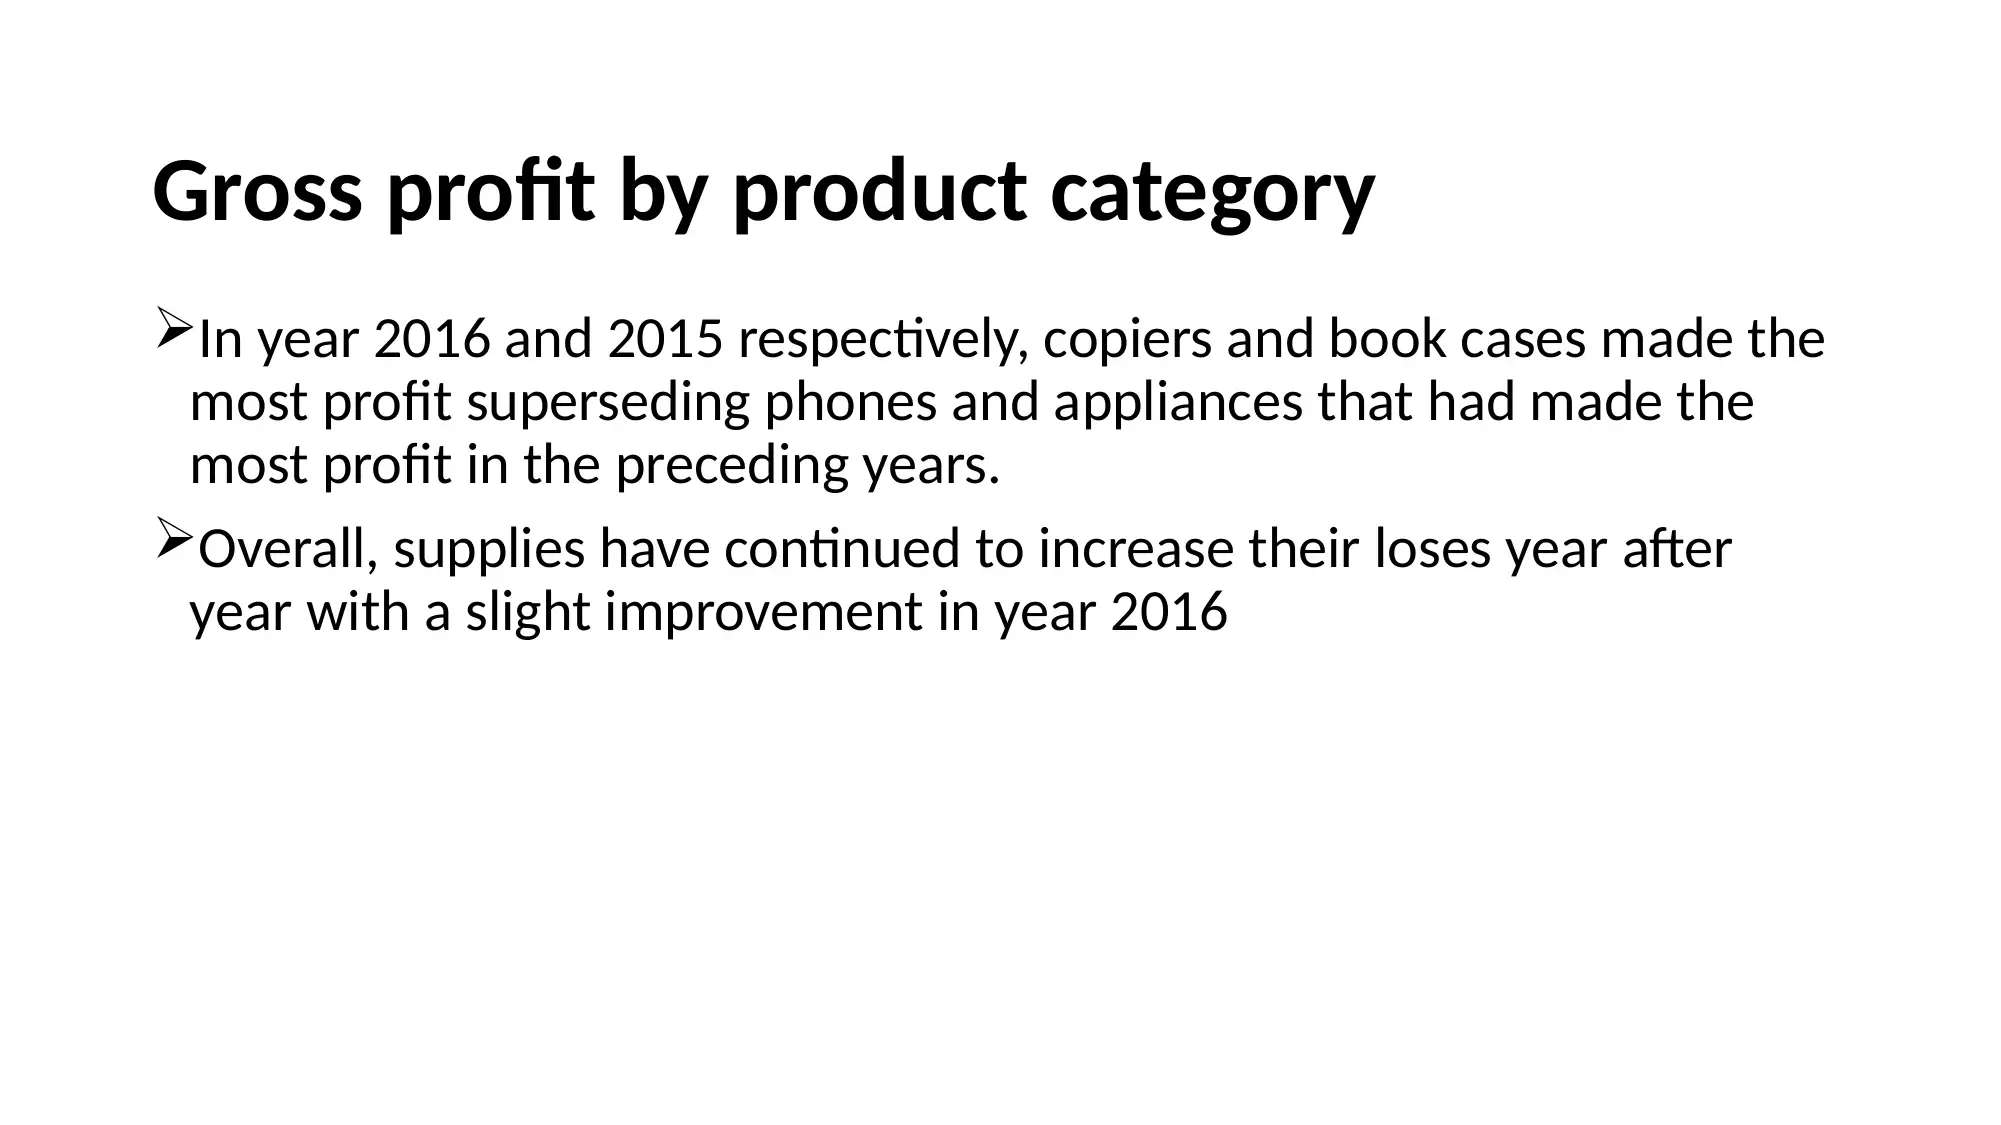
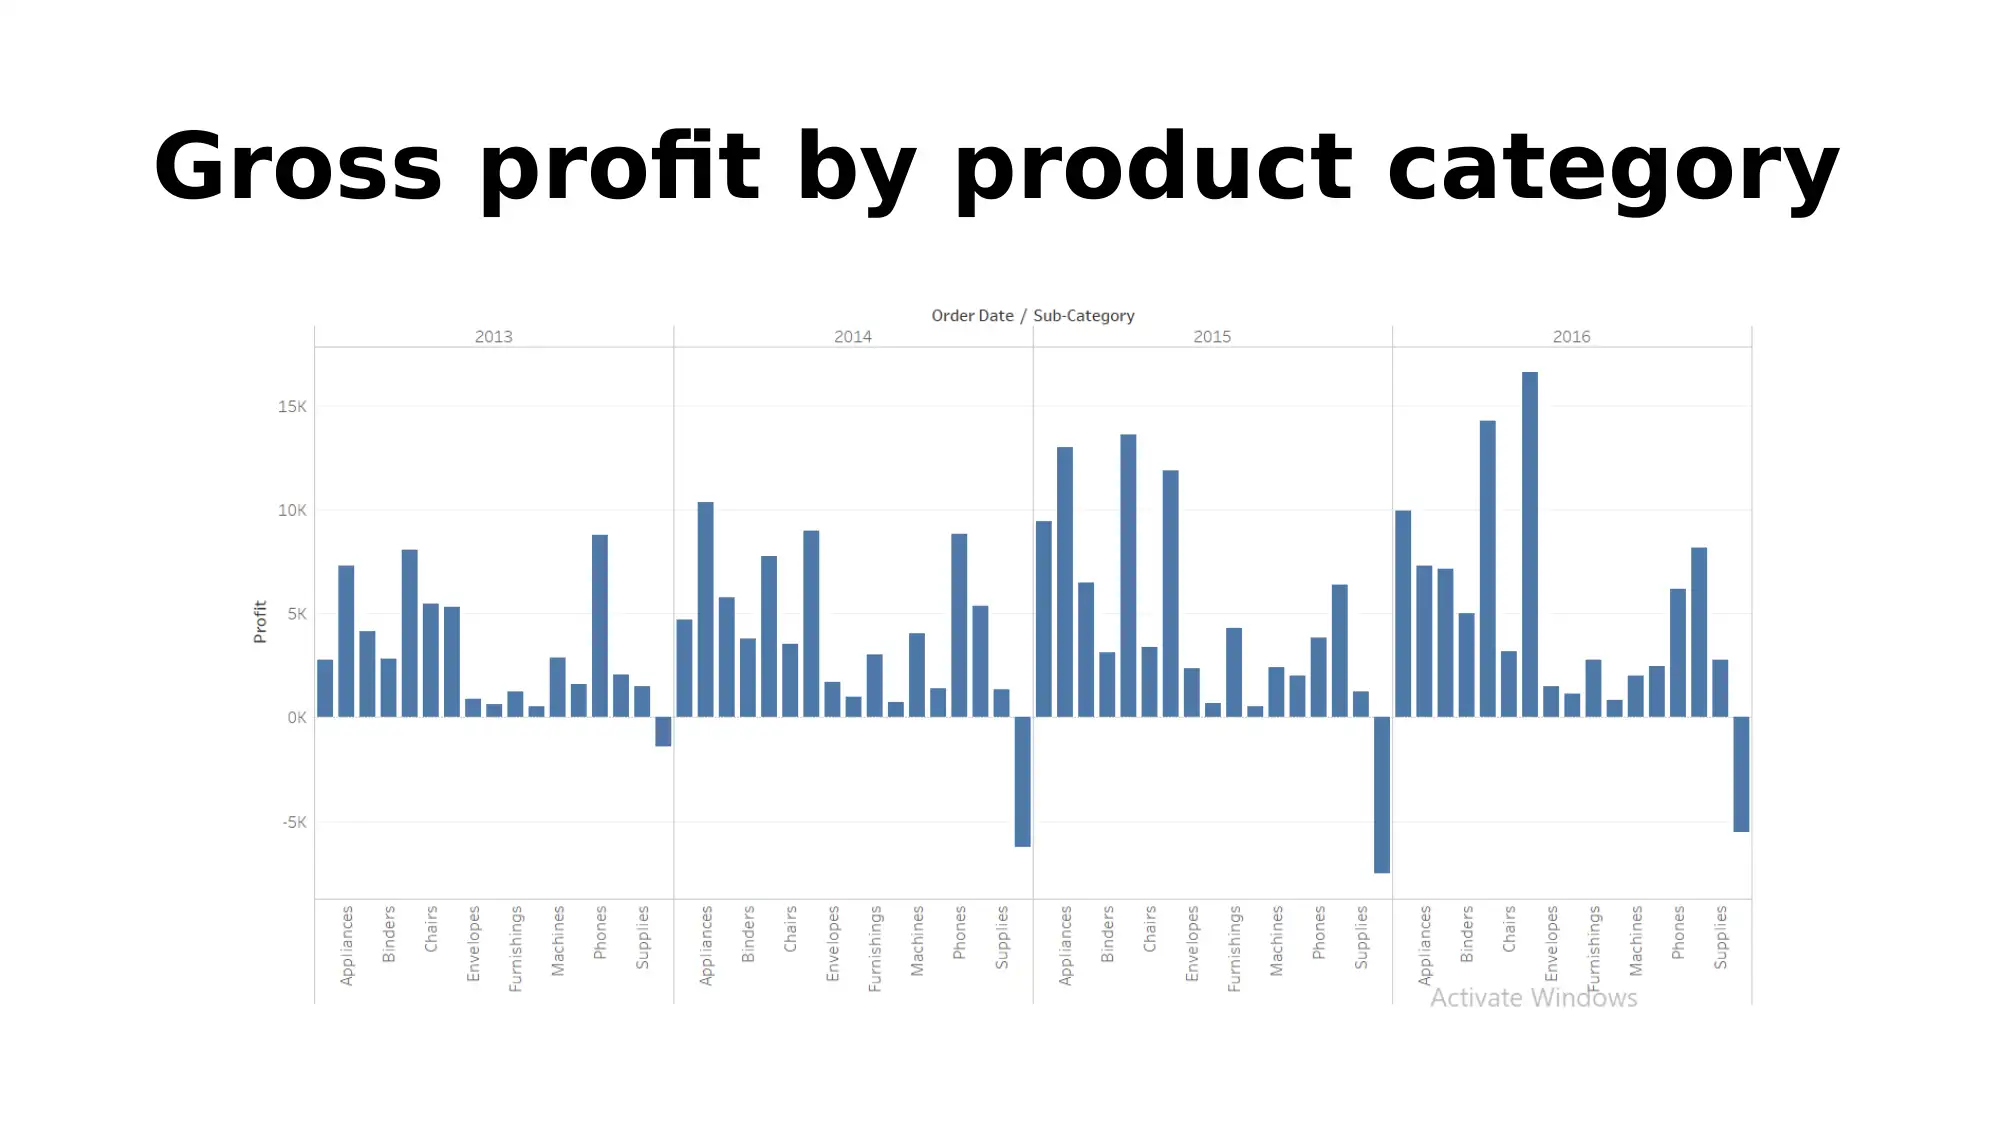
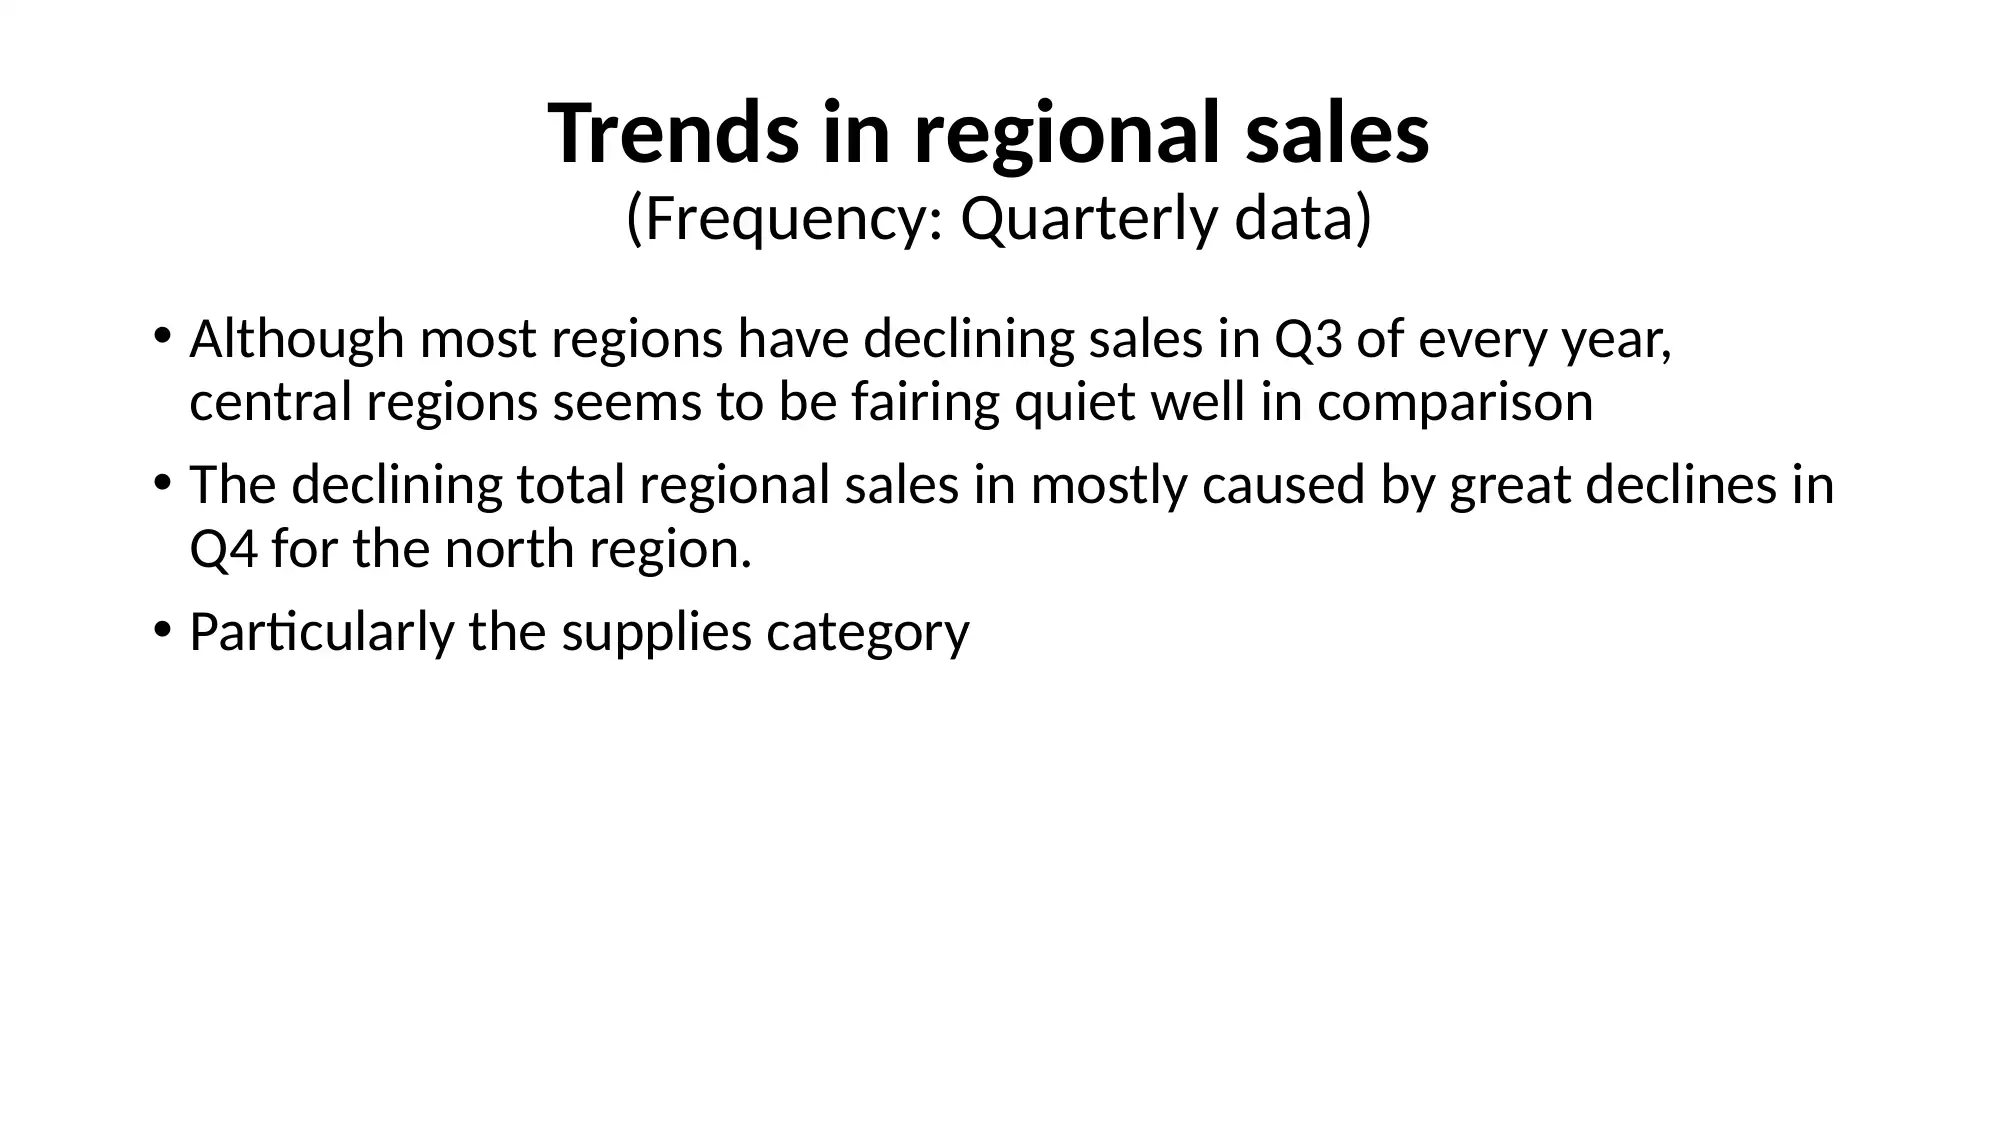
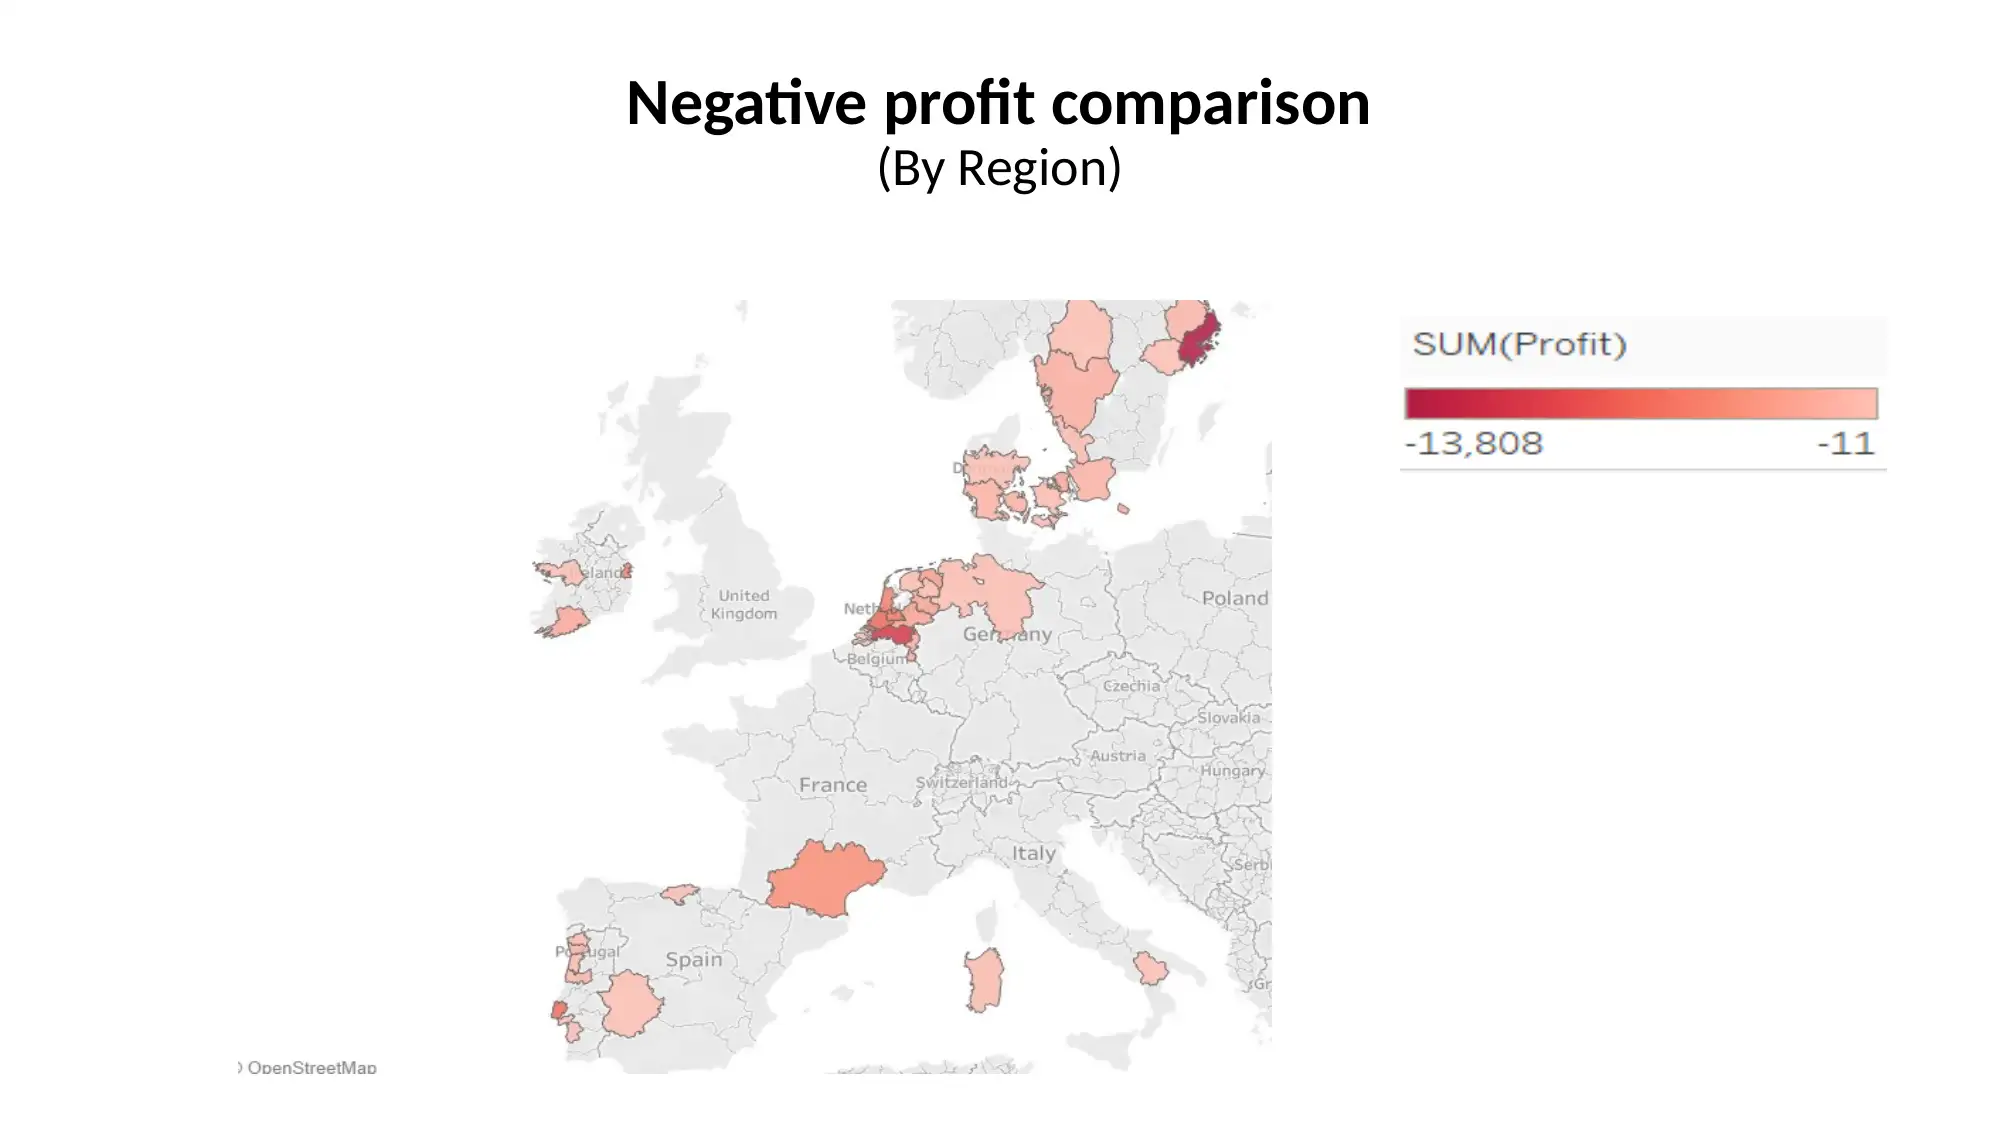
This report provides an analysis of sales and profit data from 2013 to 2016, focusing on regional trends and product category performance. The central region showed consistent growth, while the southern region underperformed. The technology category, particularly phones, drove significant sales. Quarterly data indicates sales declines in Q3. The report also compares gross profits, showing that copiers and bookcases generated the most profit in 2016 and 2015, and highlights the negative profits in the central and northern regions. Overall, the analysis provides a detailed view of sales performance, regional variations, and product profitability over the specified period.
Document Page
Stakeholder's Report
Overall company health 2013-2016
tabler-icon-diamond-filled.svg

Paraphrase This Document

Need a fresh take? Get an instant paraphrase of this document with our AI Paraphraser
Document Page
Graph: Sales by region and category
Document Page
Sales by region and category
Sales for the Central region have been gradually increasing from year
2013 to 2016.
2016 had the highest sales for each region respectively
Particularly, technology category of sales seems to be doing much
better compared to other categories
The south region is doing terribly in the aspect of all sales and on all
categories
Document Page
Sales by region and Subcategory
Subcategories within the office supply category seems to be making
the least sales in all regions In particular to envelopes, fasteners and
paper.
In the category with the highest sales, that is the technology
category, phones as a subcategory is making the highest sales within
each region.
Overall phones, copiers, storage and bookcases have the highest sales
tabler-icon-diamond-filled.svg

Paraphrase This Document

Need a fresh take? Get an instant paraphrase of this document with our AI Paraphraser
Document Page
Quarterly Trends
Document Page
Quarterly Trends in Sales
Demand for products start to decrease from the third quarter (Q3) of
every year.
Decrease in demand has ultimately led to decline in the total sales as
well as the total profit
Document Page
Gross profit by product category
In year 2016 and 2015 respectively, copiers and book cases made the
most profit superseding phones and appliances that had made the
most profit in the preceding years.
Overall, supplies have continued to increase their loses year after
year with a slight improvement in year 2016
tabler-icon-diamond-filled.svg

Paraphrase This Document

Need a fresh take? Get an instant paraphrase of this document with our AI Paraphraser
Document Page
Gross profit by product category
Document Page
Comparison of Positive gross profits
Profits appear to be positively correlated to both sales and quantity
(see slide 5).
for all product categories, there is an overall yearly increasing trend
although quarter data represents otherwise
Document Page
Trends in regional sales
(Frequency: Quarterly data)
Although most regions have declining sales in Q3 of every year,
central regions seems to be fairing quiet well in comparison
The declining total regional sales in mostly caused by great declines in
Q4 for the north region.
Particularly the supplies category
tabler-icon-diamond-filled.svg

Paraphrase This Document

Need a fresh take? Get an instant paraphrase of this document with our AI Paraphraser
Document Page
Negative profit comparison
(By Region)
Document Page
Negative profit comparison
Negative profits are concentrated in the central and northern regions.
Sweden and Netherlands made the most loses of -13808 and -10364
respectively.
Southern regions made least loses of less than -1000
chevron_up_icon
1 out of 13
circle_padding
hide_on_mobile
zoom_out_icon
[object Object]