Regression Analysis and Interpretation: Statistical Analysis Report

Verified

Added on  2022/09/18

|6
|896
|15
Homework Assignment
AI Summary
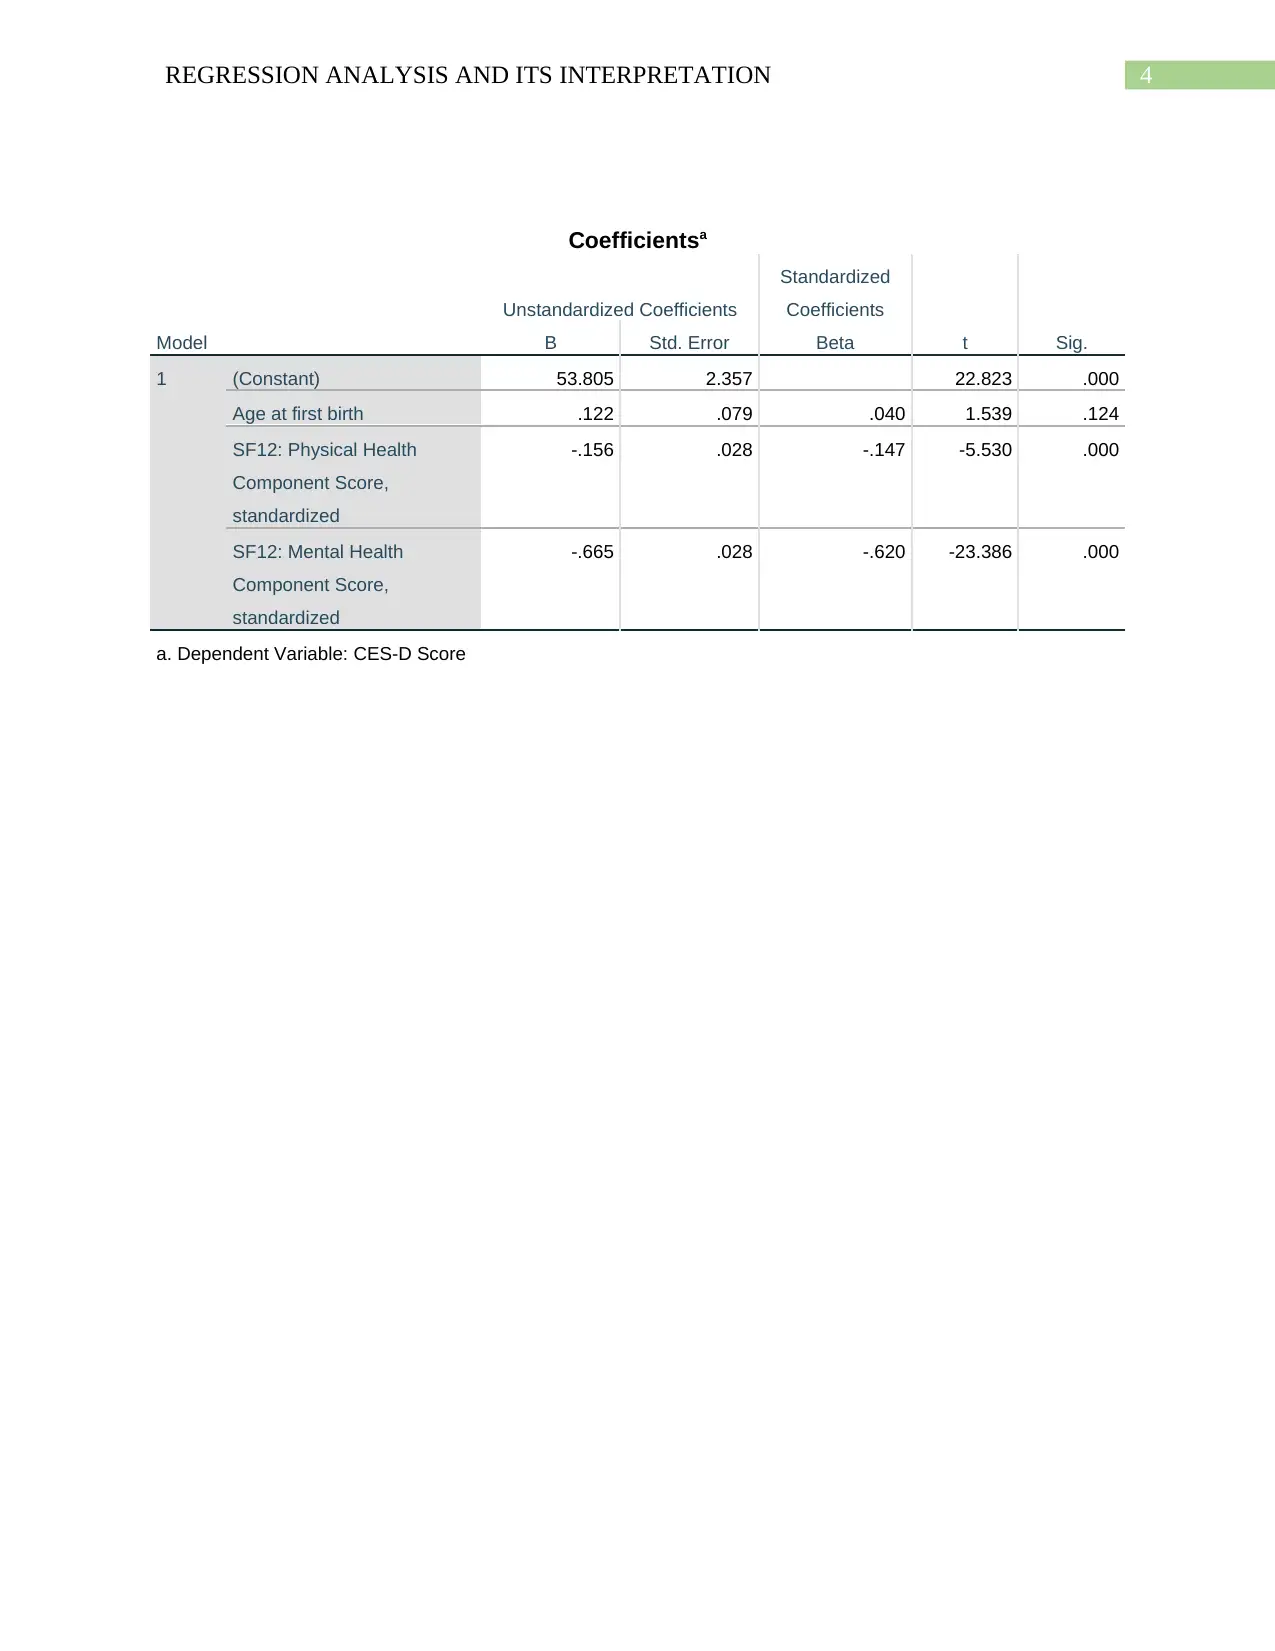
This assignment delves into regression analysis and its interpretation, focusing on the analysis of a dataset related to mental health and depression. The student analyzes the correlation between variables like age at first birth, physical health score, mental health score, and CESD score using a correlation matrix. The assignment includes the calculation and interpretation of R-squared, ANOVA, and regression coefficients. The student performs a regression analysis, assessing the significance of independent variables in predicting the CESD score, and discusses the implications of the model's fit, including the impact of physical and mental health scores on depression. The document also includes a discussion of multicollinearity and provides a regression equation for predicting CESD scores based on the independent variables. The student uses SPSS to perform the analysis, and the assignment concludes with cited references.
tabler-icon-diamond-filled.svg

Contribute Materials

Your contribution can guide someone’s learning journey. Share your documents today.
Document Page
Running Head: REGRESSION ANALYSIS AND ITS INTERPRETATION
REGRESSION ANALYSIS AND ITS INTERPRETATION
Name of the Student:
Name of the University:
Author Note:
tabler-icon-diamond-filled.svg

Secure Best Marks with AI Grader

Need help grading? Try our AI Grader for instant feedback on your assignments.
Document Page
1REGRESSION ANALYSIS AND ITS INTERPRETATION
Answer A
The lowest value of R square is 0.362 =0.1296. This indicates that 12.96% variability in
DVAR can be explained by the independent variable VARB.
Answer B
From the correlation matrix it can be observed that the variables VARA, VARB and
VARC are correlated with each other. If these variables are taken as independent variables to
predict DVAR then problem of multicollinearity will arise (Heumann and Schomaker 2016).
Here VARA and VARC has highest inter-correlation 0.86. Hence this set of independent
variables should not be used to regress DVAR.
Answer C
a. Table 1: Correlation Matrix
AGE PHYSICAL MENTAL CESD
AGE 1.00
PHYSICAL -0.03 1.00
MENTAL -0.02 0.17 1.00
CESD 0.05 -0.26 -0.65 1.00
b. Mental health has the highest correlation with cesd score (-0.65).
c.
Document Page
2REGRESSION ANALYSIS AND ITS INTERPRETATION
Correlations
Age at
first
birth
CES-D
Score
SF12: Physical Health
Component Score,
standardized
SF12: Mental Health
Component Score,
standardized
Age at first birth Pearson
Correlation
1 .045 -.033 -.020
Sig. (2-tailed) .182 .339 .558
N 929 897 834 834
CES-D Score Pearson
Correlation
.045 1 -.264** -.651**
Sig. (2-tailed) .182 .000 .000
N 897 962 884 884
SF12: Physical Health
Component Score,
standardized
Pearson
Correlation
-.033 -.264** 1 .168**
Sig. (2-tailed) .339 .000 .000
N 834 884 893 893
SF12: Mental Health
Component Score,
standardized
Pearson
Correlation
-.020 -.651** .168** 1
Sig. (2-tailed) .558 .000 .000
N 834 884 893 893
**. Correlation is significant at the 0.01 level (2-tailed).
Answer D
a. The regression analysis was performed on 826 observations.
b. The value of the R square is 0.440. It means that 44% variability in CESD score can be
explained by the independent variables Age at first month, Physical Heath score and
Mental Health score (McCormick and Salcedo 2017). The value of R square is low which
indicates a poor fit.
c. The value of adjusted R square is 0.438.
d. The value of the F statistic is 215.268 with p-value=0.000. The p-level for this regression
is taken as 0.05. Hence the null hypothesis is rejected (Denis 2018).
Document Page
3REGRESSION ANALYSIS AND ITS INTERPRETATION
e. The df of the regression is 3.
f. The variables Physical Health component score and Mental Health component score are
significant at 5% level (Stehlik-Barry and Babinec 2017).
g. The regression equation can be given as,
cesd score=58.805+ 0 .122 Age at first month0.156 Physical health score0.665 Mental health score
The equation shows that the cesd score is constant equal to 58.805 when effect of
the predictors are not considered (Khuri 2013). As the age increases the cesd score also
increases. However if physical health score or mental health score increases then the
depression score decreases. The R square of the model is 0.44 which shows that the fit is
not so good (Reid 2013). The variables Physical health and mental health scores are
significant at 5% level. This implies that change in any of these scores have significant
impact on the depression score.
h.
Model Summary
Model R R Square
Adjusted R
Square
Std. Error of the
Estimate
1 .663a .440 .438 8.57499
a. Predictors: (Constant), SF12: Mental Health Component Score,
standardized, Age at first birth, SF12: Physical Health Component
Score, standardized
ANOVAa
Model Sum of Squares df Mean Square F Sig.
1 Regression 47486.295 3 15828.765 215.268 .000b
Residual 60442.032 822 73.530
Total 107928.327 825
a. Dependent Variable: CES-D Score
b. Predictors: (Constant), SF12: Mental Health Component Score, standardized, Age at first birth,
SF12: Physical Health Component Score, standardized
tabler-icon-diamond-filled.svg

Secure Best Marks with AI Grader

Need help grading? Try our AI Grader for instant feedback on your assignments.
Document Page
4REGRESSION ANALYSIS AND ITS INTERPRETATION
Coefficientsa
Model
Unstandardized Coefficients
Standardized
Coefficients
t Sig.B Std. Error Beta
1 (Constant) 53.805 2.357 22.823 .000
Age at first birth .122 .079 .040 1.539 .124
SF12: Physical Health
Component Score,
standardized
-.156 .028 -.147 -5.530 .000
SF12: Mental Health
Component Score,
standardized
-.665 .028 -.620 -23.386 .000
a. Dependent Variable: CES-D Score
Document Page
5REGRESSION ANALYSIS AND ITS INTERPRETATION
References
Denis, D.J., 2018. SPSS data analysis for univariate, bivariate, and multivariate statistics. John
Wiley & Sons.
Heumann, C. and Schomaker, M., 2016. Introduction to statistics and data analysis. Springer
International Publishing Switzerland.
Khuri, A.I., 2013. Introduction to Linear Regression Analysis, by Douglas C. Montgomery,
Elizabeth A. Peck, G. Geoffrey Vining. International Statistical Review, 81(2), pp.318-319.
McCormick, K. and Salcedo, J., 2017. SPSS statistics for data analysis and visualization. John
Wiley & Sons.
Reid, H.M., 2013. Introduction to statistics: fundamental concepts and procedures of data
analysis. Sage Publications.
Stehlik-Barry, K. and Babinec, A.J., 2017. Data analysis with IBM SPSS statistics. Packt
Publishing Ltd.
chevron_up_icon
1 out of 6
circle_padding
hide_on_mobile
zoom_out_icon
logo.png

Your All-in-One AI-Powered Toolkit for Academic Success.

Available 24*7 on WhatsApp / Email

[object Object]