Applied Mathematics: Regression Analysis for Tire Purchase Prediction

Verified

Added on  2023/05/28

|6
|542
|138
Homework Assignment
AI Summary
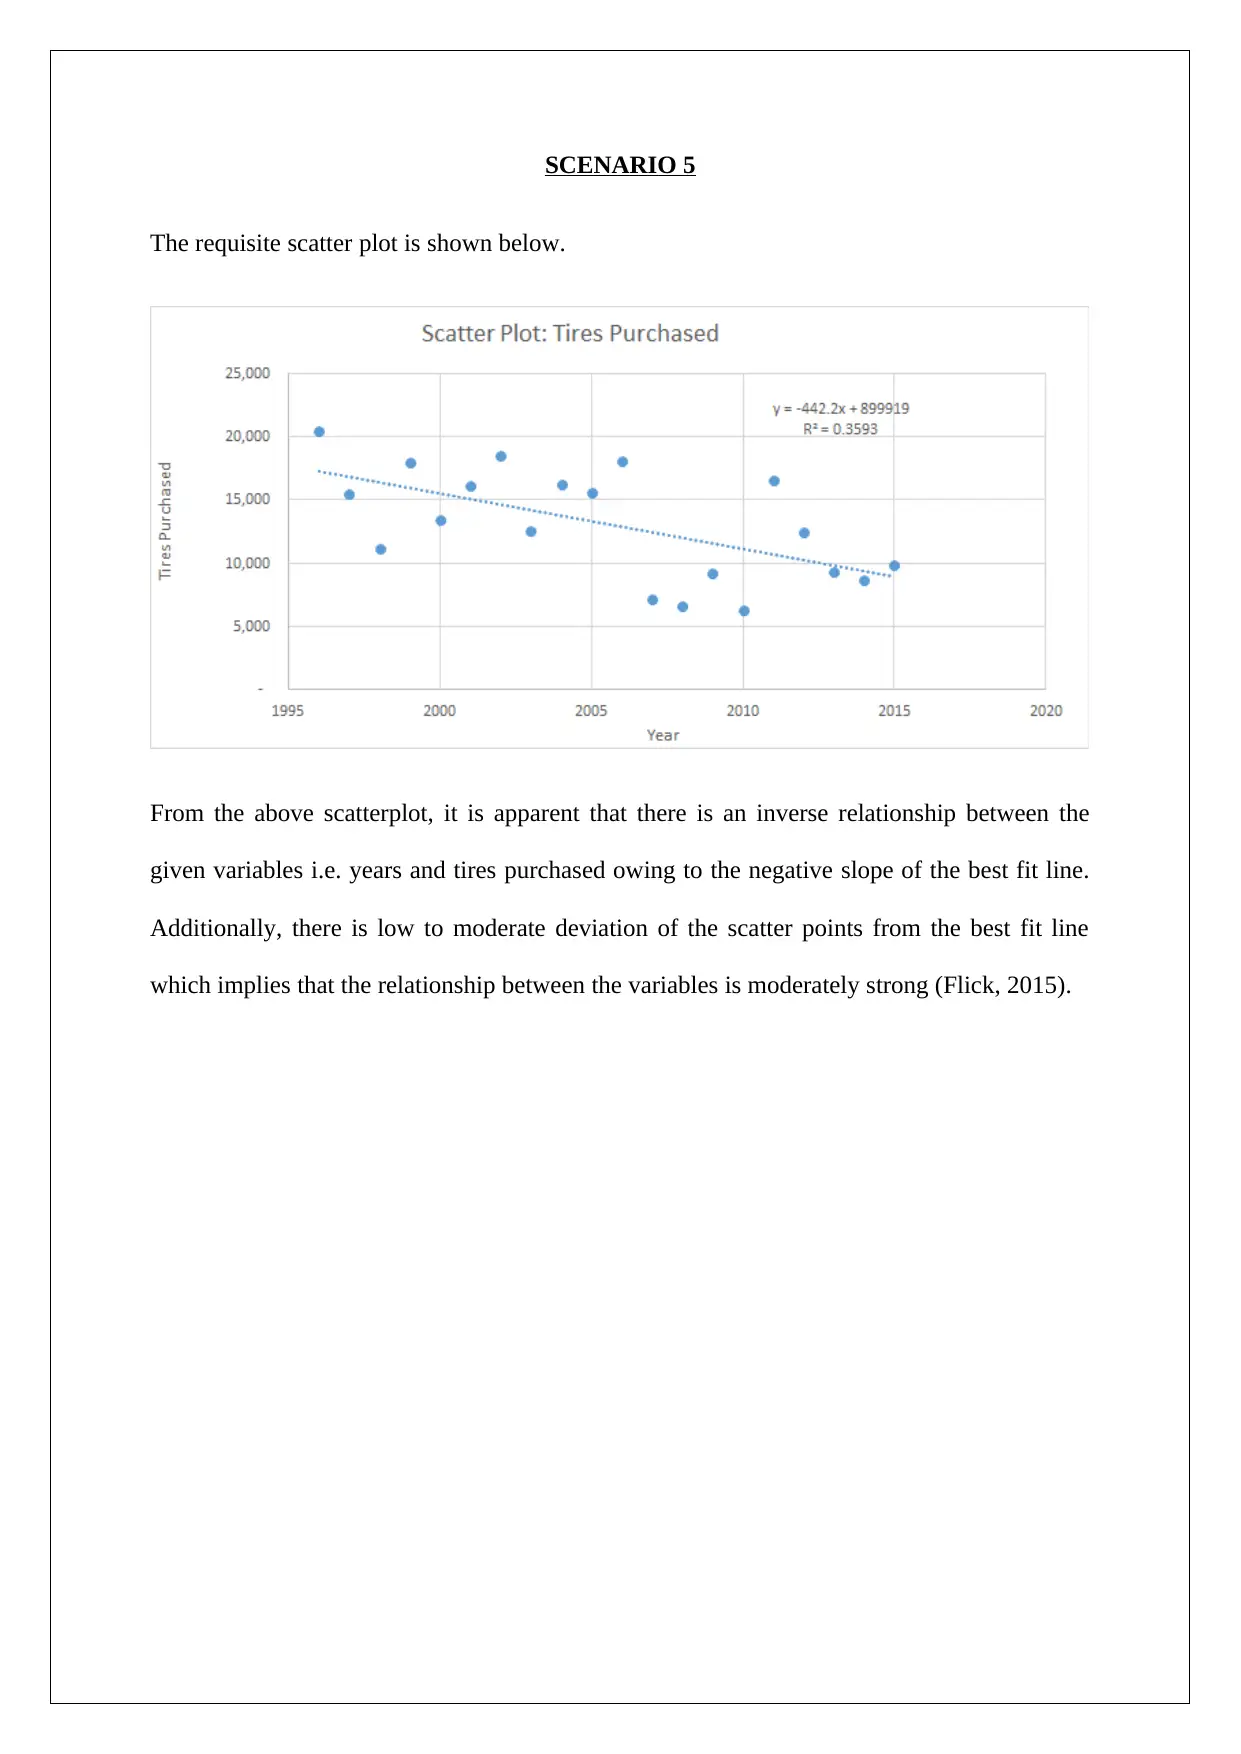
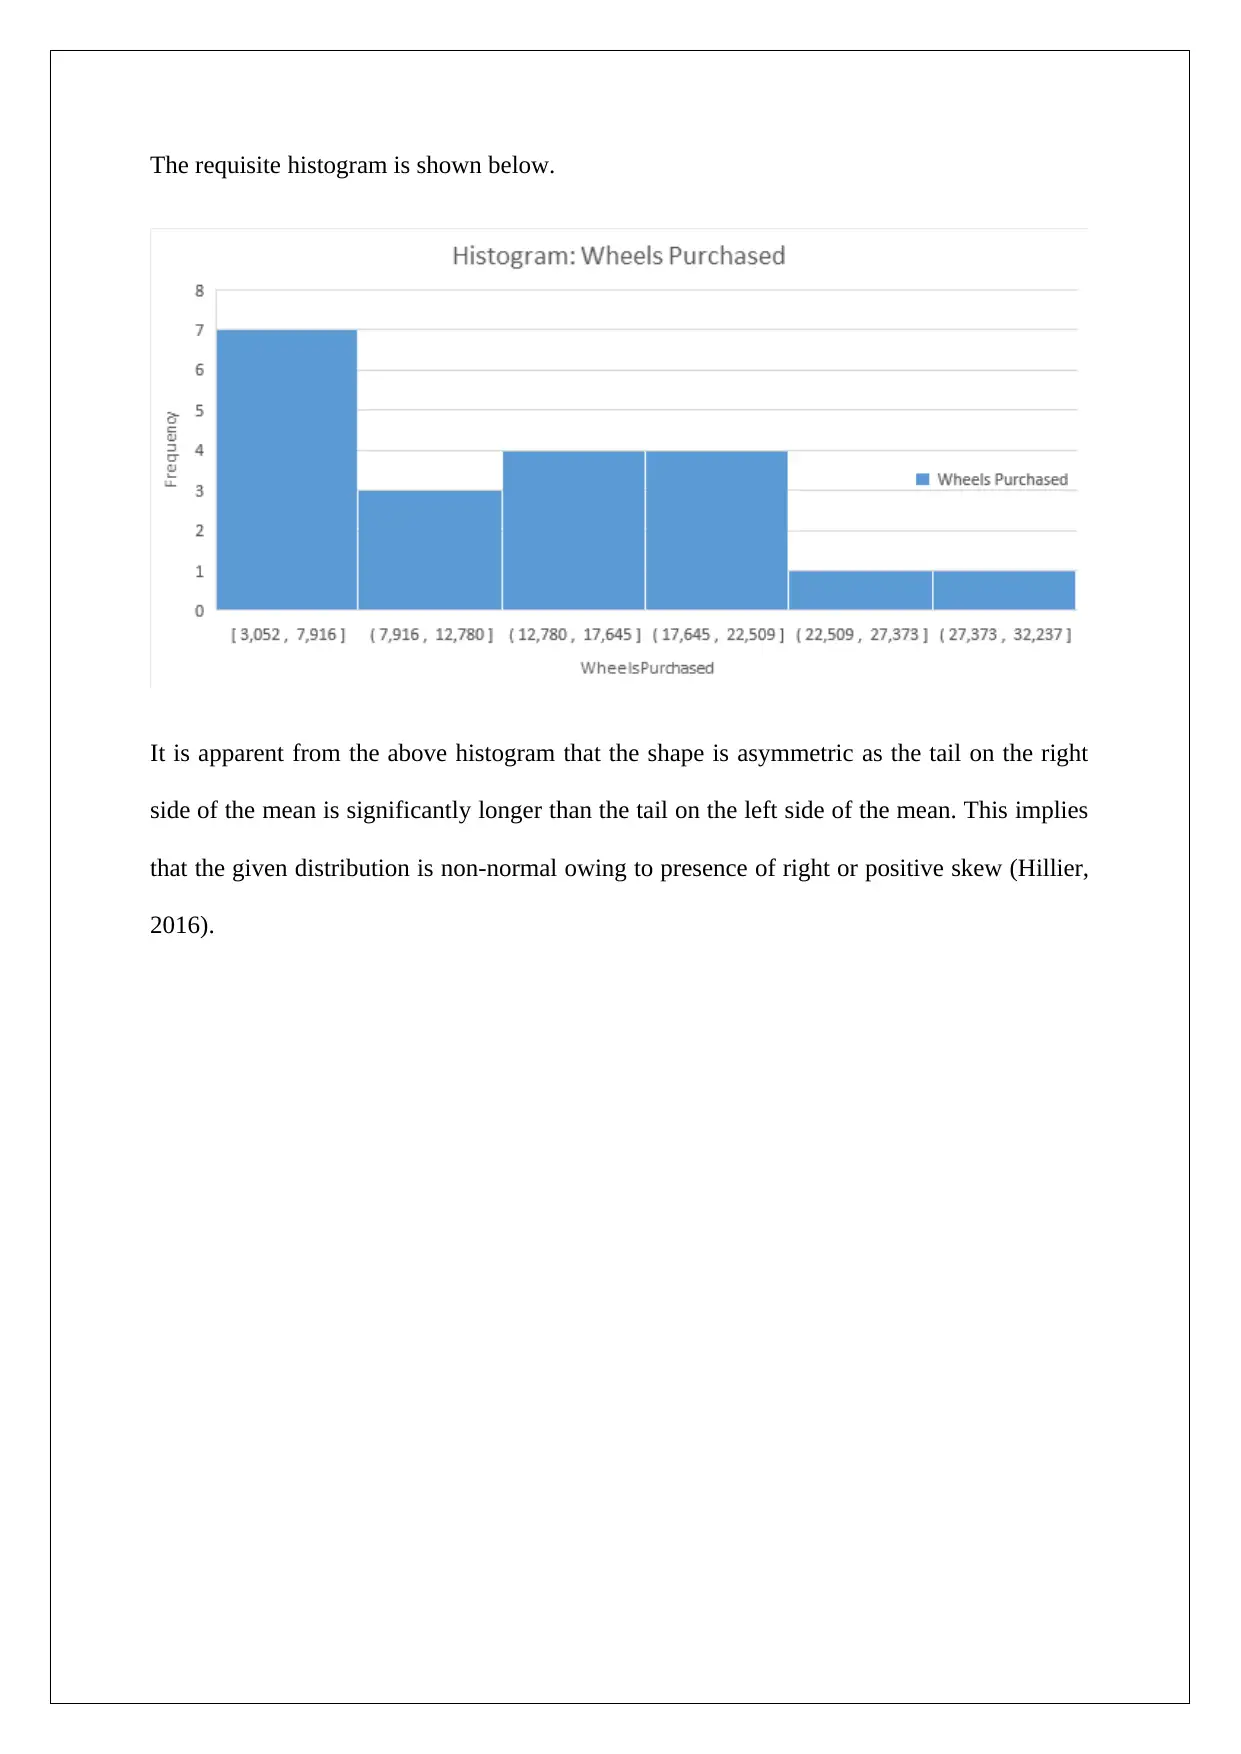
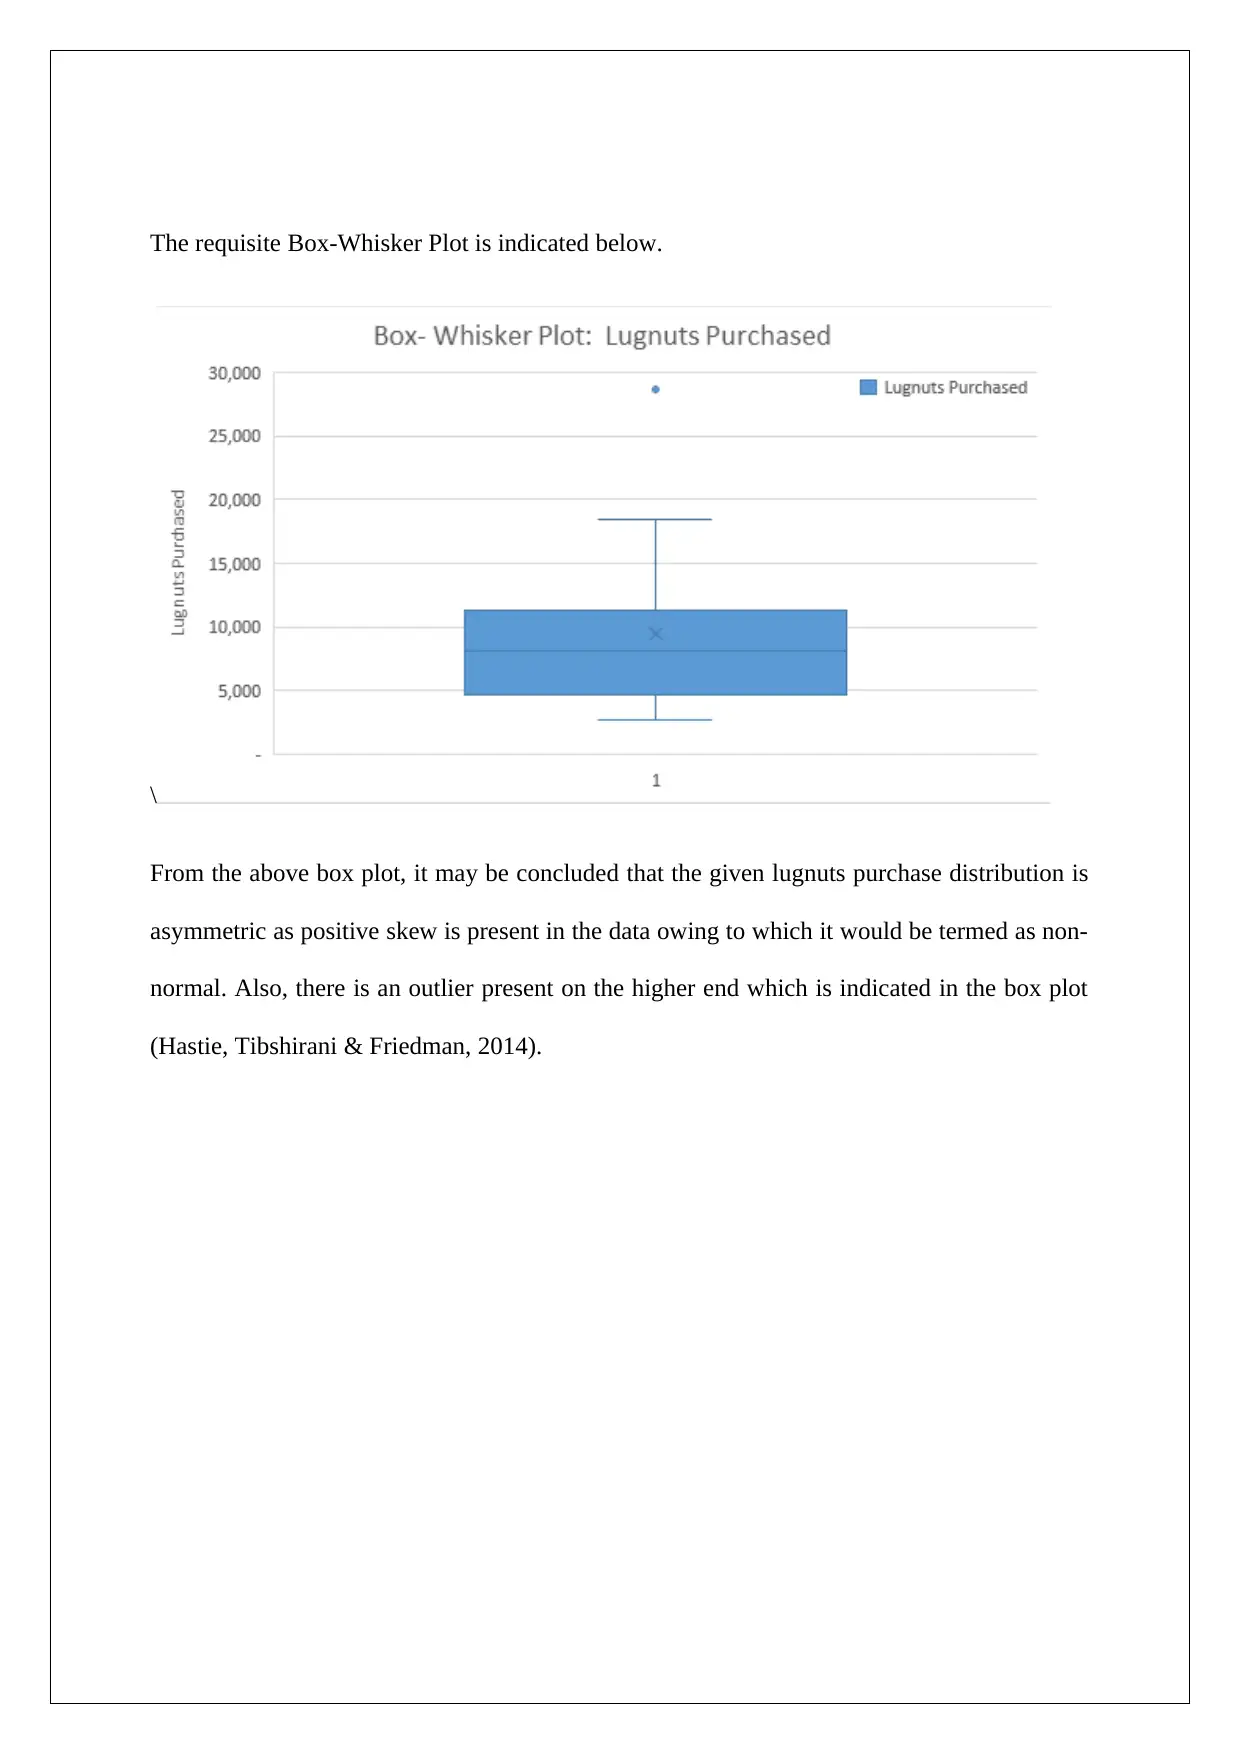
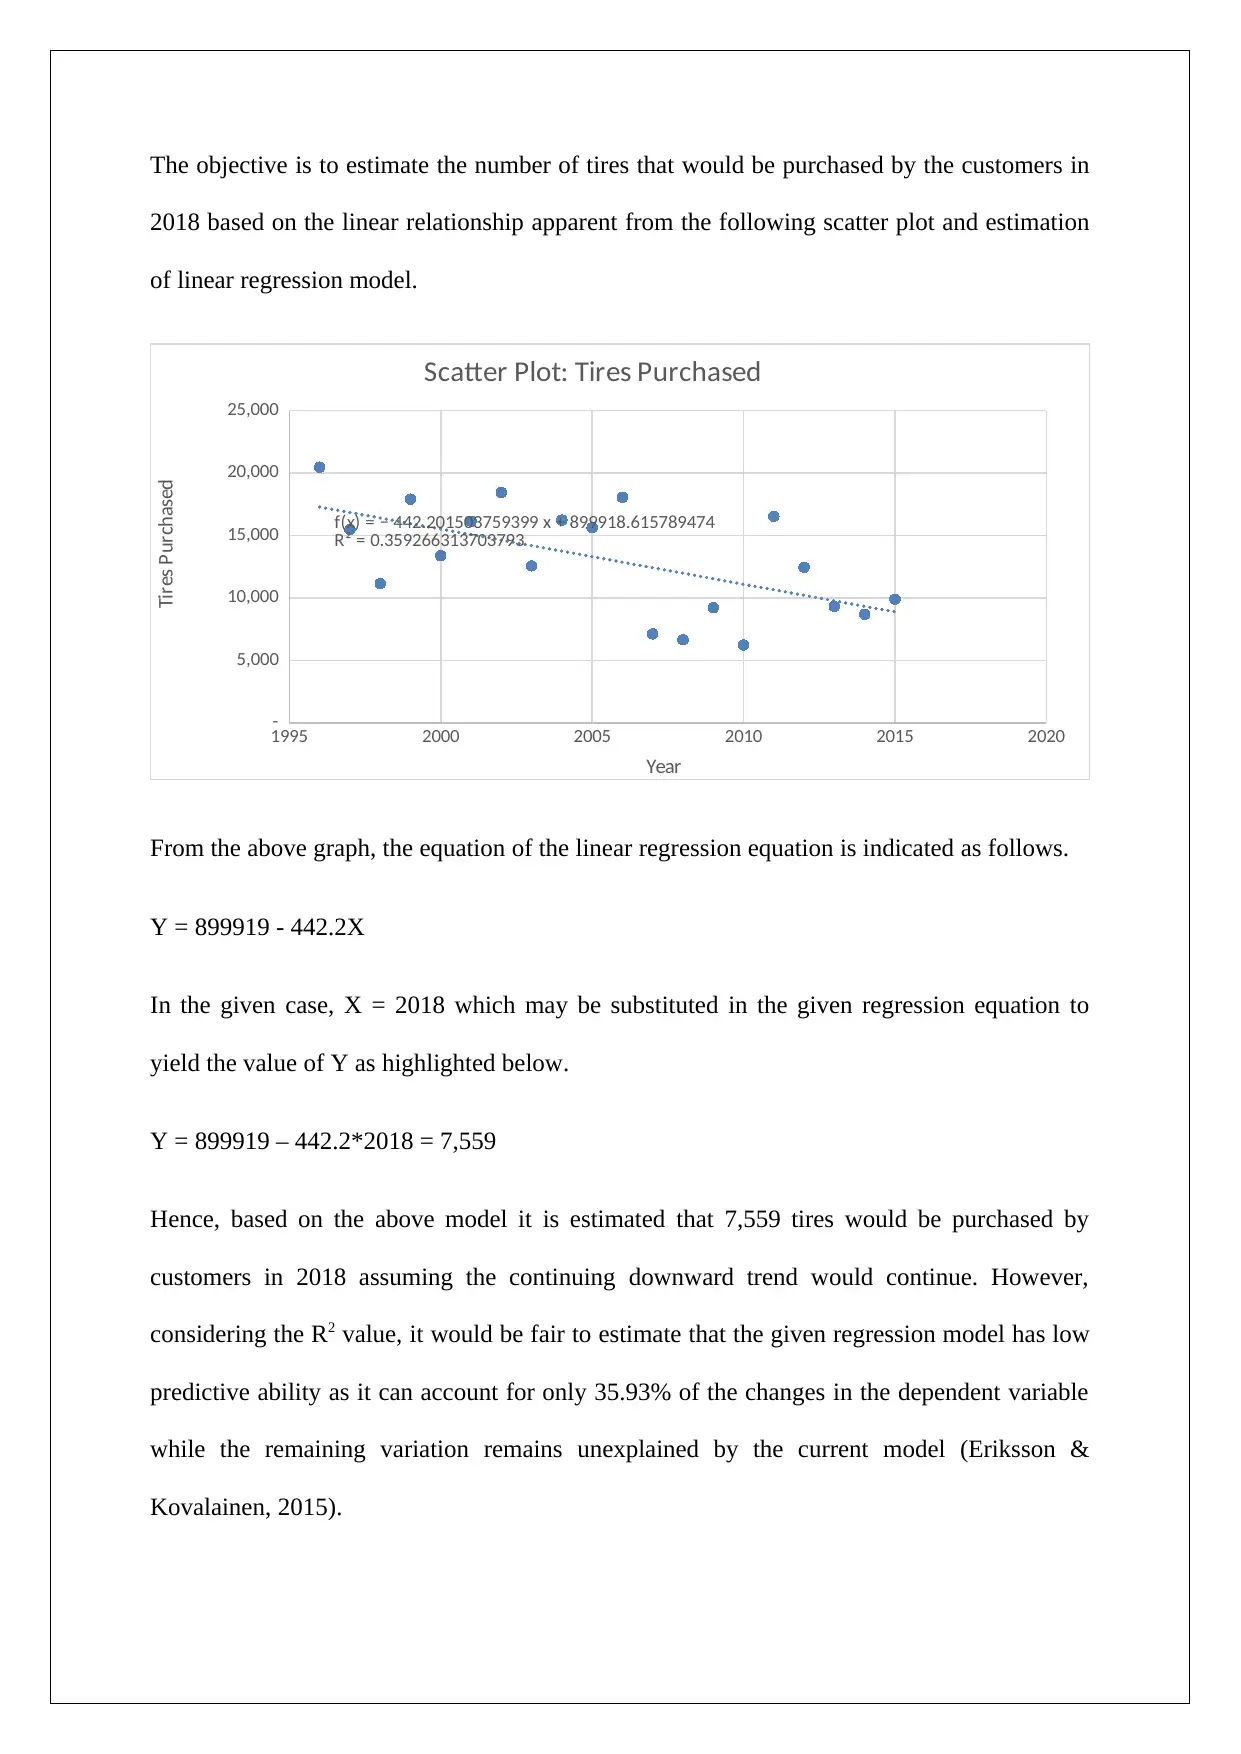
This assignment focuses on applying statistical methods to analyze the relationship between years and tire purchases. It includes the creation and interpretation of a scatter plot, histogram, and box-whisker plot to assess the distribution and relationship between the variables. The analysis reveals an inverse relationship and a non-normal distribution with positive skew. A linear regression model is developed to predict tire purchases in 2018, estimating approximately 7,559 tires. However, the assignment acknowledges the model's limitations due to a relatively low R-squared value, indicating that the model only explains a portion of the variance in tire purchases. The solution provides a comprehensive overview of the statistical techniques used and their implications for predicting future trends.
Document Page
APPLIED MATHEMATICS
STUDENT ID:
[Pick the date]
tabler-icon-diamond-filled.svg

Paraphrase This Document

Need a fresh take? Get an instant paraphrase of this document with our AI Paraphraser
Document Page
SCENARIO 5
The requisite scatter plot is shown below.
From the above scatterplot, it is apparent that there is an inverse relationship between the
given variables i.e. years and tires purchased owing to the negative slope of the best fit line.
Additionally, there is low to moderate deviation of the scatter points from the best fit line
which implies that the relationship between the variables is moderately strong (Flick, 2015).
Document Page
The requisite histogram is shown below.
It is apparent from the above histogram that the shape is asymmetric as the tail on the right
side of the mean is significantly longer than the tail on the left side of the mean. This implies
that the given distribution is non-normal owing to presence of right or positive skew (Hillier,
2016).
Document Page
The requisite Box-Whisker Plot is indicated below.
\
From the above box plot, it may be concluded that the given lugnuts purchase distribution is
asymmetric as positive skew is present in the data owing to which it would be termed as non-
normal. Also, there is an outlier present on the higher end which is indicated in the box plot
(Hastie, Tibshirani & Friedman, 2014).
tabler-icon-diamond-filled.svg

Paraphrase This Document

Need a fresh take? Get an instant paraphrase of this document with our AI Paraphraser
Document Page
The objective is to estimate the number of tires that would be purchased by the customers in
2018 based on the linear relationship apparent from the following scatter plot and estimation
of linear regression model.
1995 2000 2005 2010 2015 2020
-
5,000
10,000
15,000
20,000
25,000
f(x) = − 442.201503759399 x + 899918.615789474
R² = 0.359266313703793
Scatter Plot: Tires Purchased
Year
Tires Purchased
From the above graph, the equation of the linear regression equation is indicated as follows.
Y = 899919 - 442.2X
In the given case, X = 2018 which may be substituted in the given regression equation to
yield the value of Y as highlighted below.
Y = 899919 – 442.2*2018 = 7,559
Hence, based on the above model it is estimated that 7,559 tires would be purchased by
customers in 2018 assuming the continuing downward trend would continue. However,
considering the R2 value, it would be fair to estimate that the given regression model has low
predictive ability as it can account for only 35.93% of the changes in the dependent variable
while the remaining variation remains unexplained by the current model (Eriksson &
Kovalainen, 2015).
Document Page
References
Eriksson, P. & Kovalainen, A. (2015) Quantitative methods in business research. 3rd ed.
London: Sage Publications.
Flick, U. (2015) Introducing research methodology: A beginner's guide to doing a research
project. 4th ed. New York: Sage Publications.
Hastie, T., Tibshirani, R. & Friedman, J. (2014) The Elements of Statistical Learning. 4th
ed. New York: Springer Publications.
Hillier, F. (2016) Introduction to Operations Research. 6th ed. New York: McGraw Hill
Publications
chevron_up_icon
1 out of 6
circle_padding
hide_on_mobile
zoom_out_icon
[object Object]