Regression Analysis Report: Analyzing Economic Indicators and Trends

Verified

Added on  2021/04/21

|5
|606
|52
Report
AI Summary
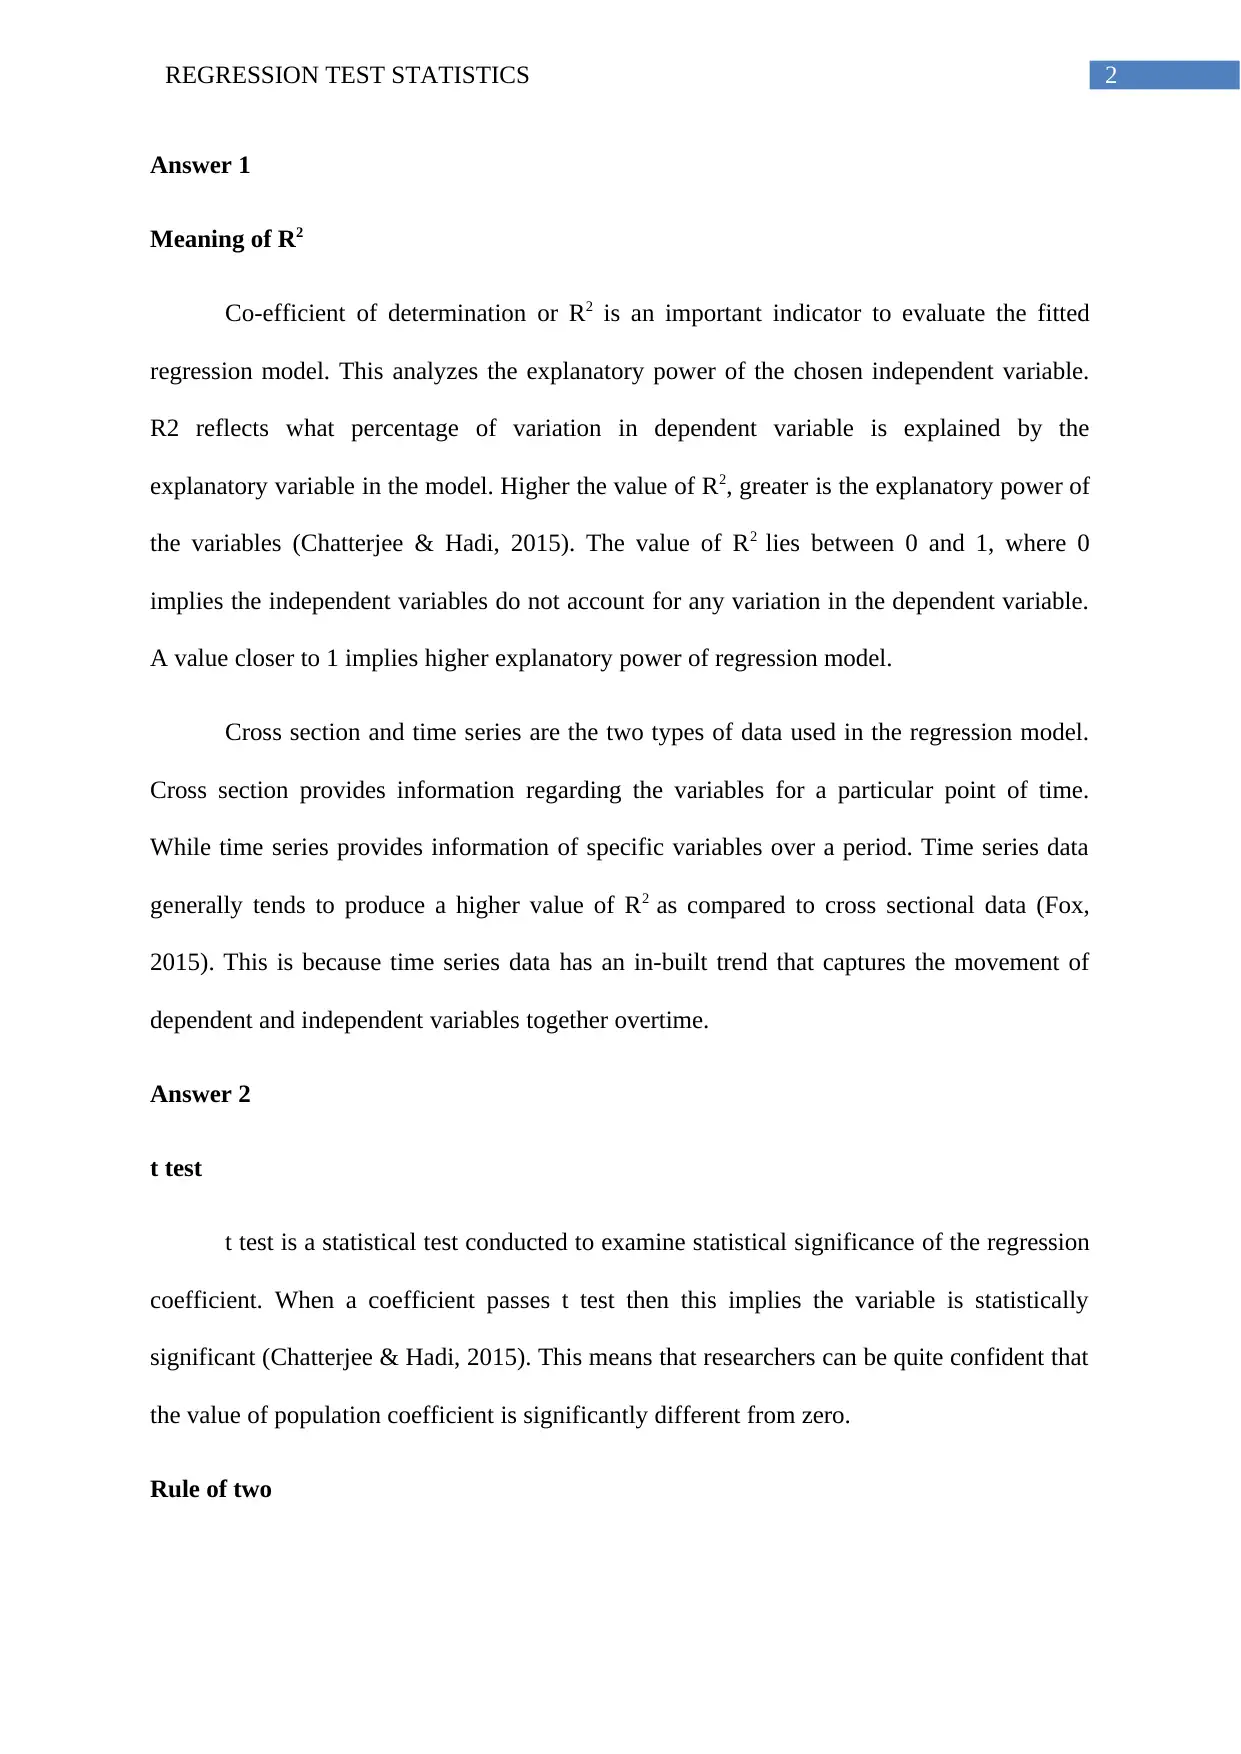
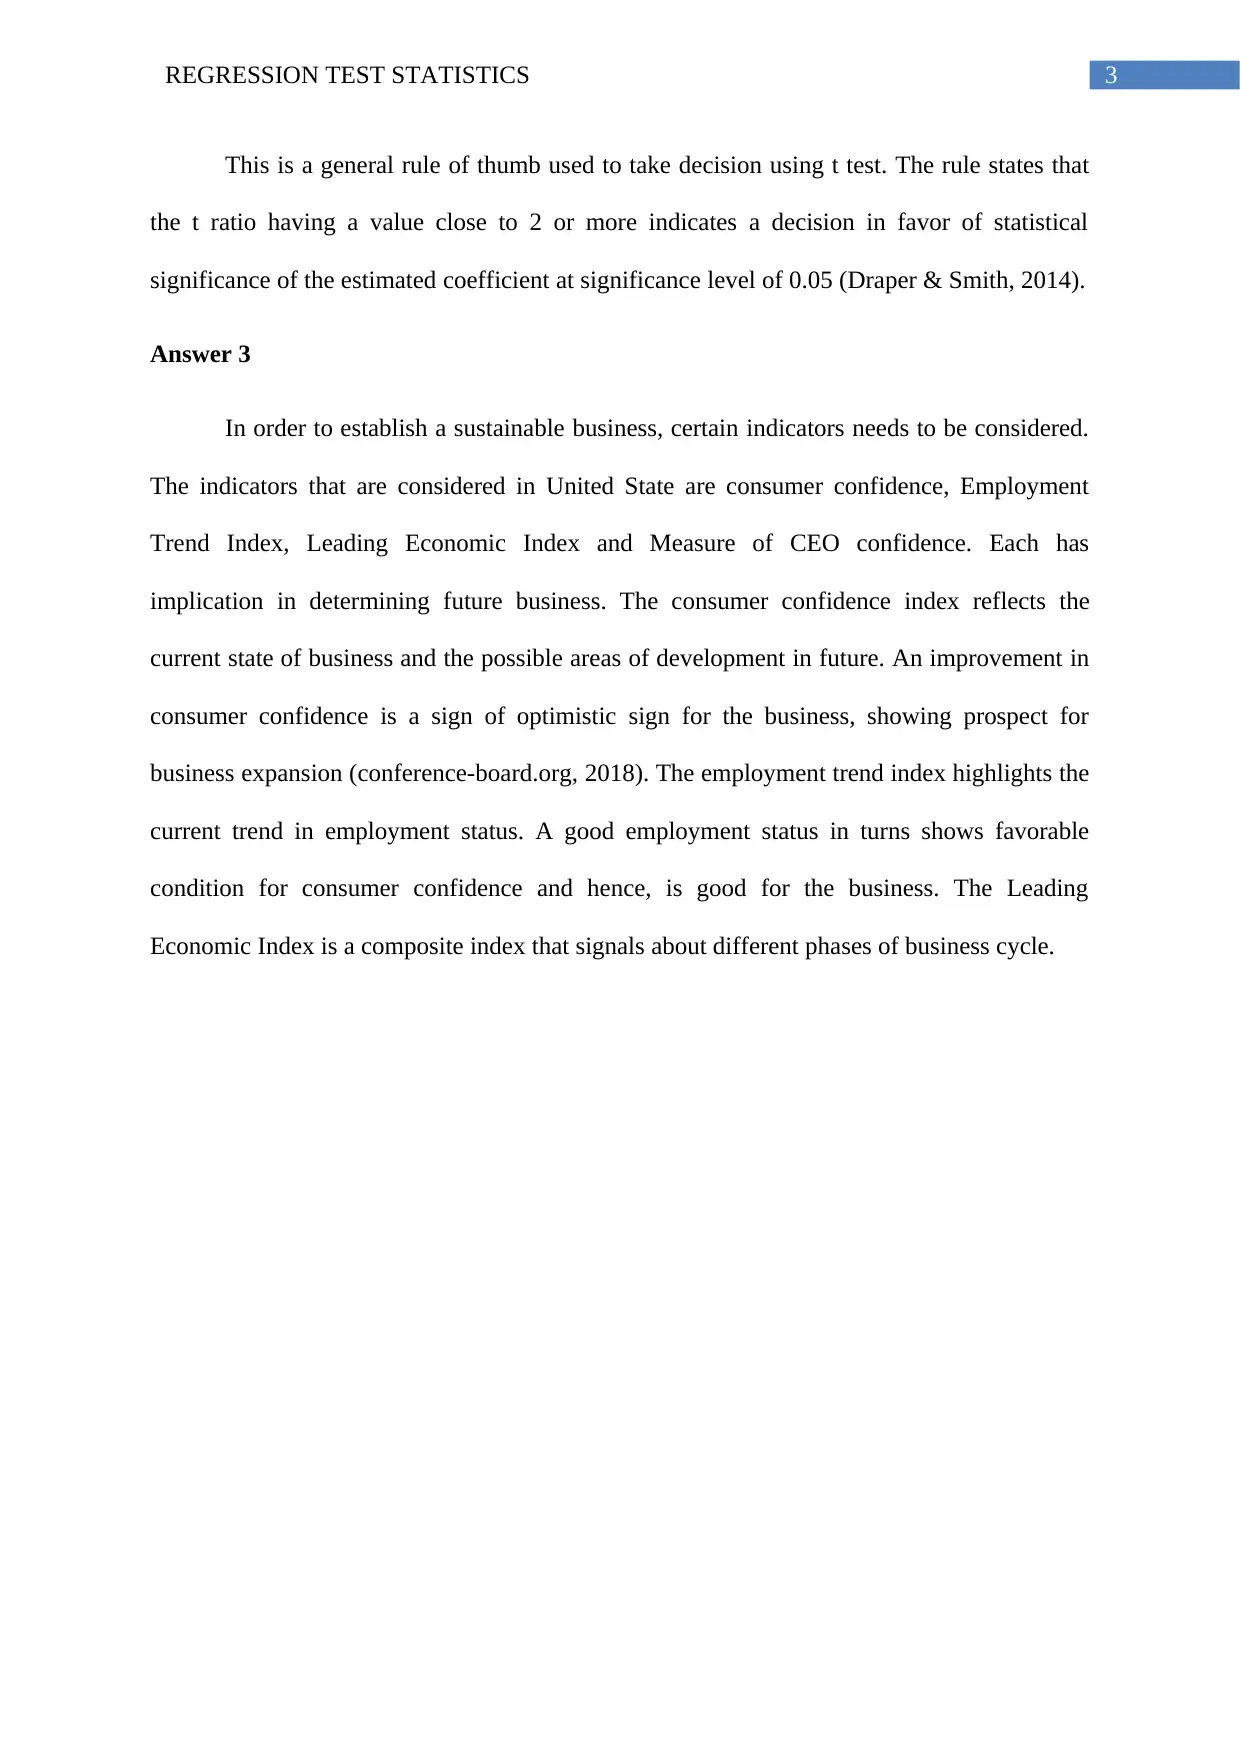
This report provides an overview of regression analysis and its application to economic indicators. It begins by explaining the concept of R2, its significance in evaluating the explanatory power of a regression model, and the differences between cross-sectional and time-series data. The report then discusses the t-test, its role in determining the statistical significance of regression coefficients, and the "rule of two" as a practical guide. Furthermore, the report highlights key economic indicators, including consumer confidence, employment trends, and the leading economic index, and their importance in understanding and predicting business trends. The report emphasizes how these indicators collectively contribute to a broader understanding of economic conditions and business prospects, making it a valuable resource for students studying economics and related fields.
Document Page
Running Head: REGRESSION TEST STATISTICS
Regression Test Statistics
Name of the Student
Name of the University
Author note
tabler-icon-diamond-filled.svg

Paraphrase This Document

Need a fresh take? Get an instant paraphrase of this document with our AI Paraphraser
Document Page
1REGRESSION TEST STATISTICS
Table of Contents
Answer 1....................................................................................................................................2
Meaning of R2........................................................................................................................2
Answer 2....................................................................................................................................2
t test........................................................................................................................................2
Rule of two.............................................................................................................................2
Answer 3....................................................................................................................................3
References..................................................................................................................................4
Document Page
2REGRESSION TEST STATISTICS
Answer 1
Meaning of R2
Co-efficient of determination or R2 is an important indicator to evaluate the fitted
regression model. This analyzes the explanatory power of the chosen independent variable.
R2 reflects what percentage of variation in dependent variable is explained by the
explanatory variable in the model. Higher the value of R2, greater is the explanatory power of
the variables (Chatterjee & Hadi, 2015). The value of R2 lies between 0 and 1, where 0
implies the independent variables do not account for any variation in the dependent variable.
A value closer to 1 implies higher explanatory power of regression model.
Cross section and time series are the two types of data used in the regression model.
Cross section provides information regarding the variables for a particular point of time.
While time series provides information of specific variables over a period. Time series data
generally tends to produce a higher value of R2 as compared to cross sectional data (Fox,
2015). This is because time series data has an in-built trend that captures the movement of
dependent and independent variables together overtime.
Answer 2
t test
t test is a statistical test conducted to examine statistical significance of the regression
coefficient. When a coefficient passes t test then this implies the variable is statistically
significant (Chatterjee & Hadi, 2015). This means that researchers can be quite confident that
the value of population coefficient is significantly different from zero.
Rule of two
Document Page
3REGRESSION TEST STATISTICS
This is a general rule of thumb used to take decision using t test. The rule states that
the t ratio having a value close to 2 or more indicates a decision in favor of statistical
significance of the estimated coefficient at significance level of 0.05 (Draper & Smith, 2014).
Answer 3
In order to establish a sustainable business, certain indicators needs to be considered.
The indicators that are considered in United State are consumer confidence, Employment
Trend Index, Leading Economic Index and Measure of CEO confidence. Each has
implication in determining future business. The consumer confidence index reflects the
current state of business and the possible areas of development in future. An improvement in
consumer confidence is a sign of optimistic sign for the business, showing prospect for
business expansion (conference-board.org, 2018). The employment trend index highlights the
current trend in employment status. A good employment status in turns shows favorable
condition for consumer confidence and hence, is good for the business. The Leading
Economic Index is a composite index that signals about different phases of business cycle.
tabler-icon-diamond-filled.svg

Paraphrase This Document

Need a fresh take? Get an instant paraphrase of this document with our AI Paraphraser
Document Page
4REGRESSION TEST STATISTICS
References
Chatterjee, S., & Hadi, A. S. (2015). Regression analysis by example. John Wiley & Sons.
conference-board.org. (2018). Conference-board.org. Retrieved 23 March 2018, from
https://www.conference-board.org/data/
Draper, N. R., & Smith, H. (2014). Applied regression analysis(Vol. 326). John Wiley &
Sons.
Fox, J. (2015). Applied regression analysis and generalized linear models. Sage Publications.
chevron_up_icon
1 out of 5
circle_padding
hide_on_mobile
zoom_out_icon
[object Object]