Regression Analysis: Retention Rate and Graduation Rate in US Colleges
VerifiedAdded on 2023/04/20
|13
|2683
|367
Report
AI Summary
This report investigates the impact of retention rates (RR) on graduation rates (GR) across 29 accredited online colleges in the United States, driven by increasing accountability for programmatic outcomes. A simple linear regression analysis, conducted at a 5% significance level, reveals RR as a statistically significant predictor of GR (t = 4.69, p < 0.05). The analysis indicates a moderate, positive correlation, with the regression equation GR % = 0.284 RR % + 25.42 suggesting that a 1% increase in retention rate corresponds to an approximate 0.28% increase in graduation rate. While the model explains 44.92% of the variability in graduation percentage, it also highlights discrepancies when applied to individual institutions like South University and the University of Phoenix. The report concludes with recommendations for future research, emphasizing qualitative studies, program-specific analyses, and the inclusion of demographic and economic factors to refine graduation rate estimations.

Impact of Retention on Successful completion of Graduation –
An estimation for US colleges
1
An estimation for US colleges
1
Paraphrase This Document
Need a fresh take? Get an instant paraphrase of this document with our AI Paraphraser
Abstract
The purpose of this study was to examine the impact of retention rate (RR) on the graduation
rate (GR) of 29 accredited online colleges in the United States. The scholar was interested in
this issue because educational institutions are more accountable to the programmatic results
of legislative organizations and the federal government, including modulation rates for
graduation programs. The study also conducted a common linear regression analysis with a
5% significance level in the empirical method and measured the effect of retention rates on
the percentage of successful completion of graduate education in the United States. RR (%) is
considered to be a statistically significant predictive variable (t = 4.69, p < 0.05) in order to
estimate the GR%.
2
Table of Contents
Abstract.................................................................................................................................................2
Purpose.................................................................................................................................................4
Background............................................................................................................................................4
Method..................................................................................................................................................5
Results...................................................................................................................................................5
Discussion..............................................................................................................................................7
Brief Overview...................................................................................................................................7
Strength & Limitations.......................................................................................................................8
Comparison with other studies.........................................................................................................8
Policy Implications.............................................................................................................................8
Recommendations.................................................................................................................................8
References.............................................................................................................................................9
Appendix.............................................................................................................................................10
3
⊘ This is a preview!⊘
Do you want full access?
Subscribe today to unlock all pages.
Trusted by 1+ million students worldwide
Purpose
The purpose of the researcher is to examine the influence of detention factors on the
graduation rate in 29 colleges in the United States, which were accredited as online colleges
or universities. Based on the retention percentage of students in the colleges, a quantitative
study has been carried out to analyse the results of the graduation percentage of the students.
A simple linear regression analysis was performed to test the impact of the retention rate of
the colleges on the graduation rate of the students.
Research question: To what extent do graduation rates vary by retention rates in the online
education providing colleges of the United States?
Background
One of the biggest problems in higher education is the recent development of online
universities. To give students more opportunities to meet market needs, agencies use online
orientation to a faster level of courses and courses. According to a recent survey, at least one
million students dropped out of attended online courses in 2016 (Blau et al., 2018, p.1).
Online registration increased by 12.9%, which is higher than the rate of increase for higher
education students by 1.2% (Allen, and Seaman, 2010, p.3-8). The accelerated growth of
online education is accompanied by quality issues in terms of results (Johnson et al., 2016,
p.1-50). Programme completion is the criteria for assessing the quality and effectiveness of
the programmes. Studies have shown that teaching is effective in an online environment that
is comparable to the traditional classroom environment (Brady, Holcomb, and Smith, 2010,
p.9), but studies and subjective evidence suggest that the rate of attrition in online courses is
high, often much higher than offline courses (Kizilcec, Piech, and Schneider, 2013, p.170-
179; Hew, 2016, p.320-341; Park and Choi, 2009, p.207-210; Rodriguez, 2012, p.2-5). Older
students are reported to have reduced retention rates compared to traditional aged campus
students, and this has special implication on distance learning programs since these courses
are primarily for adult students.
Economists are interested in this particular issue as the education institutions are more
accountable to the legislative organizations and the federal Government for the programme
outcomes that include a completion rate in graduation programme. To ensure funding,
4
Paraphrase This Document
Need a fresh take? Get an instant paraphrase of this document with our AI Paraphraser
institutions must report high retention rates. The colleges and universities are found to
continue to have confidence in distance learning as an essential mode for its long-term
strategy and survival (Allen, and Seaman, 2010, p.3-8).
Method
The graduation record rate was considered as the outcome variable, and the retention rate for
the selected colleges/ universities was considered as the predictor. The descriptive statistics
were used to evaluate the properties of these two variables. The linear association between
the variables was first evaluated through scatter diagram plotting. In this study the researcher
also performed an ordinary linear regression analysis at 5% level of significance as an
empirical approach and measured the effect of the retention rate in the percentage of
successful completion of the degree programs in the United States.
Results
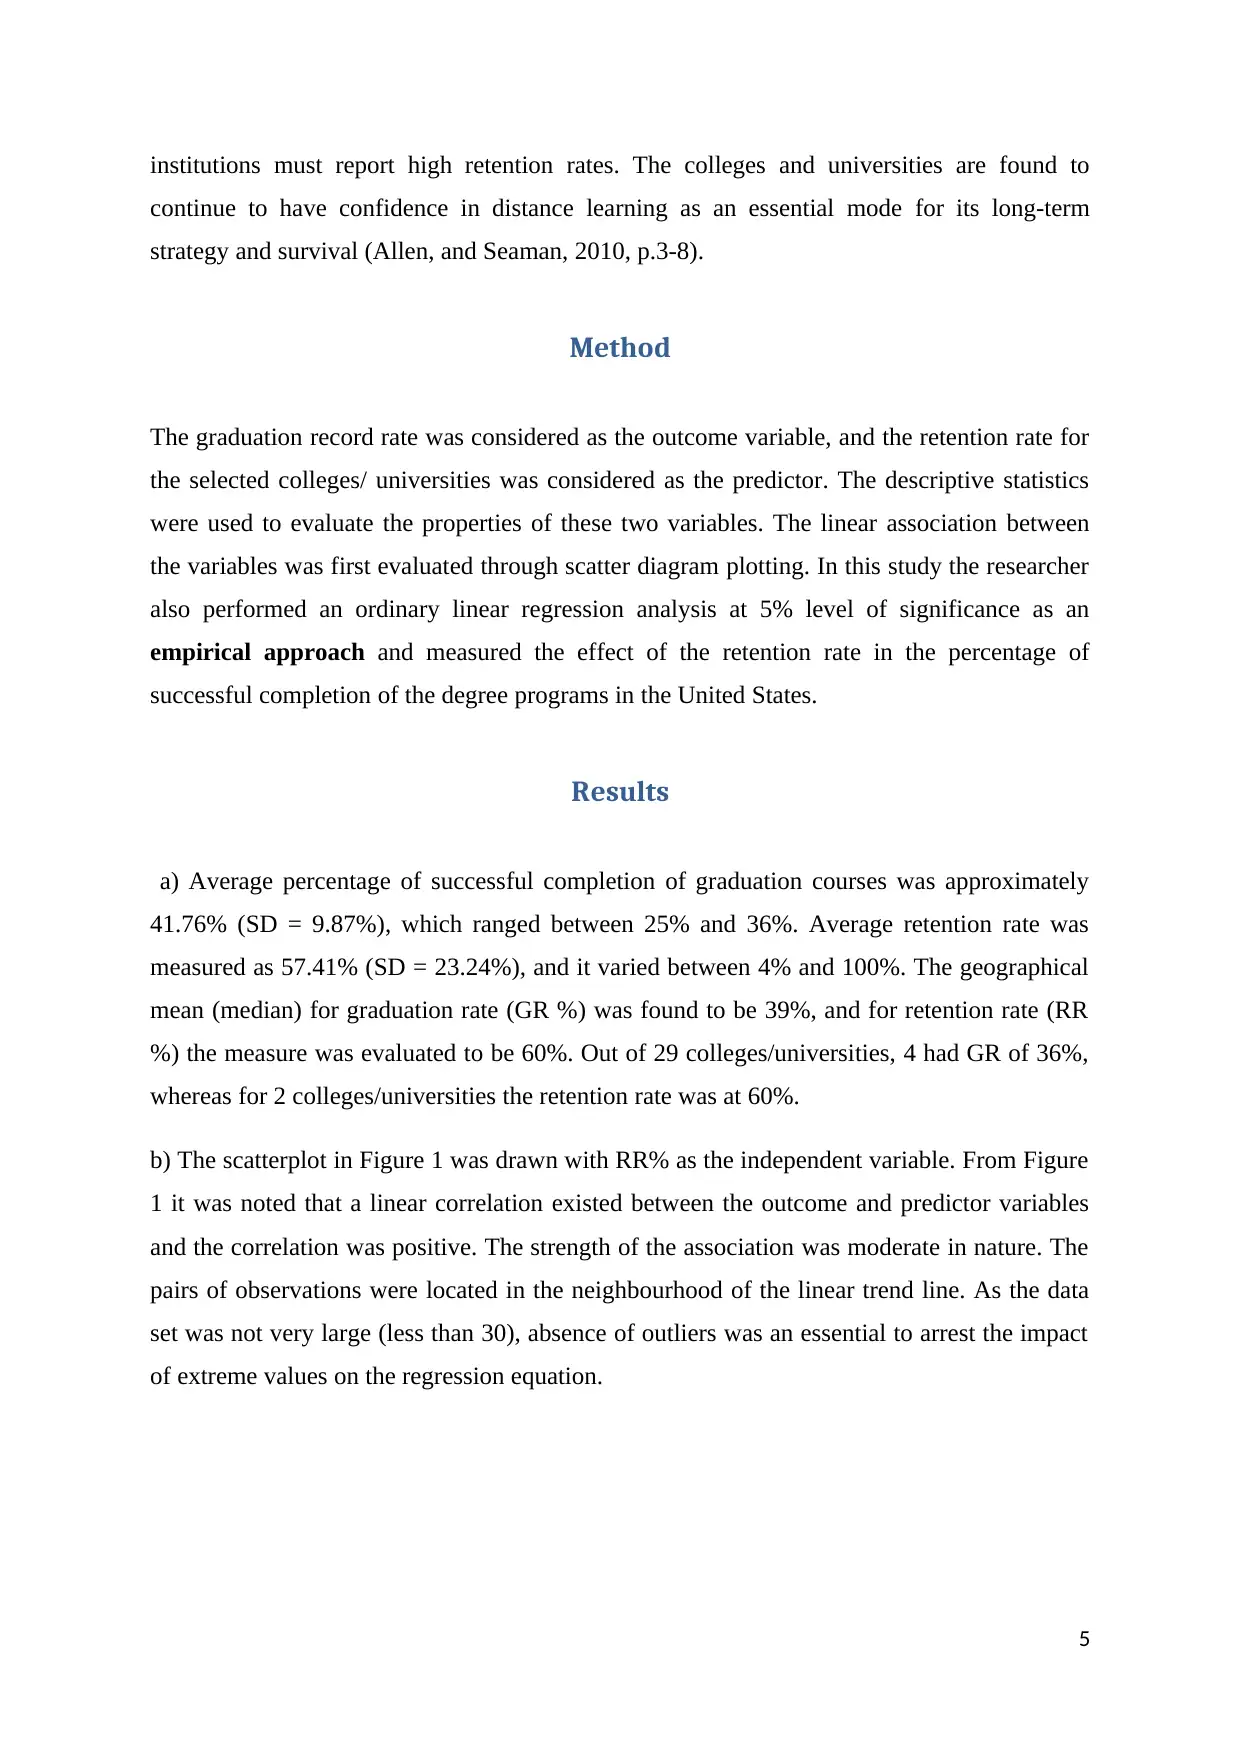
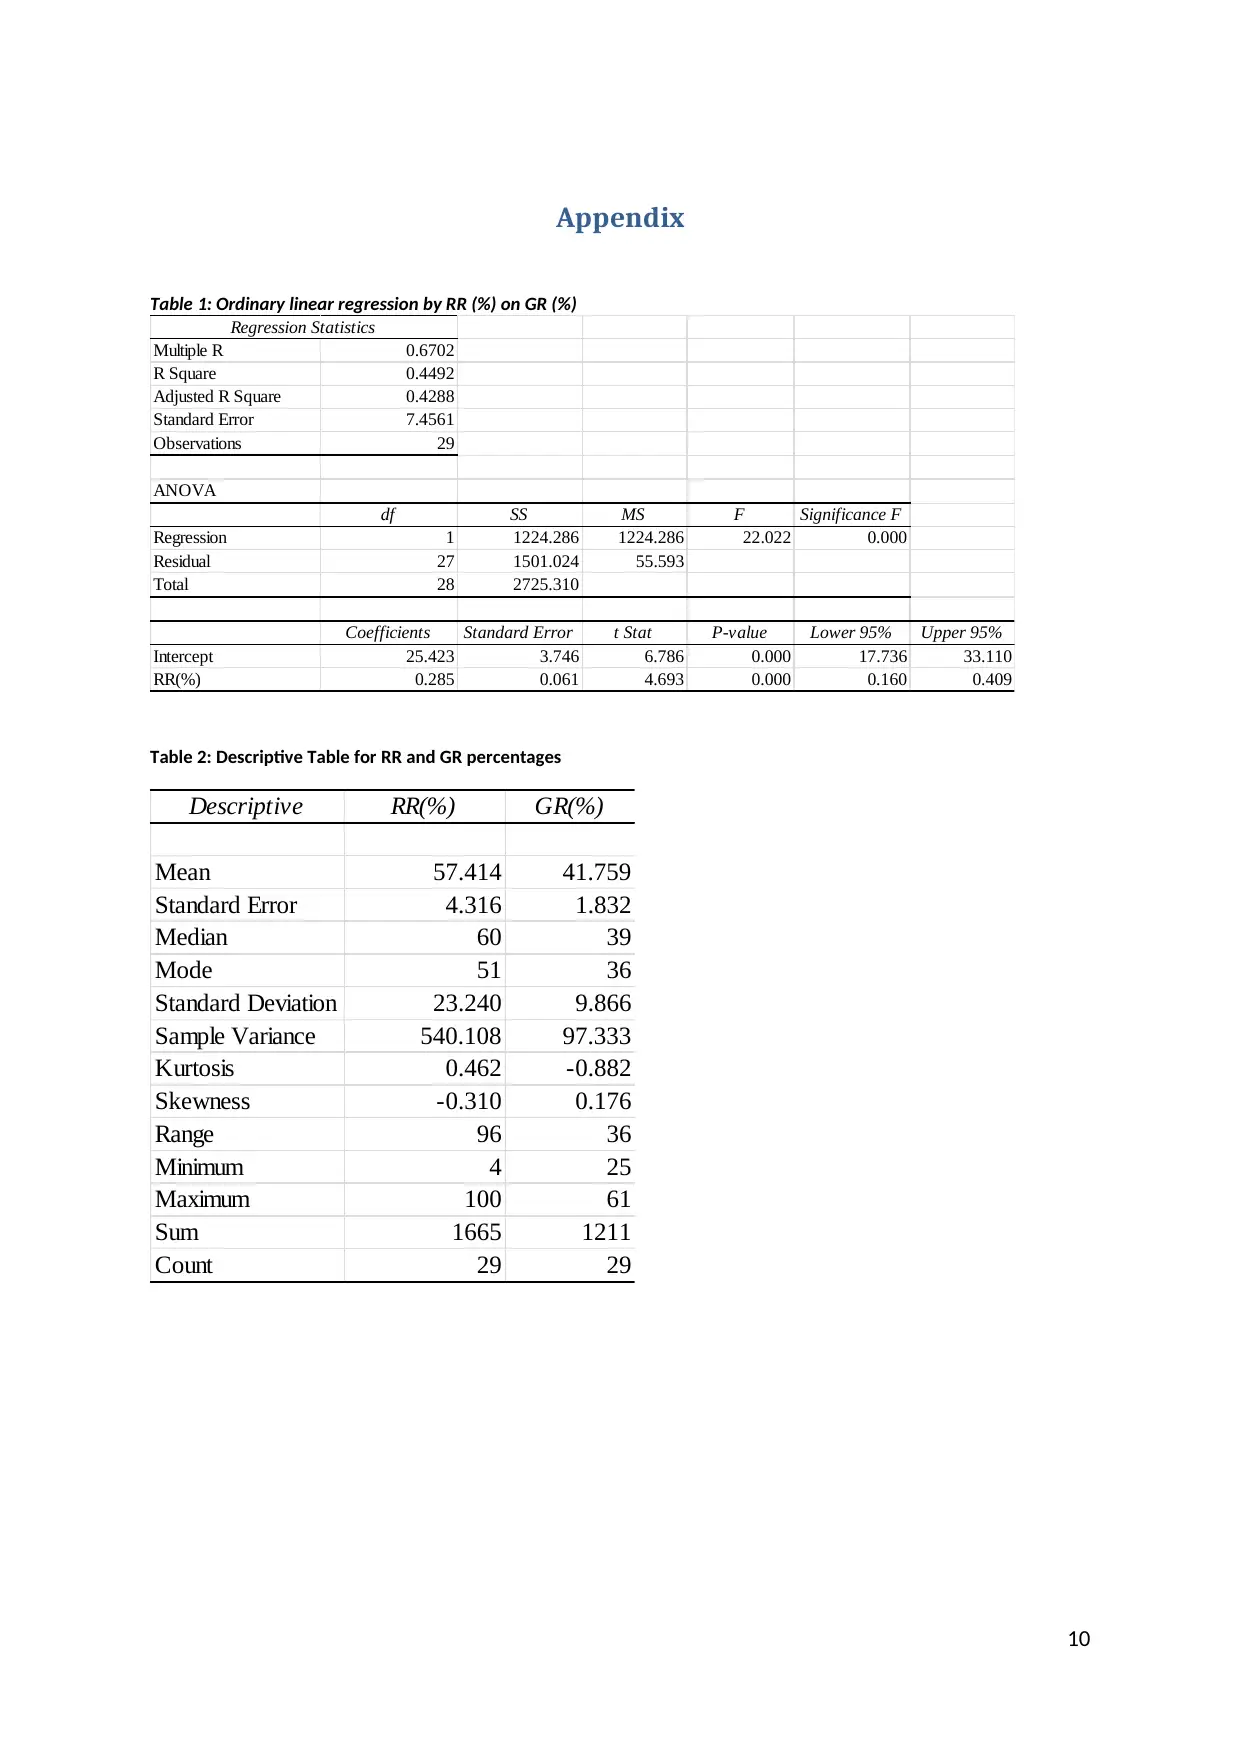
a) Average percentage of successful completion of graduation courses was approximately
41.76% (SD = 9.87%), which ranged between 25% and 36%. Average retention rate was
measured as 57.41% (SD = 23.24%), and it varied between 4% and 100%. The geographical
mean (median) for graduation rate (GR %) was found to be 39%, and for retention rate (RR
%) the measure was evaluated to be 60%. Out of 29 colleges/universities, 4 had GR of 36%,
whereas for 2 colleges/universities the retention rate was at 60%.
b) The scatterplot in Figure 1 was drawn with RR% as the independent variable. From Figure
1 it was noted that a linear correlation existed between the outcome and predictor variables
and the correlation was positive. The strength of the association was moderate in nature. The
pairs of observations were located in the neighbourhood of the linear trend line. As the data
set was not very large (less than 30), absence of outliers was an essential to arrest the impact
of extreme values on the regression equation.
5
continue to have confidence in distance learning as an essential mode for its long-term
strategy and survival (Allen, and Seaman, 2010, p.3-8).
Method
The graduation record rate was considered as the outcome variable, and the retention rate for
the selected colleges/ universities was considered as the predictor. The descriptive statistics
were used to evaluate the properties of these two variables. The linear association between
the variables was first evaluated through scatter diagram plotting. In this study the researcher
also performed an ordinary linear regression analysis at 5% level of significance as an
empirical approach and measured the effect of the retention rate in the percentage of
successful completion of the degree programs in the United States.
Results
a) Average percentage of successful completion of graduation courses was approximately
41.76% (SD = 9.87%), which ranged between 25% and 36%. Average retention rate was
measured as 57.41% (SD = 23.24%), and it varied between 4% and 100%. The geographical
mean (median) for graduation rate (GR %) was found to be 39%, and for retention rate (RR
%) the measure was evaluated to be 60%. Out of 29 colleges/universities, 4 had GR of 36%,
whereas for 2 colleges/universities the retention rate was at 60%.
b) The scatterplot in Figure 1 was drawn with RR% as the independent variable. From Figure
1 it was noted that a linear correlation existed between the outcome and predictor variables
and the correlation was positive. The strength of the association was moderate in nature. The
pairs of observations were located in the neighbourhood of the linear trend line. As the data
set was not very large (less than 30), absence of outliers was an essential to arrest the impact
of extreme values on the regression equation.
5
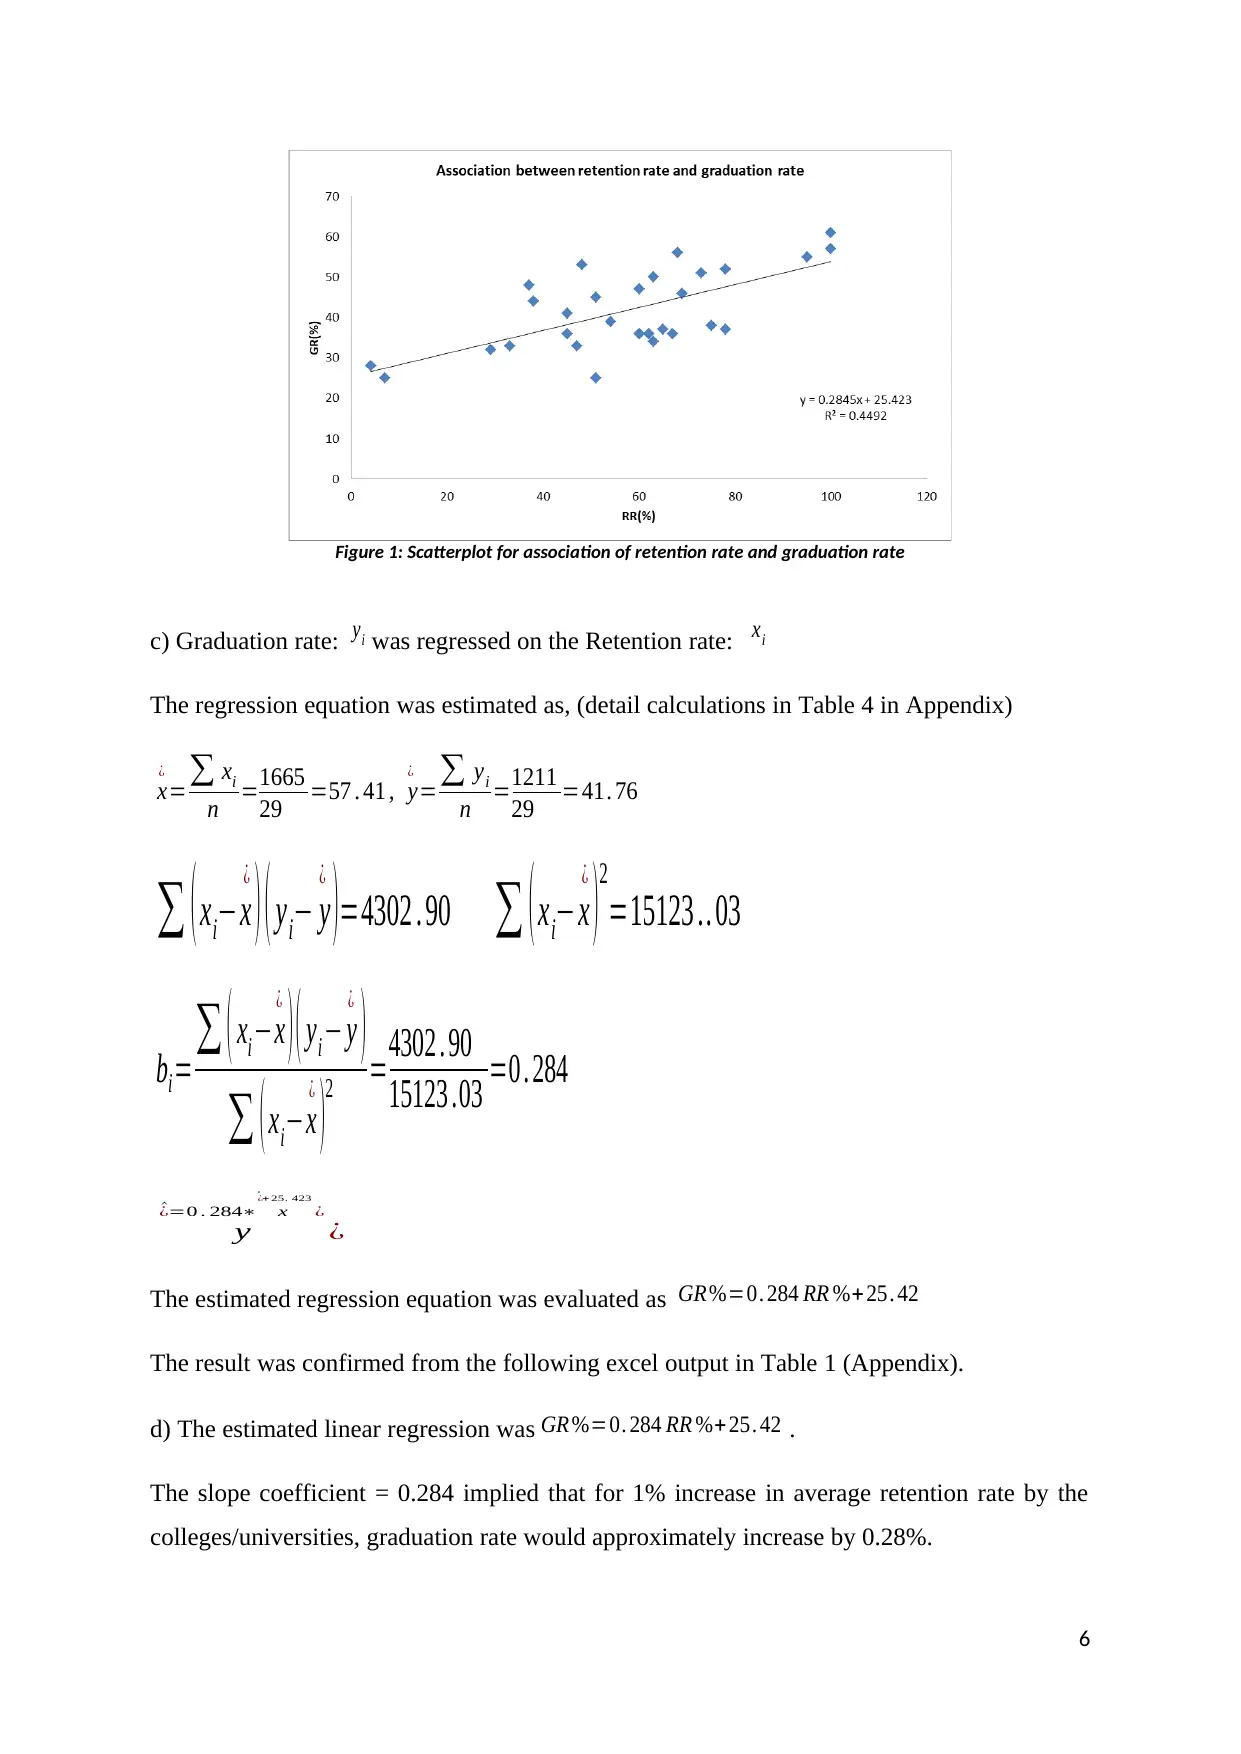
Figure 1: Scatterplot for association of retention rate and graduation rate
c) Graduation rate: yi was regressed on the Retention rate: xi
The regression equation was estimated as, (detail calculations in Table 4 in Appendix)
x
¿
=∑ xi
n =1665
29 =57 . 41 , y
¿
=∑ yi
n =1211
29 =41. 76
∑ ( xi−x
¿
) ( yi− y
¿
) =4302 . 90 ∑ ( xi−x
¿
)
2
=15123 .. 03
bi=∑ ( xi −x
¿
)( yi − y
¿
)
∑ ( xi−x
¿
)
2 =4302 . 90
15123 .03 =0 . 284
y
^¿=0 . 284∗ x
^¿+ 25. 423
¿
¿
The estimated regression equation was evaluated as GR %=0. 284 RR %+ 25. 42
The result was confirmed from the following excel output in Table 1 (Appendix).
d) The estimated linear regression was GR %=0. 284 RR %+ 25. 42 .
The slope coefficient = 0.284 implied that for 1% increase in average retention rate by the
colleges/universities, graduation rate would approximately increase by 0.28%.
6
⊘ This is a preview!⊘
Do you want full access?
Subscribe today to unlock all pages.
Trusted by 1+ million students worldwide
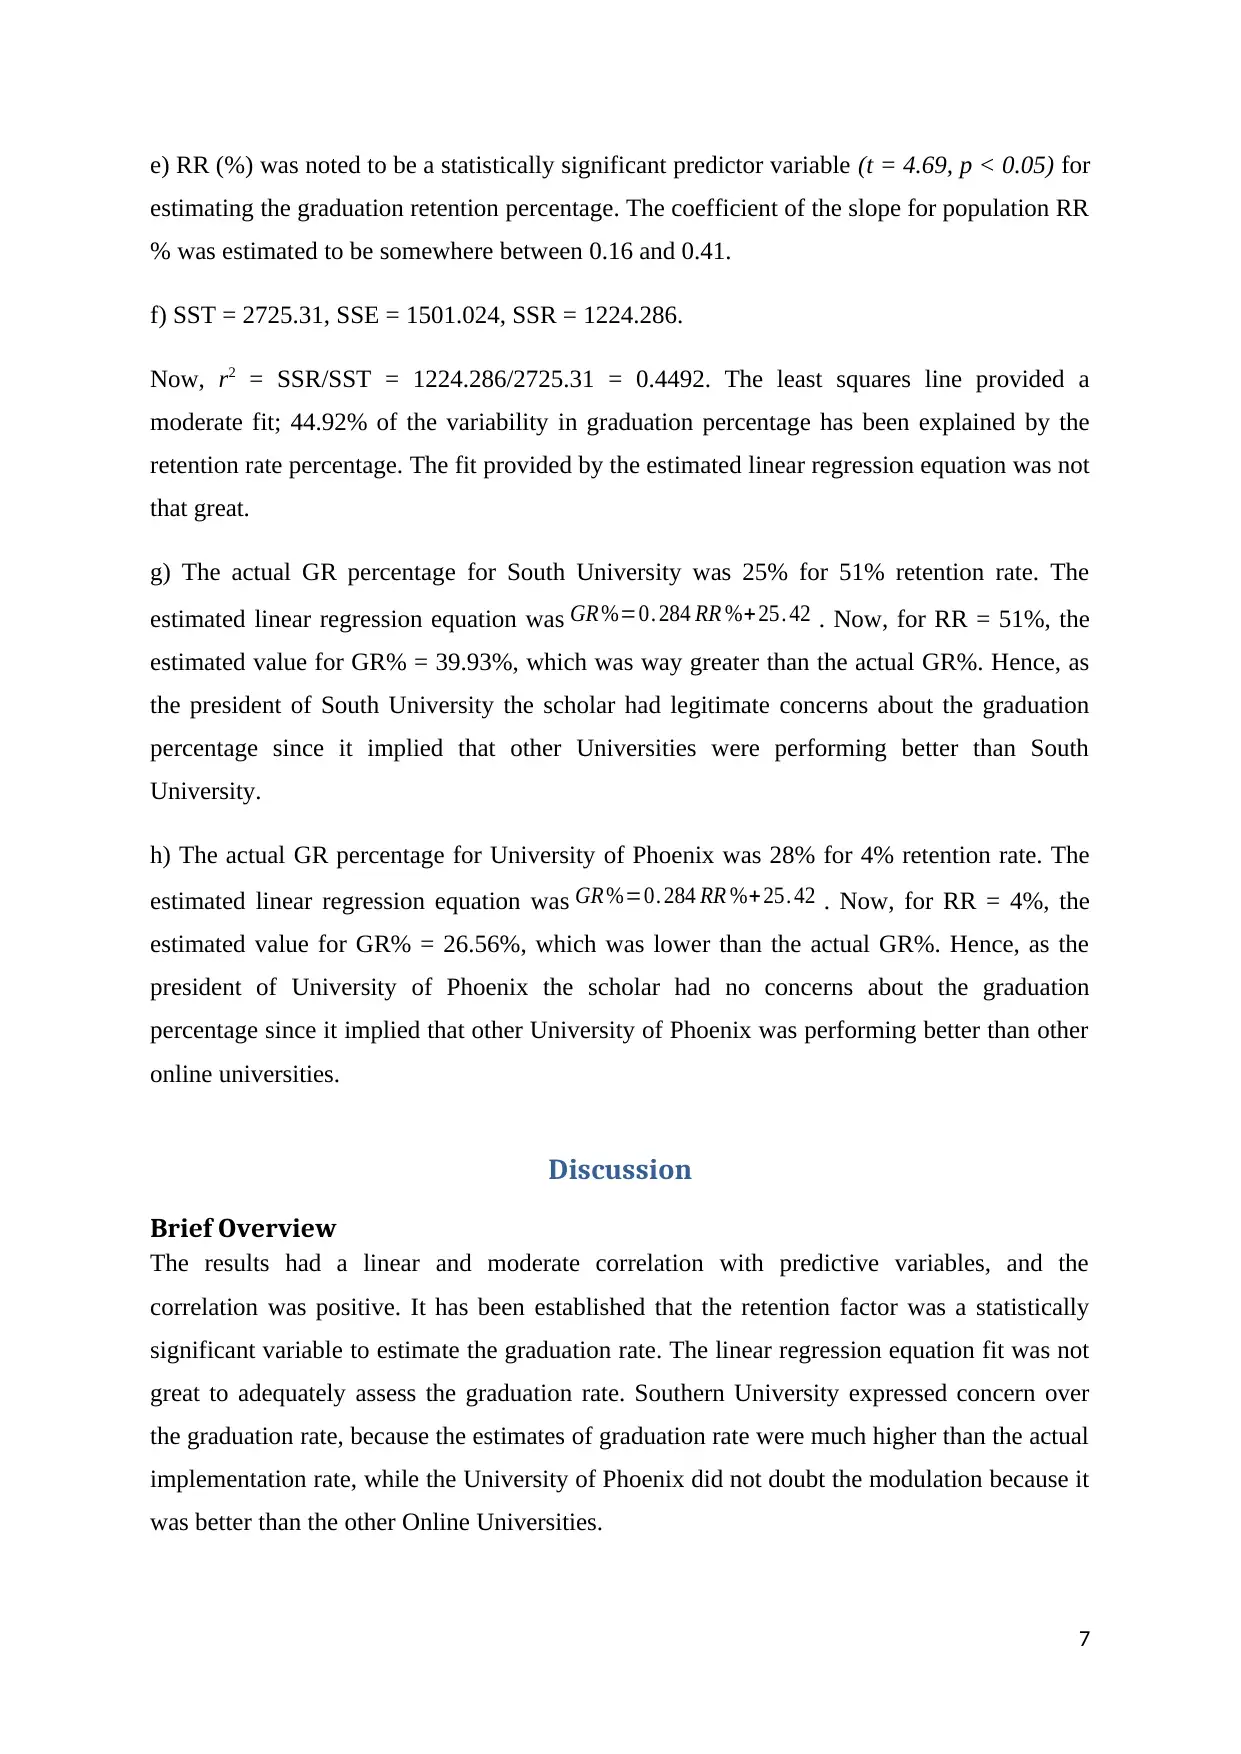
e) RR (%) was noted to be a statistically significant predictor variable (t = 4.69, p < 0.05) for
estimating the graduation retention percentage. The coefficient of the slope for population RR
% was estimated to be somewhere between 0.16 and 0.41.
f) SST = 2725.31, SSE = 1501.024, SSR = 1224.286.
Now, r2 = SSR/SST = 1224.286/2725.31 = 0.4492. The least squares line provided a
moderate fit; 44.92% of the variability in graduation percentage has been explained by the
retention rate percentage. The fit provided by the estimated linear regression equation was not
that great.
g) The actual GR percentage for South University was 25% for 51% retention rate. The
estimated linear regression equation was GR %=0. 284 RR %+ 25. 42 . Now, for RR = 51%, the
estimated value for GR% = 39.93%, which was way greater than the actual GR%. Hence, as
the president of South University the scholar had legitimate concerns about the graduation
percentage since it implied that other Universities were performing better than South
University.
h) The actual GR percentage for University of Phoenix was 28% for 4% retention rate. The
estimated linear regression equation was GR %=0. 284 RR %+ 25. 42 . Now, for RR = 4%, the
estimated value for GR% = 26.56%, which was lower than the actual GR%. Hence, as the
president of University of Phoenix the scholar had no concerns about the graduation
percentage since it implied that other University of Phoenix was performing better than other
online universities.
Discussion
Brief Overview
The results had a linear and moderate correlation with predictive variables, and the
correlation was positive. It has been established that the retention factor was a statistically
significant variable to estimate the graduation rate. The linear regression equation fit was not
great to adequately assess the graduation rate. Southern University expressed concern over
the graduation rate, because the estimates of graduation rate were much higher than the actual
implementation rate, while the University of Phoenix did not doubt the modulation because it
was better than the other Online Universities.
7
Paraphrase This Document
Need a fresh take? Get an instant paraphrase of this document with our AI Paraphraser
Strength & Limitations
The study sample consisted of university / college overall data irrespective of any particular
stream or course. This increased the validity of the results for generalization.
The study was limited to the US universities, and the sample was not large enough for any
decisive conclusions form the results. No demographic variables were included in the study,
and no information was available about the students of the universities, which reduced the
reliability dimensions.
Comparison with other studies
Based on the literature reviews used in this research and the results of the present study,
conclusions have been drawn. The results in line with the studies and subjective evidence
suggest that the rate of attrition in online courses is high, often much higher than offline
courses (Kizilcec, Piech, and Schneider, 2013, p.170-179; Hew, 2016, p.320-341; Park and
Choi, 2009, p.207-210; Rodriguez, 2012, p.2-5).
Policy Implications
As information about students’ school enrolment, entrance exams, and ethnicity and gender
composition were not taken into account; there was a serious lacuna for an attempt to assess
the performance of institutions through student retention indicators. In this study the strong
impacts of the factors influencing the graduation completion were ignored, and a formula was
created to estimate the expected rate of graduation on retention of educational institutions,
without using sensitive information as program specific longitudinal data from students
across the country.
Recommendations
For future research works three most important recommendations are:
i. Qualitative research to find out exact reasons for discontinuation of graduate
programs of online students.
ii. Program specific research to test the association between retention and graduation
rates.
iii. Investigation based on demographic as well as economic factors of the students along
with retaining rates for exact estimation of graduation percentages.
8
References
Allen, IE & Seaman, J 2010, ‘Class Differences: Online Education in the United States,
2010.’, Sloan Consortium (NJ1). pp. 3-8.
Blau, G, Jarrell, S, Seeton, A, Young, T, Grace, K & Hughes, M 2018, ‘Proposing an
Expanded Measure for Comparing Online/Hybrid to Face-to-face Courses’, Journal of
Education and Development, vol. 2, no. 2, p. 1.
Brady, KP, Holcomb, LB & Smith, BV 2010, ‘The use of alternative social networking sites
in higher educational settings: A case study of the e-learning benefits of Ning in education.’,
Journal of Interactive Online Learning, vol. 9, no. 2.pp.153-155
Hew, K.F., 2016. Promoting engagement in online courses: What strategies can we learn
from three highly rated MOOCS. British Journal of Educational Technology, 47(2), pp.320-
341.
Johnson, L, Becker, SA, Cummins, M, Estrada, V, Freeman, A & Hall, C 2016, NMC horizon
report: 2016 higher education edition (pp.1-50), The New Media Consortium.
Kizilcec, RF, Piech, C & Schneider, E 2013, ‘Deconstructing disengagement: analyzing
learner subpopulations in massive open online courses’, in Proceedings of the third
international conference on learning analytics and knowledge, ACM, pp. 170–179.
Park, J-H & Choi, HJ 2009, ‘Factors influencing adult learners’ decision to drop out or persist
in online learning.’, Journal of Educational Technology & Society, vol. 12, no. 4. pp.207-210
Rodriguez, CO 2012, ‘MOOCs and the AI-Stanford Like Courses: Two Successful and
Distinct Course Formats for Massive Open Online Courses.’, European Journal of Open,
Distance and E-Learning.pp.2-5
9
⊘ This is a preview!⊘
Do you want full access?
Subscribe today to unlock all pages.
Trusted by 1+ million students worldwide
Appendix
Table 1: Ordinary linear regression by RR (%) on GR (%)
Regression Statistics
Multiple R 0.6702
R Square 0.4492
Adjusted R Square 0.4288
Standard Error 7.4561
Observations 29
ANOVA
df SS MS F Significance F
Regression 1 1224.286 1224.286 22.022 0.000
Residual 27 1501.024 55.593
Total 28 2725.310
Coefficients Standard Error t Stat P-value Lower 95% Upper 95%
Intercept 25.423 3.746 6.786 0.000 17.736 33.110
RR(%) 0.285 0.061 4.693 0.000 0.160 0.409
Table 2: Descriptive Table for RR and GR percentages
Descriptive RR(%) GR(%)
Mean 57.414 41.759
Standard Error 4.316 1.832
Median 60 39
Mode 51 36
Standard Deviation 23.240 9.866
Sample Variance 540.108 97.333
Kurtosis 0.462 -0.882
Skewness -0.310 0.176
Range 96 36
Minimum 4 25
Maximum 100 61
Sum 1665 1211
Count 29 29
10
Paraphrase This Document
Need a fresh take? Get an instant paraphrase of this document with our AI Paraphraser
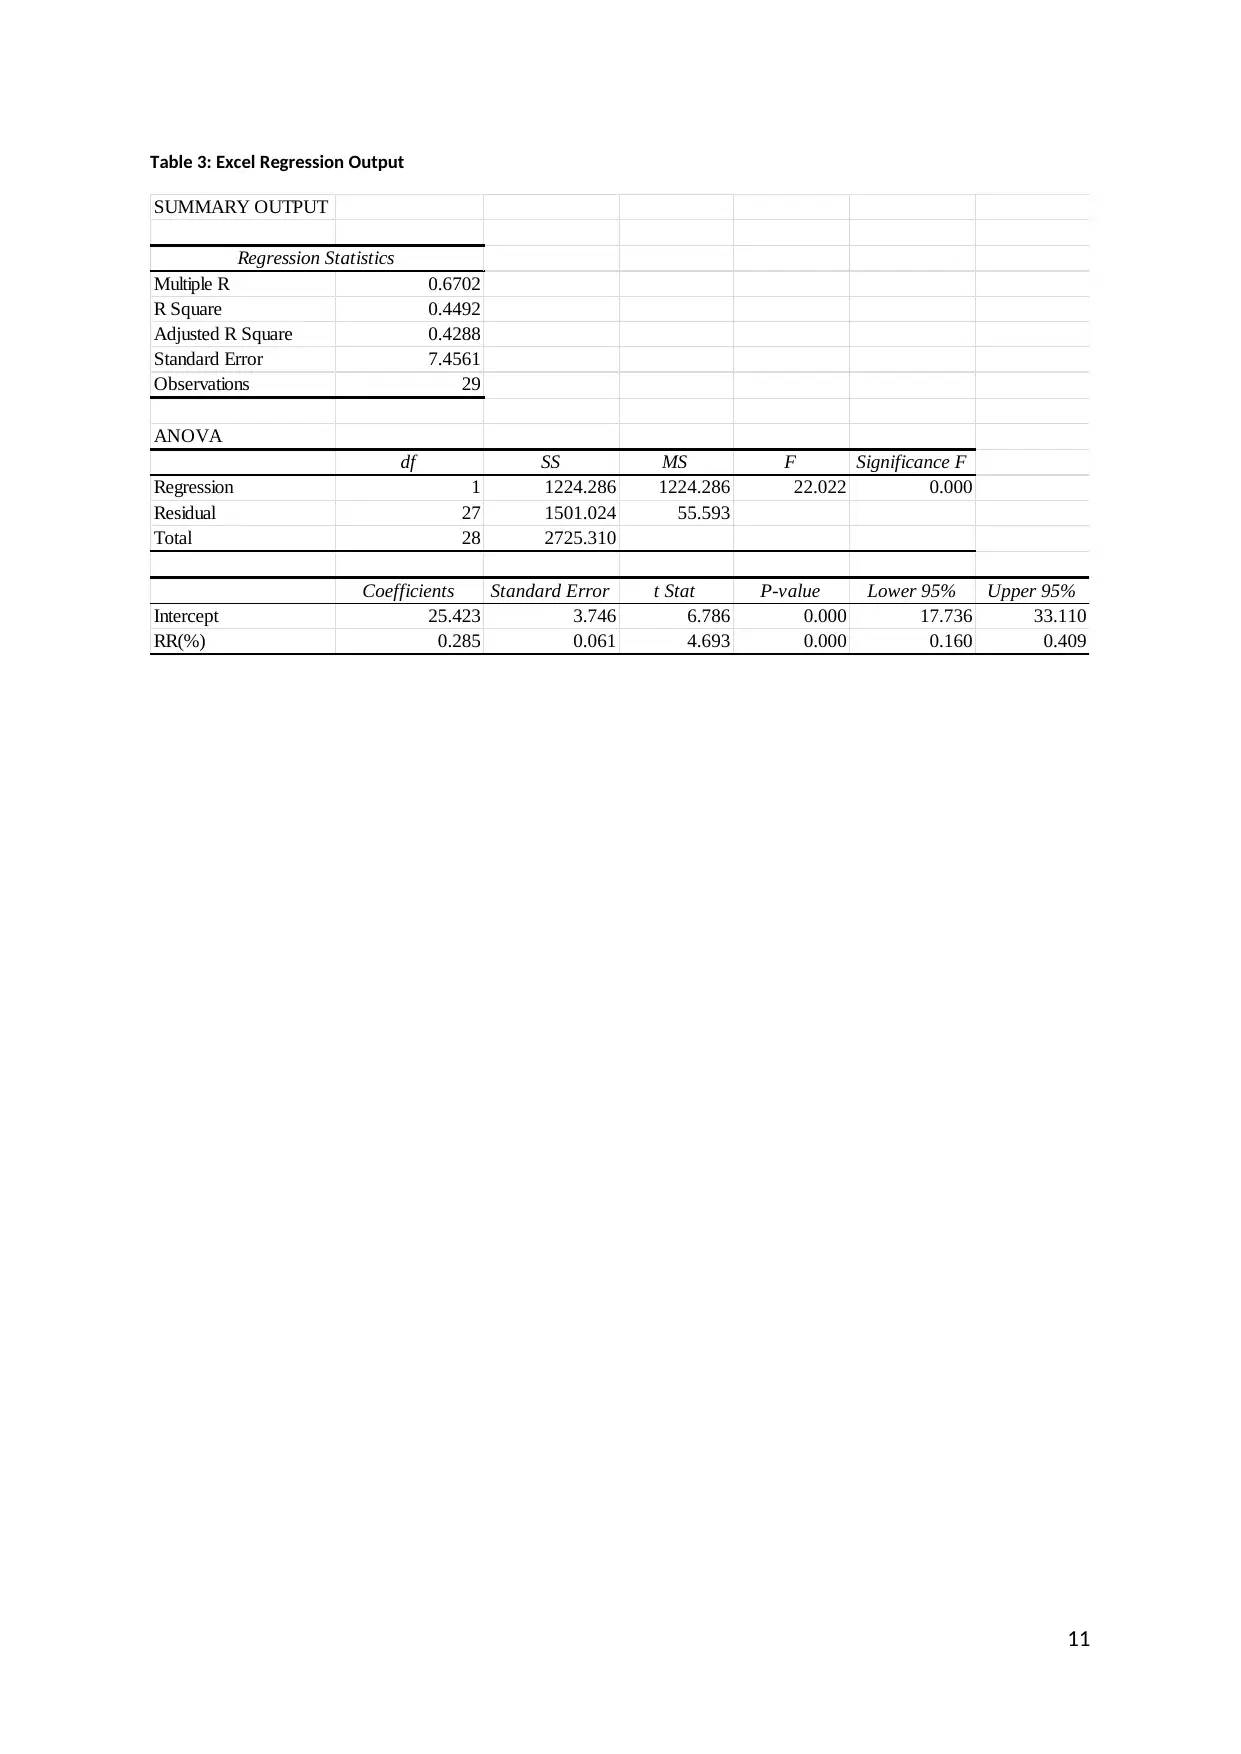
Table 3: Excel Regression Output
SUMMARY OUTPUT
Regression Statistics
Multiple R 0.6702
R Square 0.4492
Adjusted R Square 0.4288
Standard Error 7.4561
Observations 29
ANOVA
df SS MS F Significance F
Regression 1 1224.286 1224.286 22.022 0.000
Residual 27 1501.024 55.593
Total 28 2725.310
Coefficients Standard Error t Stat P-value Lower 95% Upper 95%
Intercept 25.423 3.746 6.786 0.000 17.736 33.110
RR(%) 0.285 0.061 4.693 0.000 0.160 0.409
11
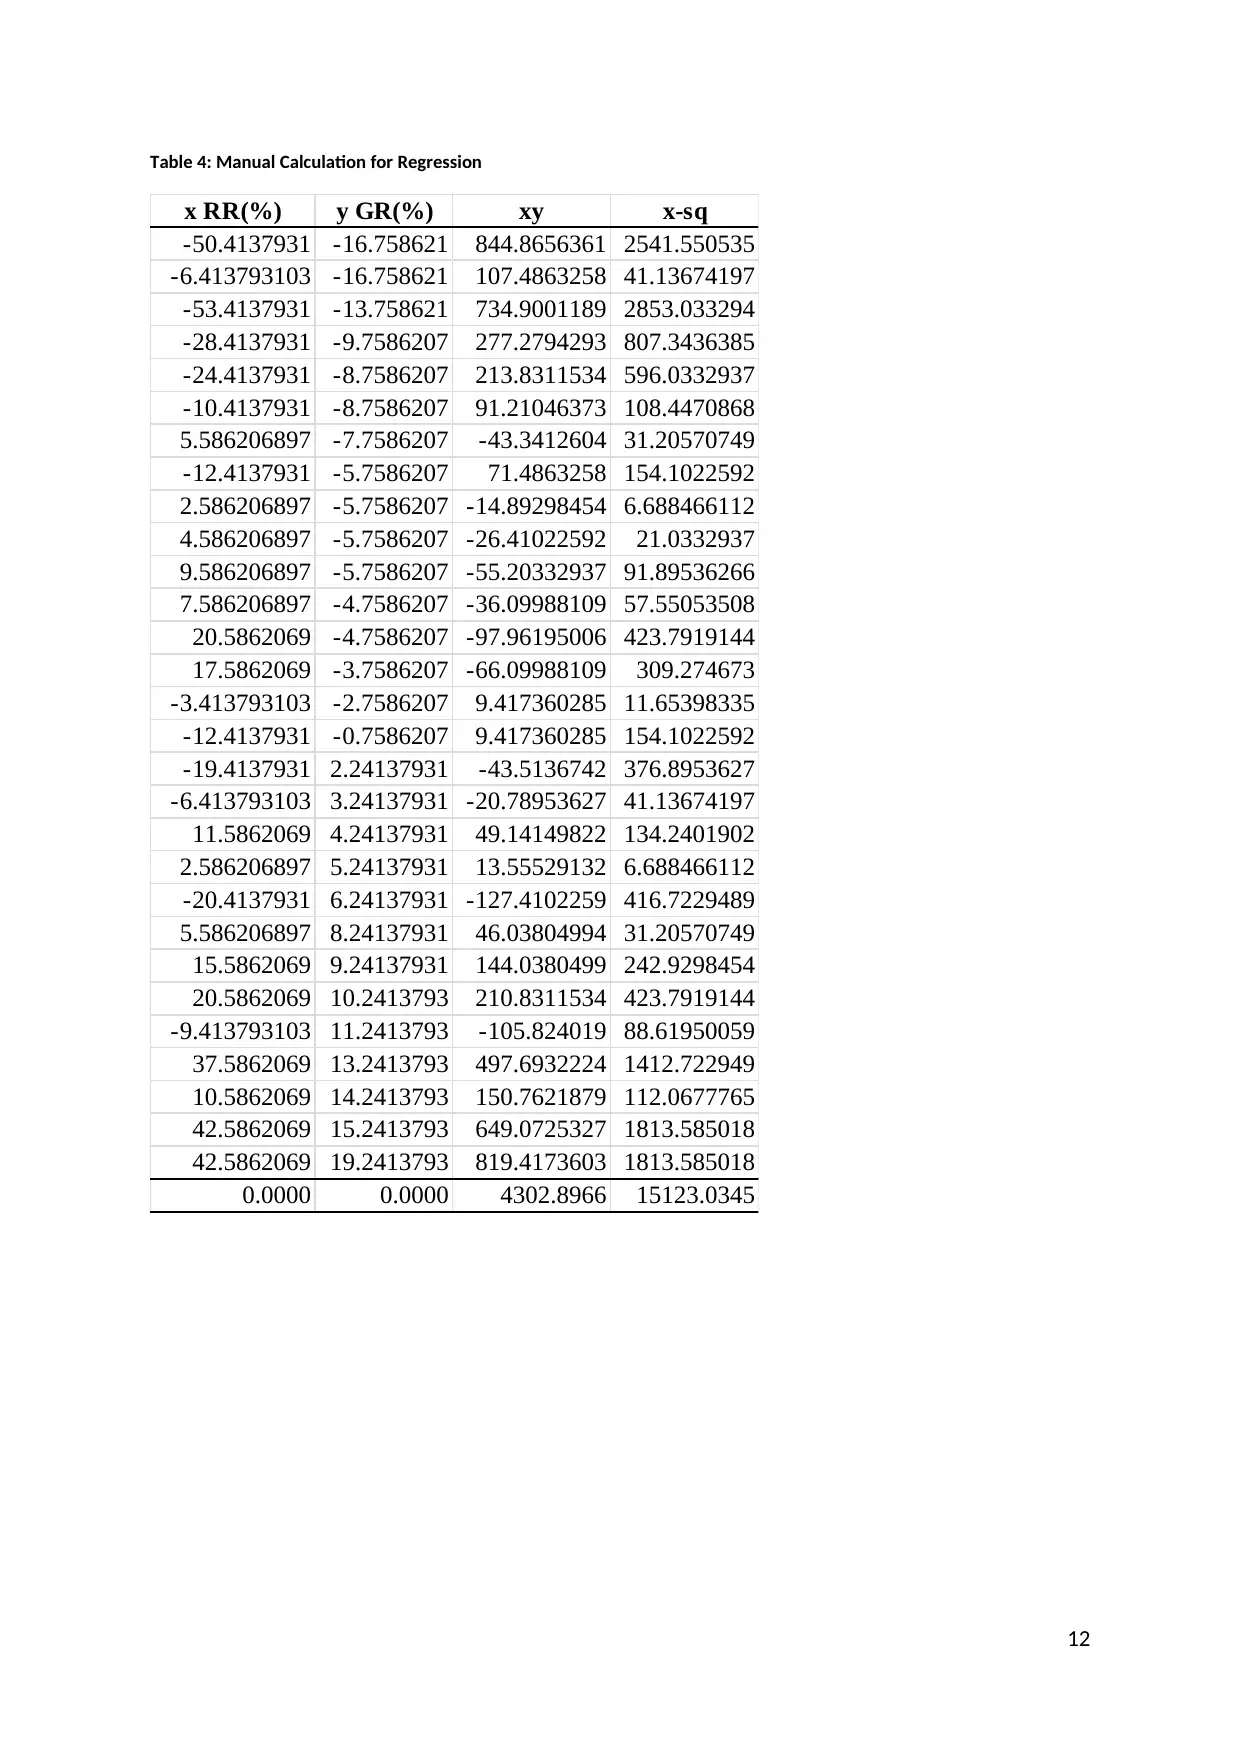
Table 4: Manual Calculation for Regression
x RR(%) y GR(%) xy x-sq
-50.4137931 -16.758621 844.8656361 2541.550535
-6.413793103 -16.758621 107.4863258 41.13674197
-53.4137931 -13.758621 734.9001189 2853.033294
-28.4137931 -9.7586207 277.2794293 807.3436385
-24.4137931 -8.7586207 213.8311534 596.0332937
-10.4137931 -8.7586207 91.21046373 108.4470868
5.586206897 -7.7586207 -43.3412604 31.20570749
-12.4137931 -5.7586207 71.4863258 154.1022592
2.586206897 -5.7586207 -14.89298454 6.688466112
4.586206897 -5.7586207 -26.41022592 21.0332937
9.586206897 -5.7586207 -55.20332937 91.89536266
7.586206897 -4.7586207 -36.09988109 57.55053508
20.5862069 -4.7586207 -97.96195006 423.7919144
17.5862069 -3.7586207 -66.09988109 309.274673
-3.413793103 -2.7586207 9.417360285 11.65398335
-12.4137931 -0.7586207 9.417360285 154.1022592
-19.4137931 2.24137931 -43.5136742 376.8953627
-6.413793103 3.24137931 -20.78953627 41.13674197
11.5862069 4.24137931 49.14149822 134.2401902
2.586206897 5.24137931 13.55529132 6.688466112
-20.4137931 6.24137931 -127.4102259 416.7229489
5.586206897 8.24137931 46.03804994 31.20570749
15.5862069 9.24137931 144.0380499 242.9298454
20.5862069 10.2413793 210.8311534 423.7919144
-9.413793103 11.2413793 -105.824019 88.61950059
37.5862069 13.2413793 497.6932224 1412.722949
10.5862069 14.2413793 150.7621879 112.0677765
42.5862069 15.2413793 649.0725327 1813.585018
42.5862069 19.2413793 819.4173603 1813.585018
0.0000 0.0000 4302.8966 15123.0345
12
⊘ This is a preview!⊘
Do you want full access?
Subscribe today to unlock all pages.
Trusted by 1+ million students worldwide
1 out of 13
Related Documents


Your All-in-One AI-Powered Toolkit for Academic Success.
+13062052269
info@desklib.com
Available 24*7 on WhatsApp / Email
![[object Object]](/_next/static/media/star-bottom.7253800d.svg)
Unlock your academic potential
Copyright © 2020–2026 A2Z Services. All Rights Reserved. Developed and managed by ZUCOL.