Machine Learning Project: Binary, Logistic Regression, Softmax
VerifiedAdded on 2021/10/16
|15
|2140
|354
Project
AI Summary
This project focuses on implementing fundamental machine learning algorithms using Python. It begins with matrix multiplication and data visualization, followed by binary logistic regression, including the generation of precision-recall curves. The project then delves into multi-class classification using the MNIST dataset, exploring k-nearest neighbors and image classification. Logistic regression is explored, including cross-entropy calculations and the application of the softmax function for multi-class problems. The project then implements batch and stochastic gradient descent for optimization, analyzing training and test accuracy and loss. The project covers a range of topics including matrix multiplication, binary regression, multi-class classification, logistic regression, softmax, and gradient descent, all implemented and analyzed using Python. The results and performance of each algorithm are discussed, along with the impact of different parameters like batch size on model performance. The project culminates in a comprehensive analysis of these machine learning techniques.

Machine Learning
Paraphrase This Document
Need a fresh take? Get an instant paraphrase of this document with our AI Paraphraser
Table of Contents
1. Introduction...................................................................................................................................2
2. Matrix Multiplication....................................................................................................................2
3. Binary Logistic Regression............................................................................................................3
4. Multi - Class Classification............................................................................................................3
5. Logistic Regression.......................................................................................................................4
6. Softmax.........................................................................................................................................5
7. Batch Gradient Descent.................................................................................................................6
8. Stochastic Gradient Descent..........................................................................................................7
9. Conclusion.....................................................................................................................................8
References.............................................................................................................................................9
1
1. Introduction
In this project to compute the binary regression, logistic regression and generate the data
using python code. We are using the mnist pickle file to run the program. We are developing
the matrix multiplication, multi- class classification, binary regression and logistic regression
using python. It has the separated file and using python code to develop the task. The first
task is to develop the matrix multiplication and display the scatter plot. The second task to
develop the binary logistic regression for generates the data and it displays the scatter plot.
The third task to develop the multi classification and using the mniist file to generate the
recall curve. The fourth task is logistic regression and it calculates the entropy by using the
formula. The fifth task is softmax and we are calculate the cross entropy related to task 4.The
sixth task is batch gradient descent and it develop the muliti class classification. The seventh
task is stochastic gradient descent and it displays the output to relate to the batch size.
2. Matrix Multiplication
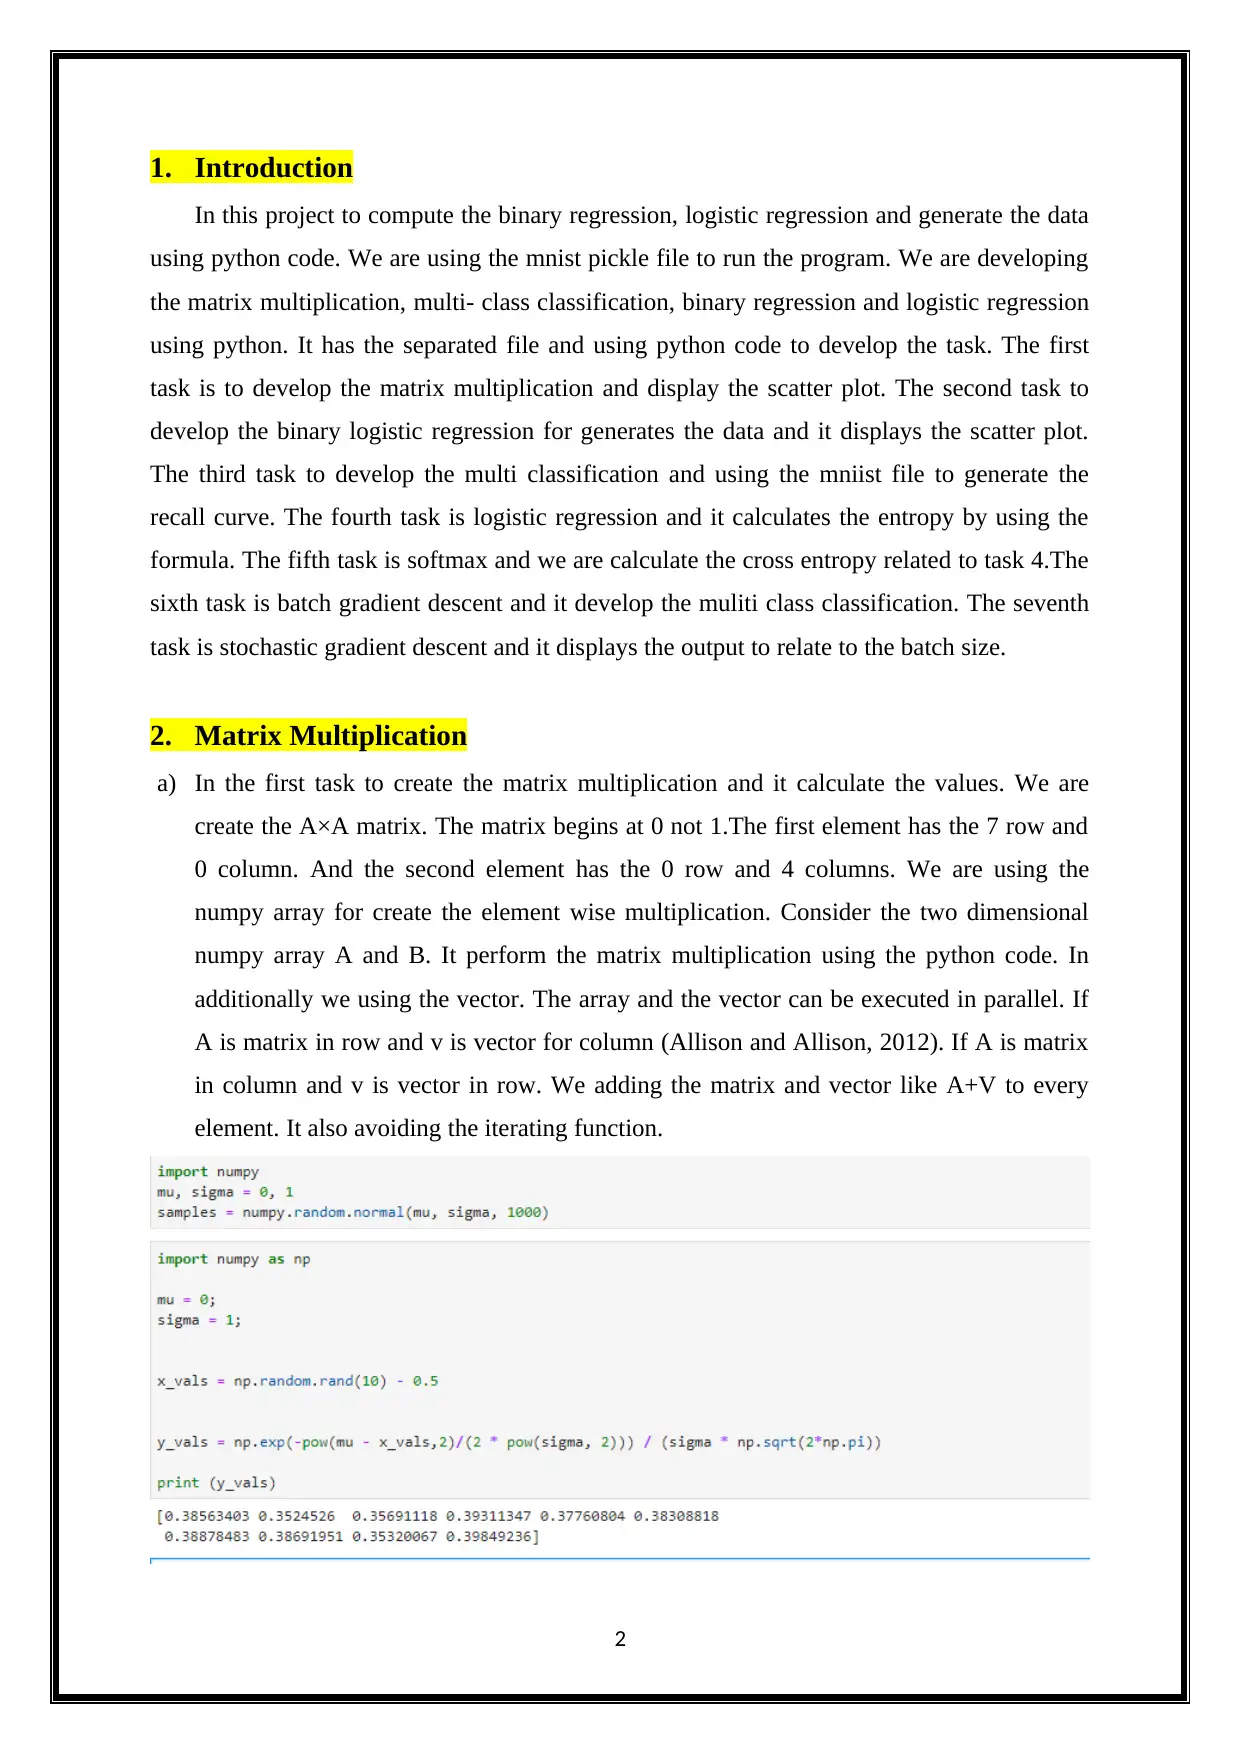
a) In the first task to create the matrix multiplication and it calculate the values. We are
create the A×A matrix. The matrix begins at 0 not 1.The first element has the 7 row and
0 column. And the second element has the 0 row and 4 columns. We are using the
numpy array for create the element wise multiplication. Consider the two dimensional
numpy array A and B. It perform the matrix multiplication using the python code. In
additionally we using the vector. The array and the vector can be executed in parallel. If
A is matrix in row and v is vector for column (Allison and Allison, 2012). If A is matrix
in column and v is vector in row. We adding the matrix and vector like A+V to every
element. It also avoiding the iterating function.
2
In this project to compute the binary regression, logistic regression and generate the data
using python code. We are using the mnist pickle file to run the program. We are developing
the matrix multiplication, multi- class classification, binary regression and logistic regression
using python. It has the separated file and using python code to develop the task. The first
task is to develop the matrix multiplication and display the scatter plot. The second task to
develop the binary logistic regression for generates the data and it displays the scatter plot.
The third task to develop the multi classification and using the mniist file to generate the
recall curve. The fourth task is logistic regression and it calculates the entropy by using the
formula. The fifth task is softmax and we are calculate the cross entropy related to task 4.The
sixth task is batch gradient descent and it develop the muliti class classification. The seventh
task is stochastic gradient descent and it displays the output to relate to the batch size.
2. Matrix Multiplication
a) In the first task to create the matrix multiplication and it calculate the values. We are
create the A×A matrix. The matrix begins at 0 not 1.The first element has the 7 row and
0 column. And the second element has the 0 row and 4 columns. We are using the
numpy array for create the element wise multiplication. Consider the two dimensional
numpy array A and B. It perform the matrix multiplication using the python code. In
additionally we using the vector. The array and the vector can be executed in parallel. If
A is matrix in row and v is vector for column (Allison and Allison, 2012). If A is matrix
in column and v is vector in row. We adding the matrix and vector like A+V to every
element. It also avoiding the iterating function.
2
⊘ This is a preview!⊘
Do you want full access?
Subscribe today to unlock all pages.
Trusted by 1+ million students worldwide
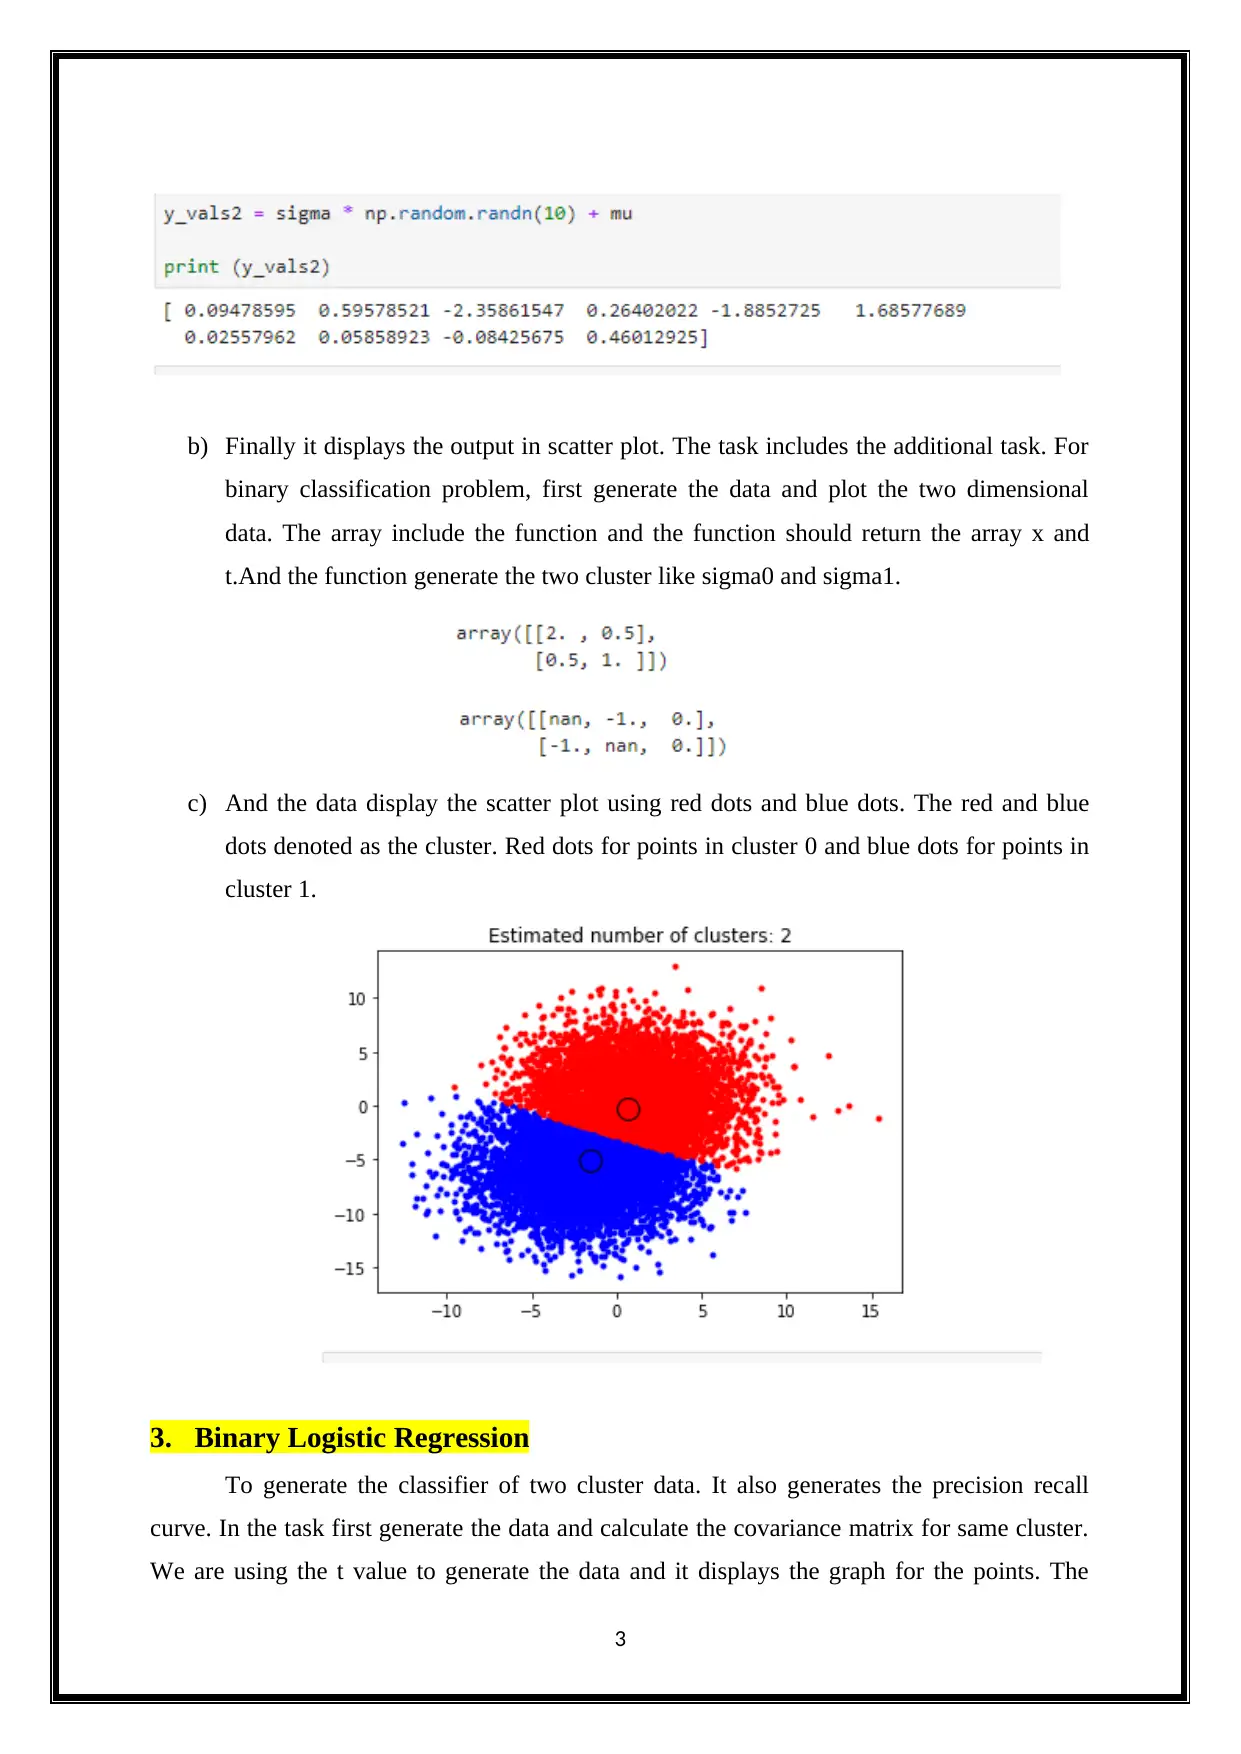
b) Finally it displays the output in scatter plot. The task includes the additional task. For
binary classification problem, first generate the data and plot the two dimensional
data. The array include the function and the function should return the array x and
t.And the function generate the two cluster like sigma0 and sigma1.
c) And the data display the scatter plot using red dots and blue dots. The red and blue
dots denoted as the cluster. Red dots for points in cluster 0 and blue dots for points in
cluster 1.
3. Binary Logistic Regression
To generate the classifier of two cluster data. It also generates the precision recall
curve. In the task first generate the data and calculate the covariance matrix for same cluster.
We are using the t value to generate the data and it displays the graph for the points. The
3
Paraphrase This Document
Need a fresh take? Get an instant paraphrase of this document with our AI Paraphraser
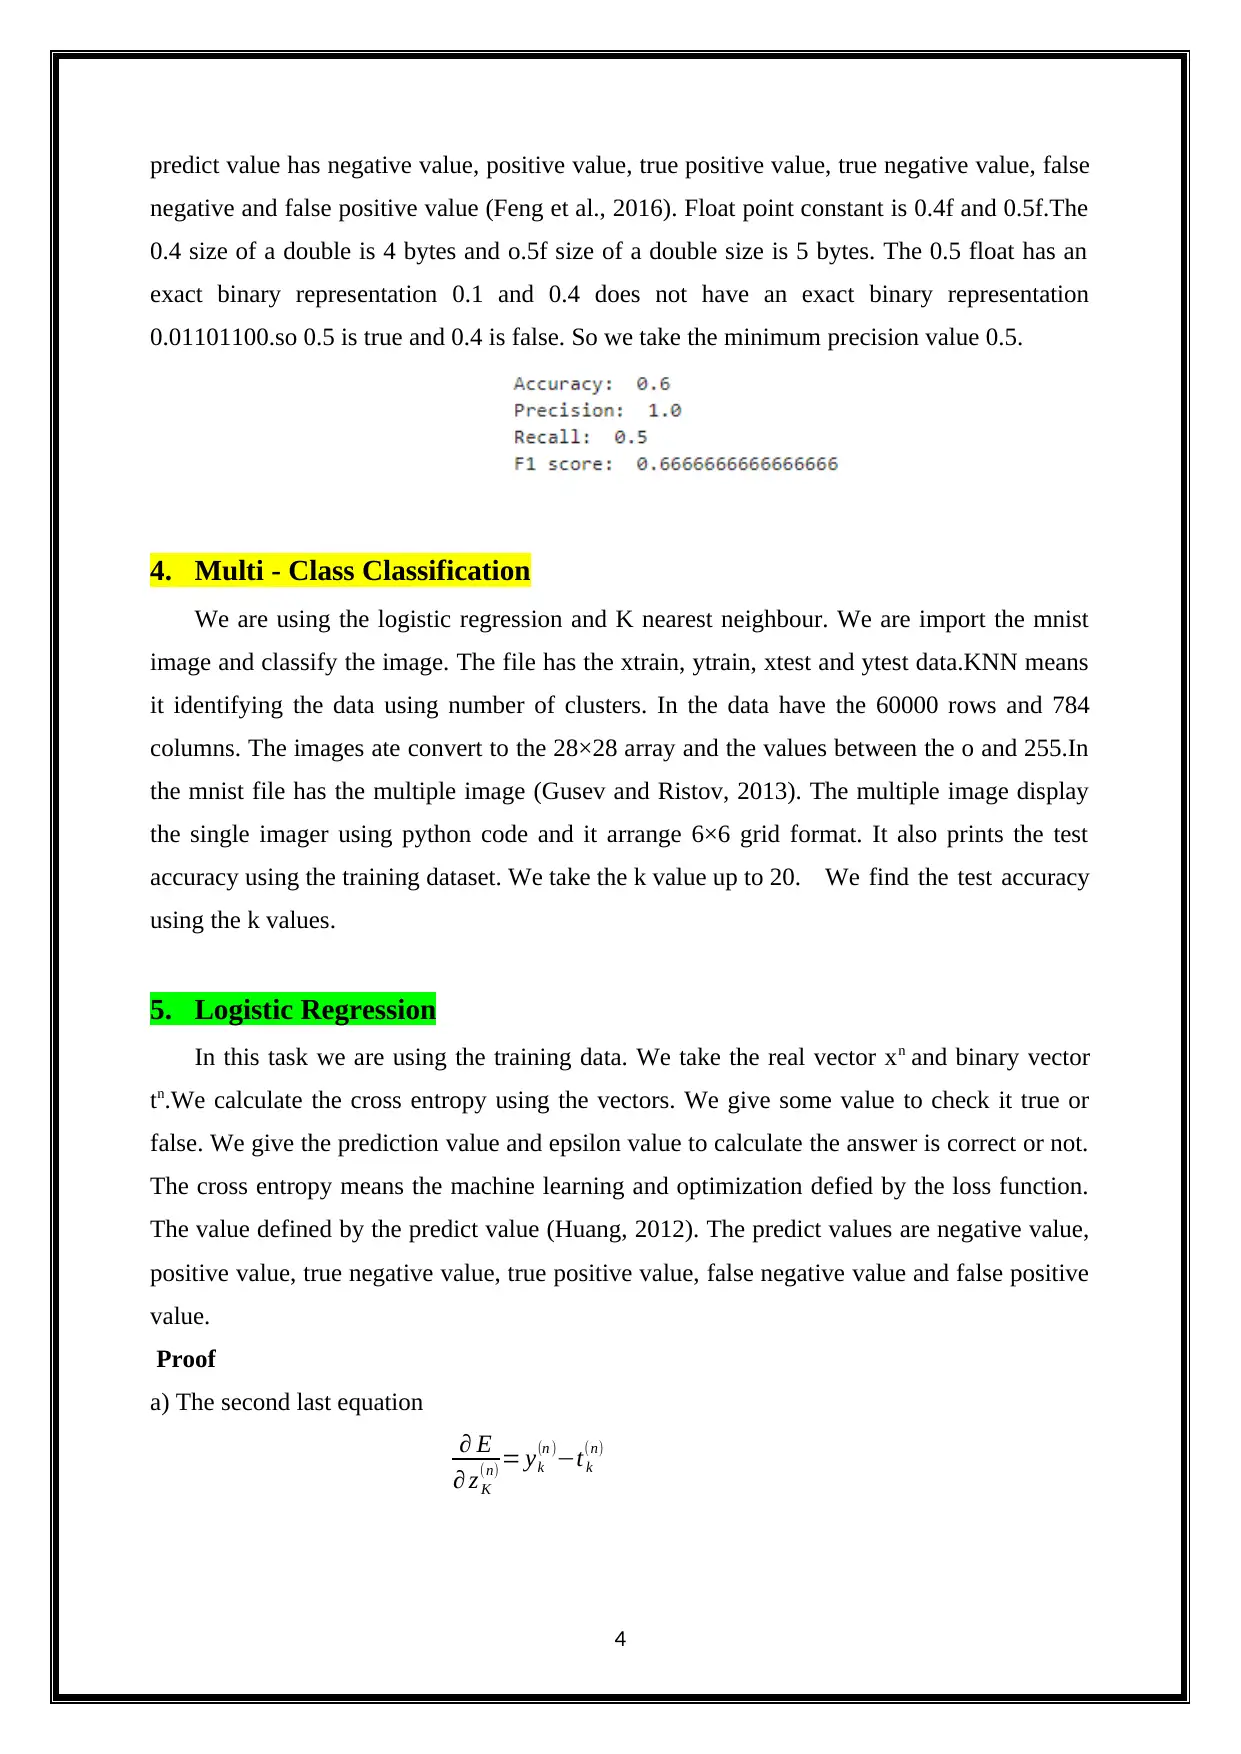
predict value has negative value, positive value, true positive value, true negative value, false
negative and false positive value (Feng et al., 2016). Float point constant is 0.4f and 0.5f.The
0.4 size of a double is 4 bytes and o.5f size of a double size is 5 bytes. The 0.5 float has an
exact binary representation 0.1 and 0.4 does not have an exact binary representation
0.01101100.so 0.5 is true and 0.4 is false. So we take the minimum precision value 0.5.
4. Multi - Class Classification
We are using the logistic regression and K nearest neighbour. We are import the mnist
image and classify the image. The file has the xtrain, ytrain, xtest and ytest data.KNN means
it identifying the data using number of clusters. In the data have the 60000 rows and 784
columns. The images ate convert to the 28×28 array and the values between the o and 255.In
the mnist file has the multiple image (Gusev and Ristov, 2013). The multiple image display
the single imager using python code and it arrange 6×6 grid format. It also prints the test
accuracy using the training dataset. We take the k value up to 20. We find the test accuracy
using the k values.
5. Logistic Regression
In this task we are using the training data. We take the real vector xn and binary vector
tn.We calculate the cross entropy using the vectors. We give some value to check it true or
false. We give the prediction value and epsilon value to calculate the answer is correct or not.
The cross entropy means the machine learning and optimization defied by the loss function.
The value defined by the predict value (Huang, 2012). The predict values are negative value,
positive value, true negative value, true positive value, false negative value and false positive
value.
Proof
a) The second last equation
∂ E
∂ z K
(n) = yk
(n )−t k
(n)
4
log ∂ E
∂ Zk
( n ) =log ( y k
( n )−tk
( n ))
∂ y j
(n)
∂ zk
(n) =δ jk y j
(n)− y j
(n) y k
(n)
b) Let assume the X,T AND Y value.
∂ E
∂W =XT (Y – T)
Assume Xt = xi
(n) ,Y =Y k
( n ) and T = tk
(n)
Apply the value
∂ E
∂ wk 0
=∑
n
[ yk
( n )−tk
( n ) ] xi
(n)
c) We take i=0
Then xi
(n)=1
∂ E
∂ wk 0
= ∑
n
¿¿]
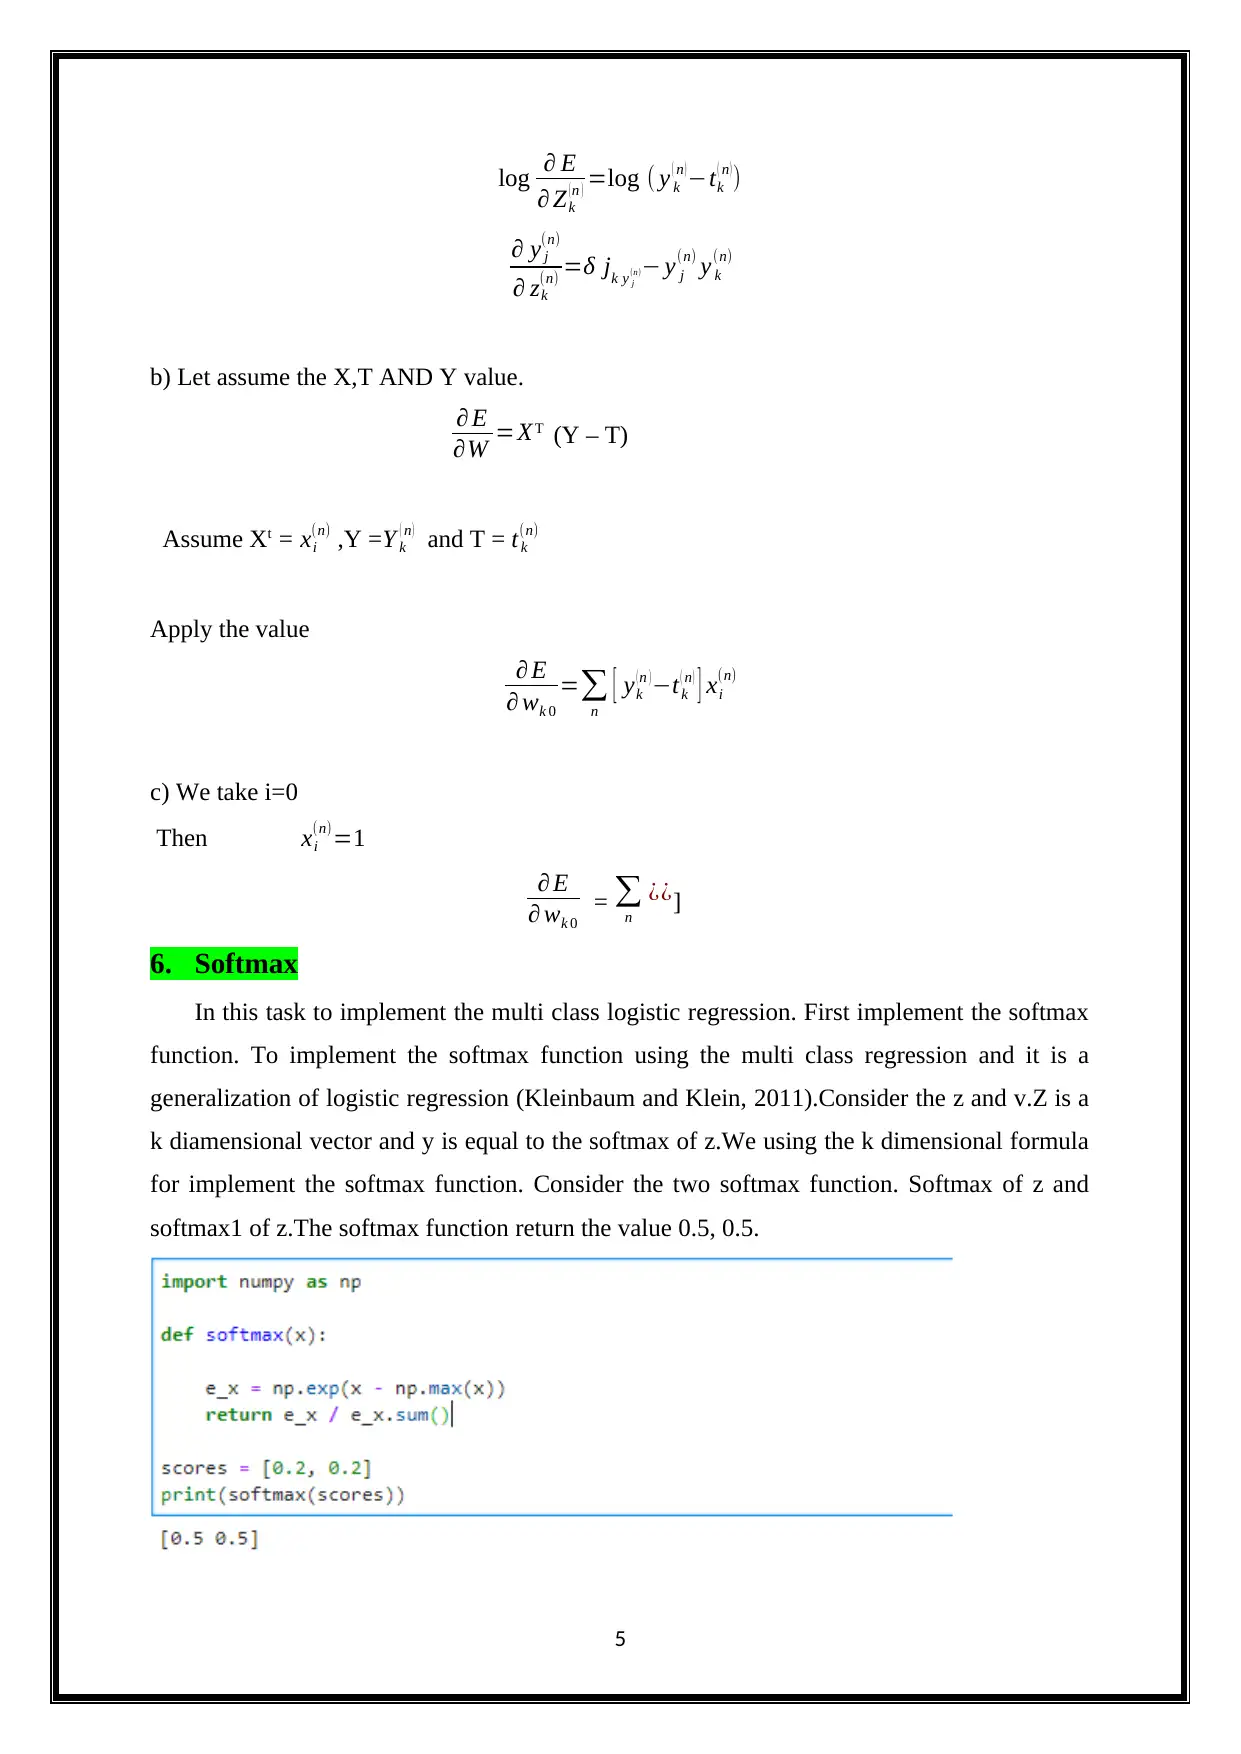
6. Softmax
In this task to implement the multi class logistic regression. First implement the softmax
function. To implement the softmax function using the multi class regression and it is a
generalization of logistic regression (Kleinbaum and Klein, 2011).Consider the z and v.Z is a
k diamensional vector and y is equal to the softmax of z.We using the k dimensional formula
for implement the softmax function. Consider the two softmax function. Softmax of z and
softmax1 of z.The softmax function return the value 0.5, 0.5.
5
∂ Zk
( n ) =log ( y k
( n )−tk
( n ))
∂ y j
(n)
∂ zk
(n) =δ jk y j
(n)− y j
(n) y k
(n)
b) Let assume the X,T AND Y value.
∂ E
∂W =XT (Y – T)
Assume Xt = xi
(n) ,Y =Y k
( n ) and T = tk
(n)
Apply the value
∂ E
∂ wk 0
=∑
n
[ yk
( n )−tk
( n ) ] xi
(n)
c) We take i=0
Then xi
(n)=1
∂ E
∂ wk 0
= ∑
n
¿¿]
6. Softmax
In this task to implement the multi class logistic regression. First implement the softmax
function. To implement the softmax function using the multi class regression and it is a
generalization of logistic regression (Kleinbaum and Klein, 2011).Consider the z and v.Z is a
k diamensional vector and y is equal to the softmax of z.We using the k dimensional formula
for implement the softmax function. Consider the two softmax function. Softmax of z and
softmax1 of z.The softmax function return the value 0.5, 0.5.
5
⊘ This is a preview!⊘
Do you want full access?
Subscribe today to unlock all pages.
Trusted by 1+ million students worldwide

The first cause to return the value and second cause warning. It return the nan, 0.The third
cause should return –inf,0 function . We compute the first element value and it return the 0.5
value The second task we do the transform vector z and z’.
b (i) Consider the z=exi and z’=exi-m
e xi
∑
j
exj = e−m
e−m
exi
∑
j
exj = exi−m
∑
j
exi−m
Hence prove the softmax (z’)=softmax(z)
b (ii) Consider the log function
Li= -log(yk)
We compute the derivation
∂ Li
∂ yk
=−∂ Li
∂ Pk
∂ Pk
∂ Y k
= −1
Pk
(Pk *(1 – Pk))
= (Pk - 1)
We compute the softmax function using the python code. We take the two vectors logy and
logy. It should return the y and logy function. The y considers to the softmax of z and logy is
consider to the log of softmax of x.
6
Paraphrase This Document
Need a fresh take? Get an instant paraphrase of this document with our AI Paraphraser
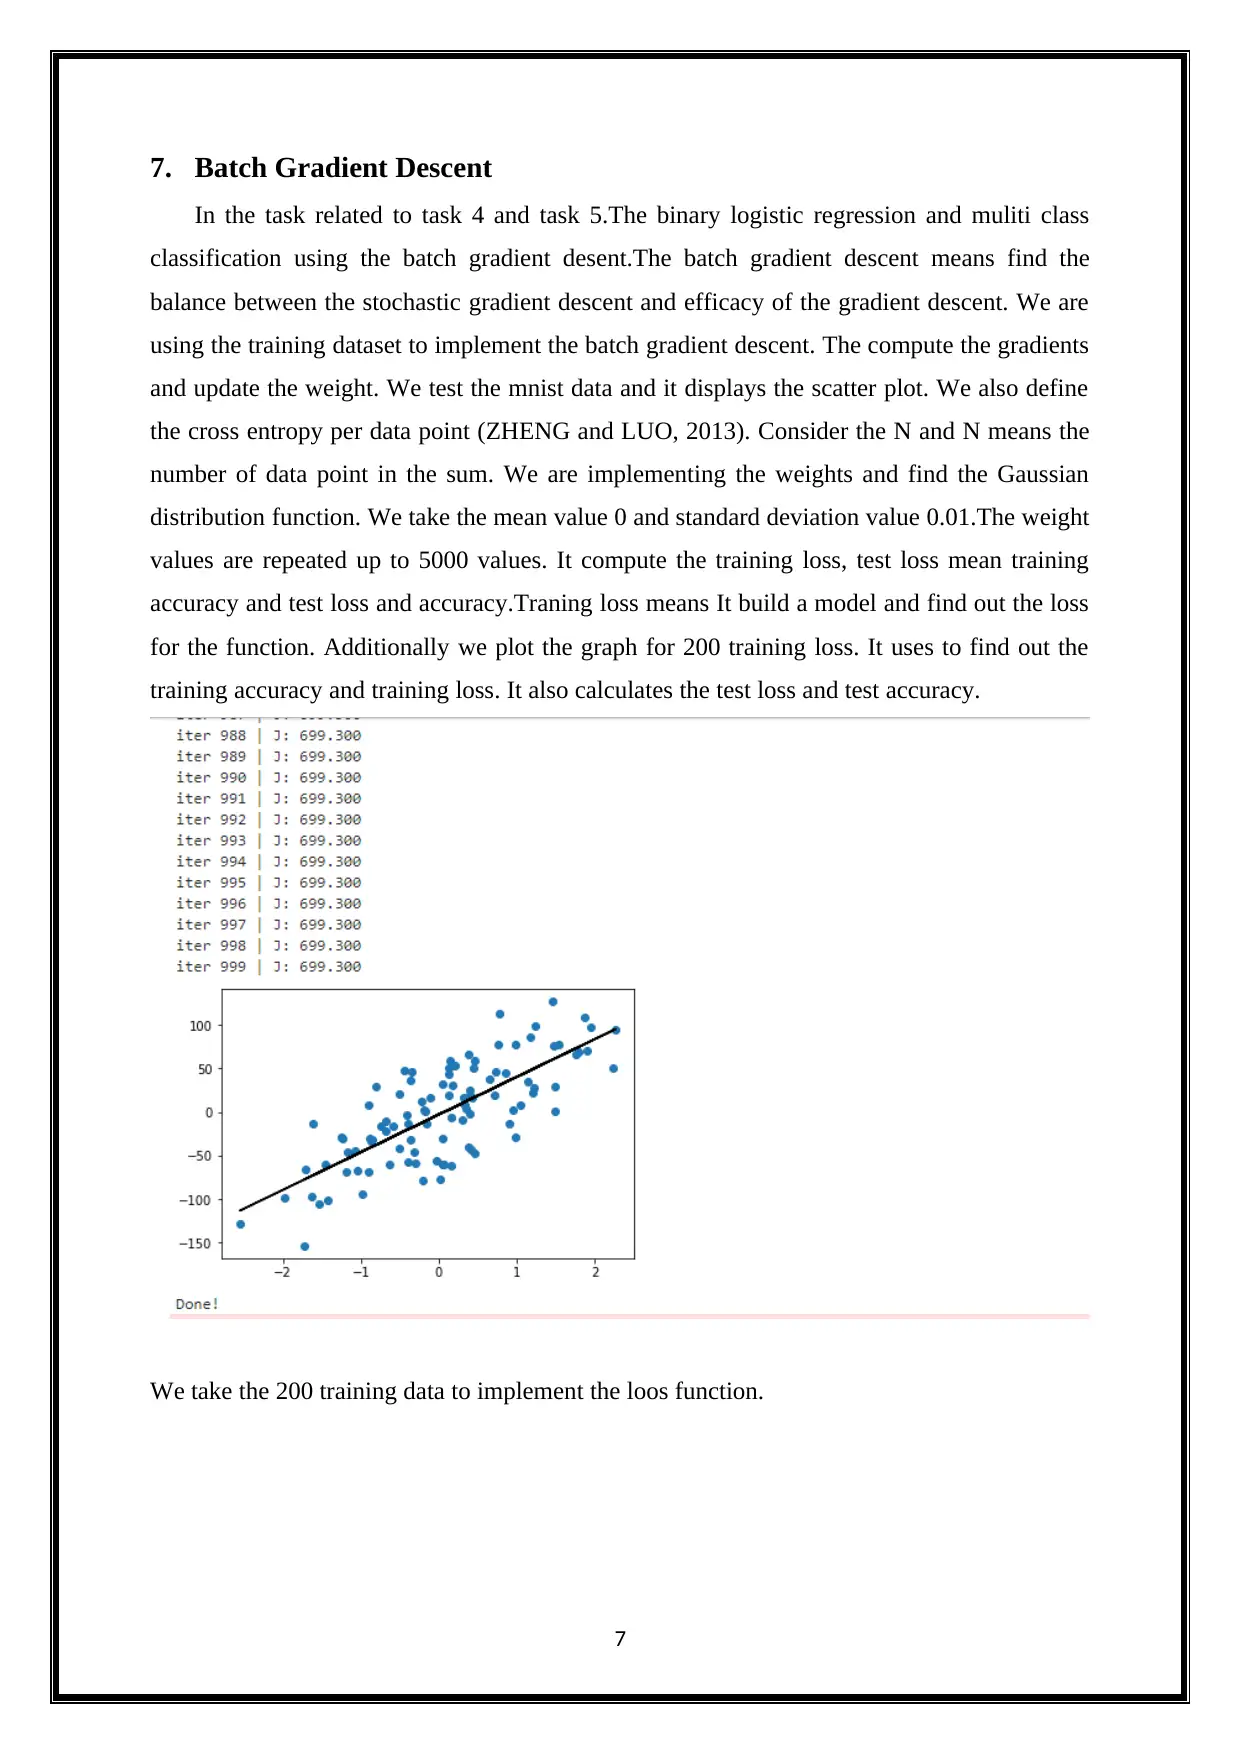
7. Batch Gradient Descent
In the task related to task 4 and task 5.The binary logistic regression and muliti class
classification using the batch gradient desent.The batch gradient descent means find the
balance between the stochastic gradient descent and efficacy of the gradient descent. We are
using the training dataset to implement the batch gradient descent. The compute the gradients
and update the weight. We test the mnist data and it displays the scatter plot. We also define
the cross entropy per data point (ZHENG and LUO, 2013). Consider the N and N means the
number of data point in the sum. We are implementing the weights and find the Gaussian
distribution function. We take the mean value 0 and standard deviation value 0.01.The weight
values are repeated up to 5000 values. It compute the training loss, test loss mean training
accuracy and test loss and accuracy.Traning loss means It build a model and find out the loss
for the function. Additionally we plot the graph for 200 training loss. It uses to find out the
training accuracy and training loss. It also calculates the test loss and test accuracy.
We take the 200 training data to implement the loos function.
7
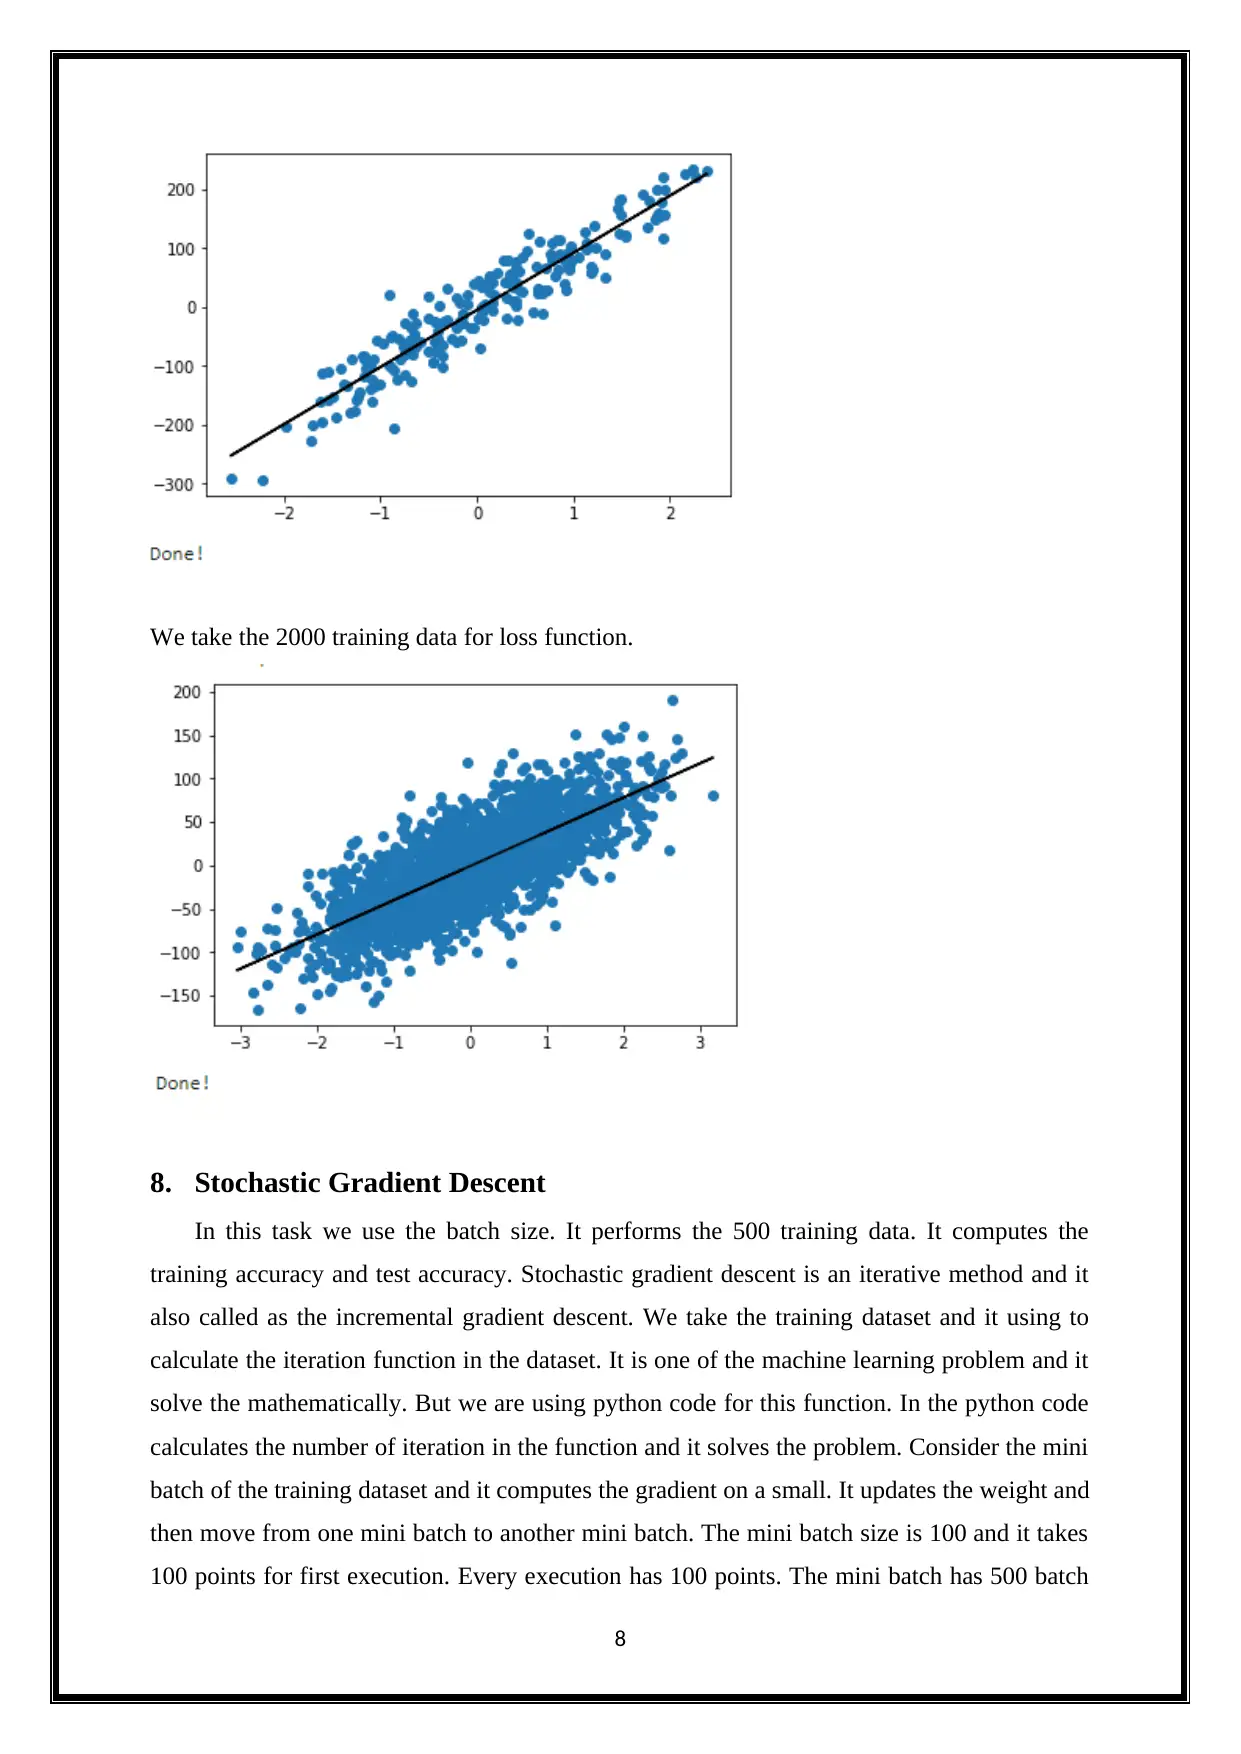
We take the 2000 training data for loss function.
8. Stochastic Gradient Descent
In this task we use the batch size. It performs the 500 training data. It computes the
training accuracy and test accuracy. Stochastic gradient descent is an iterative method and it
also called as the incremental gradient descent. We take the training dataset and it using to
calculate the iteration function in the dataset. It is one of the machine learning problem and it
solve the mathematically. But we are using python code for this function. In the python code
calculates the number of iteration in the function and it solves the problem. Consider the mini
batch of the training dataset and it computes the gradient on a small. It updates the weight and
then move from one mini batch to another mini batch. The mini batch size is 100 and it takes
100 points for first execution. Every execution has 100 points. The mini batch has 500 batch
8
⊘ This is a preview!⊘
Do you want full access?
Subscribe today to unlock all pages.
Trusted by 1+ million students worldwide
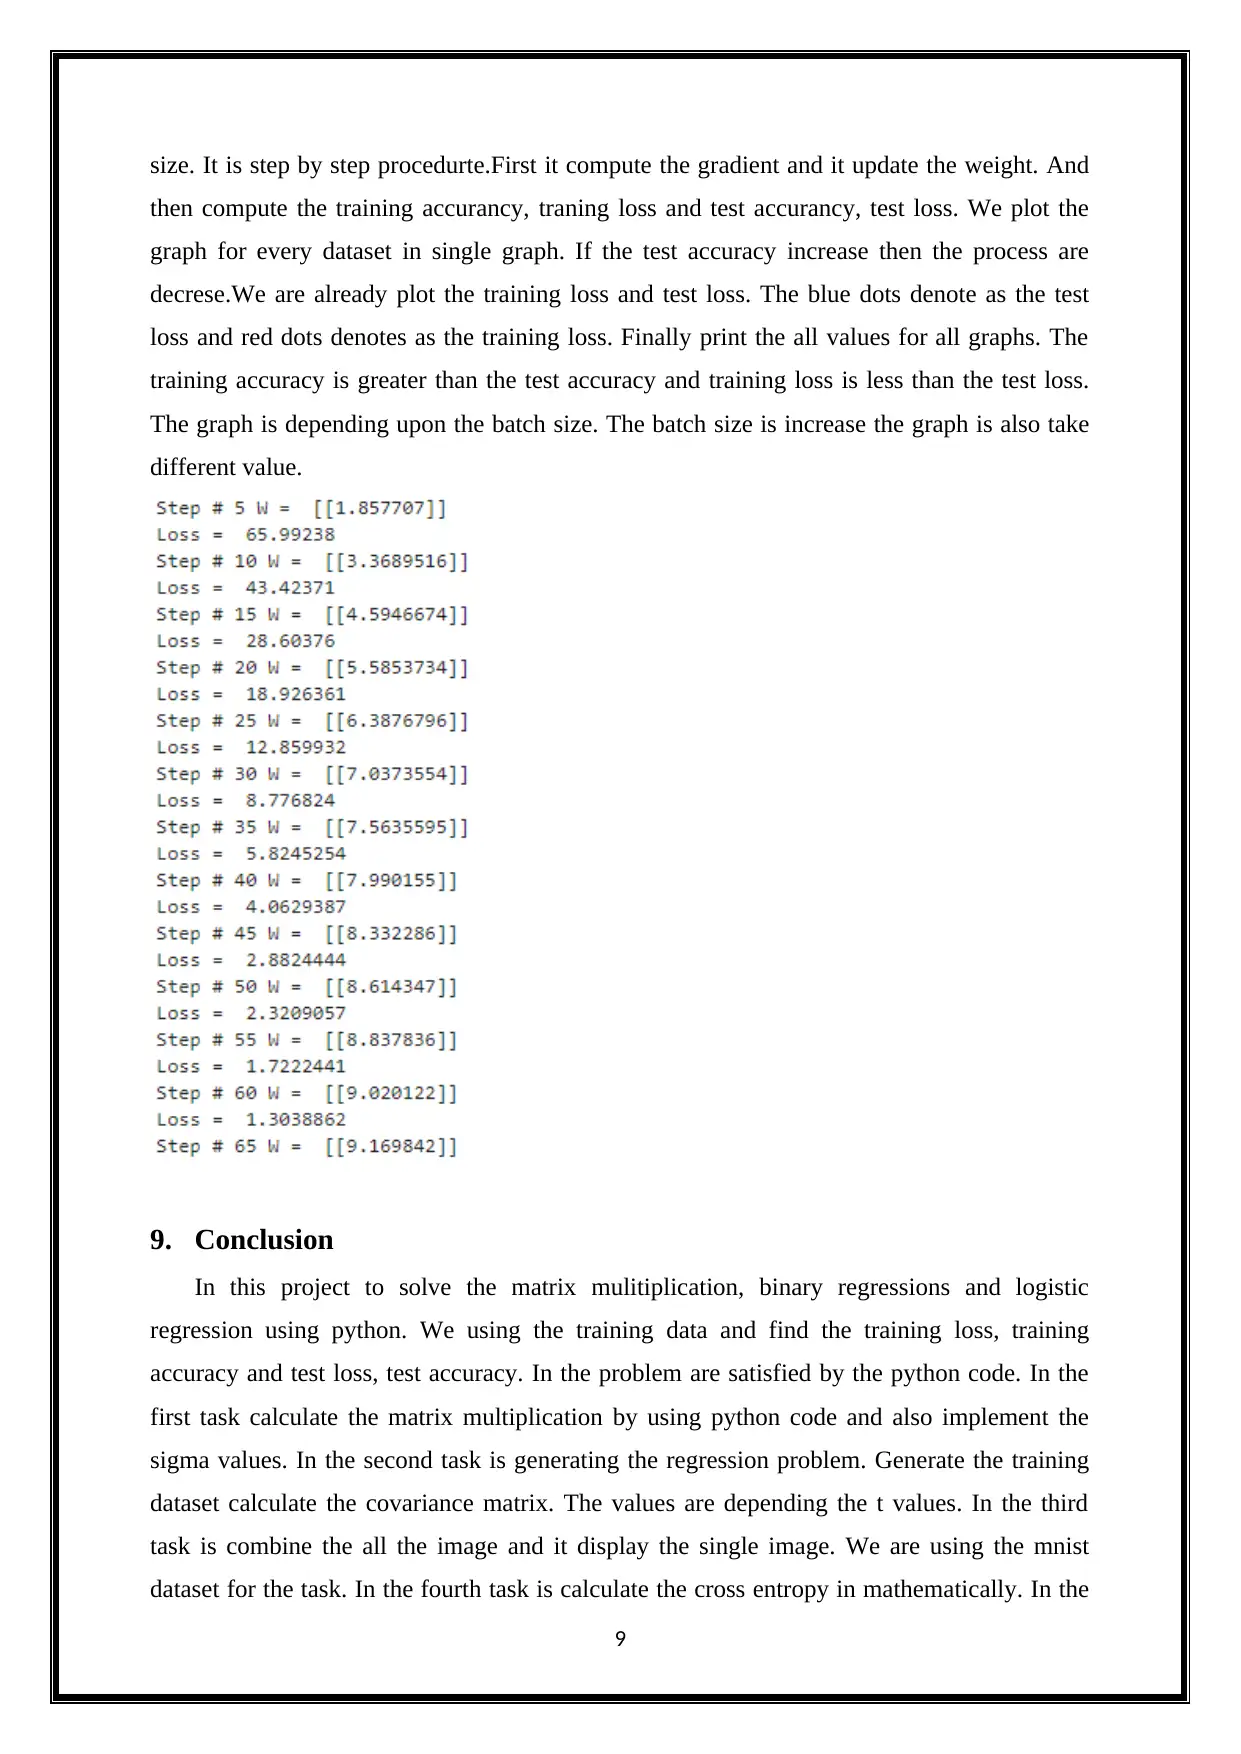
size. It is step by step procedurte.First it compute the gradient and it update the weight. And
then compute the training accurancy, traning loss and test accurancy, test loss. We plot the
graph for every dataset in single graph. If the test accuracy increase then the process are
decrese.We are already plot the training loss and test loss. The blue dots denote as the test
loss and red dots denotes as the training loss. Finally print the all values for all graphs. The
training accuracy is greater than the test accuracy and training loss is less than the test loss.
The graph is depending upon the batch size. The batch size is increase the graph is also take
different value.
9. Conclusion
In this project to solve the matrix mulitiplication, binary regressions and logistic
regression using python. We using the training data and find the training loss, training
accuracy and test loss, test accuracy. In the problem are satisfied by the python code. In the
first task calculate the matrix multiplication by using python code and also implement the
sigma values. In the second task is generating the regression problem. Generate the training
dataset calculate the covariance matrix. The values are depending the t values. In the third
task is combine the all the image and it display the single image. We are using the mnist
dataset for the task. In the fourth task is calculate the cross entropy in mathematically. In the
9
Paraphrase This Document
Need a fresh take? Get an instant paraphrase of this document with our AI Paraphraser

fifth task is softmax.It depending the multi class logistic regression. We using the two
softmax value and generate by the python code. In the sixth task is batch gradient descent. It
is based on the multi class logistic regression and gradient descent. We are using the minst
dataset for the task. It also implement by the python code. We find the training accuracy
dataset is greater than the test accuracy and training loss is less than the test loss. We plot the
graph depend the mnist dataset. In the last task is stochastic gradient descent. It depending the
batch size and plot the graph depending the batch size. It also computes the training accuracy,
test accuracy and training loss, test loss.
10
References
Allison, P. and Allison, P. (2012). Logistic regression using SAS. Cary, NC: SAS Institute.
Feng, W., Sarkar, A., Lim, C. and Maiti, T. (2016). Variable selection for binary spatial
regression: Penalized quasi-likelihood approach. Biometrics, 72(4), pp.1164-1172.
Gusev, M. and Ristov, S. (2013). A superlinear speedup region for matrix
multiplication. Concurrency and Computation: Practice and Experience, 26(11), pp.1847-
1868.
Huang, T. (2012). Neural information processing. Heidelberg: Springer.
Kleinbaum, D. and Klein, M. (2011). Logistic regression. New York: Springer.
ZHENG, X. and LUO, Y. (2013). Improved clonal selection algorithm for multi-class data
classification. Journal of Computer Applications, 32(11), pp.3201-3205.
11
⊘ This is a preview!⊘
Do you want full access?
Subscribe today to unlock all pages.
Trusted by 1+ million students worldwide
1 out of 15

Your All-in-One AI-Powered Toolkit for Academic Success.
+13062052269
info@desklib.com
Available 24*7 on WhatsApp / Email
![[object Object]](/_next/static/media/star-bottom.7253800d.svg)
Unlock your academic potential
Copyright © 2020–2026 A2Z Services. All Rights Reserved. Developed and managed by ZUCOL.