Statistical Analysis of Blood Pressure, Sports, and Car Sales Data

Verified

Added on  2023/01/11

|4
|970
|46
Homework Assignment
AI Summary
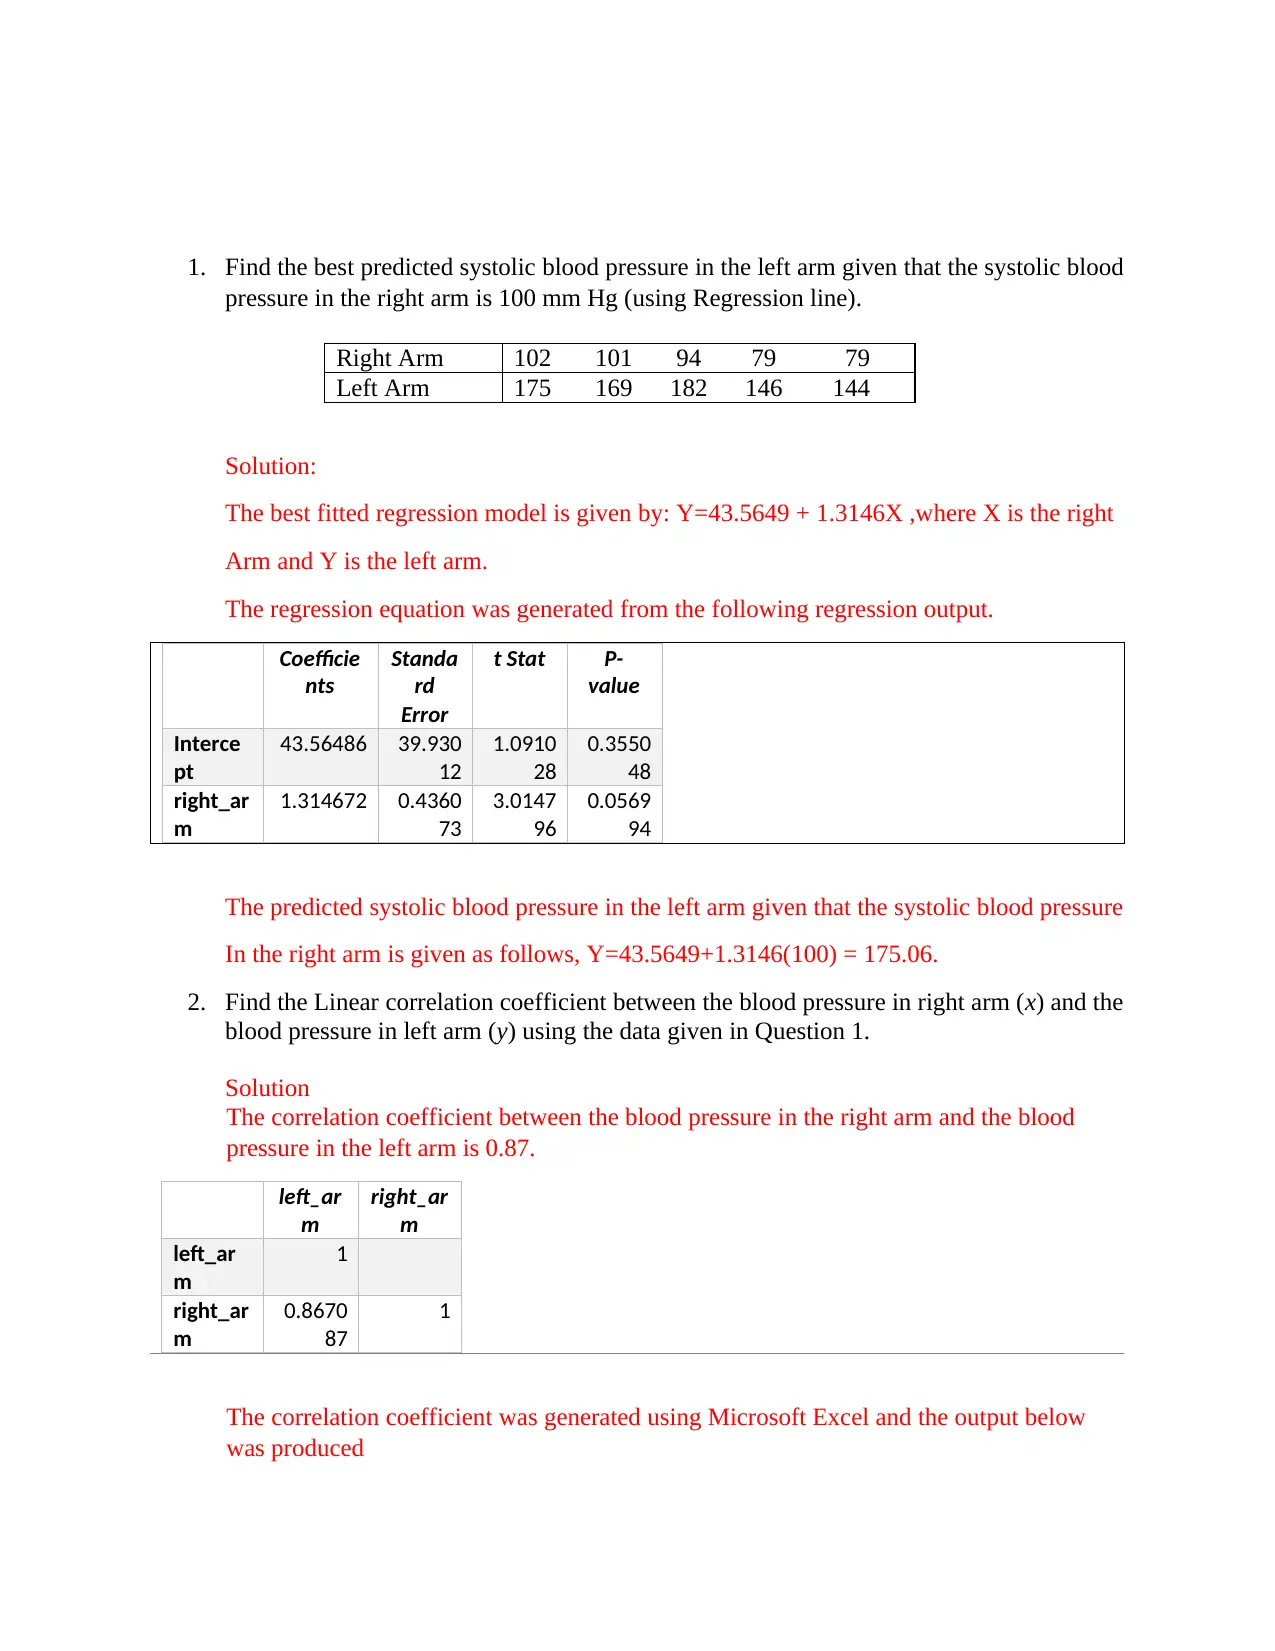
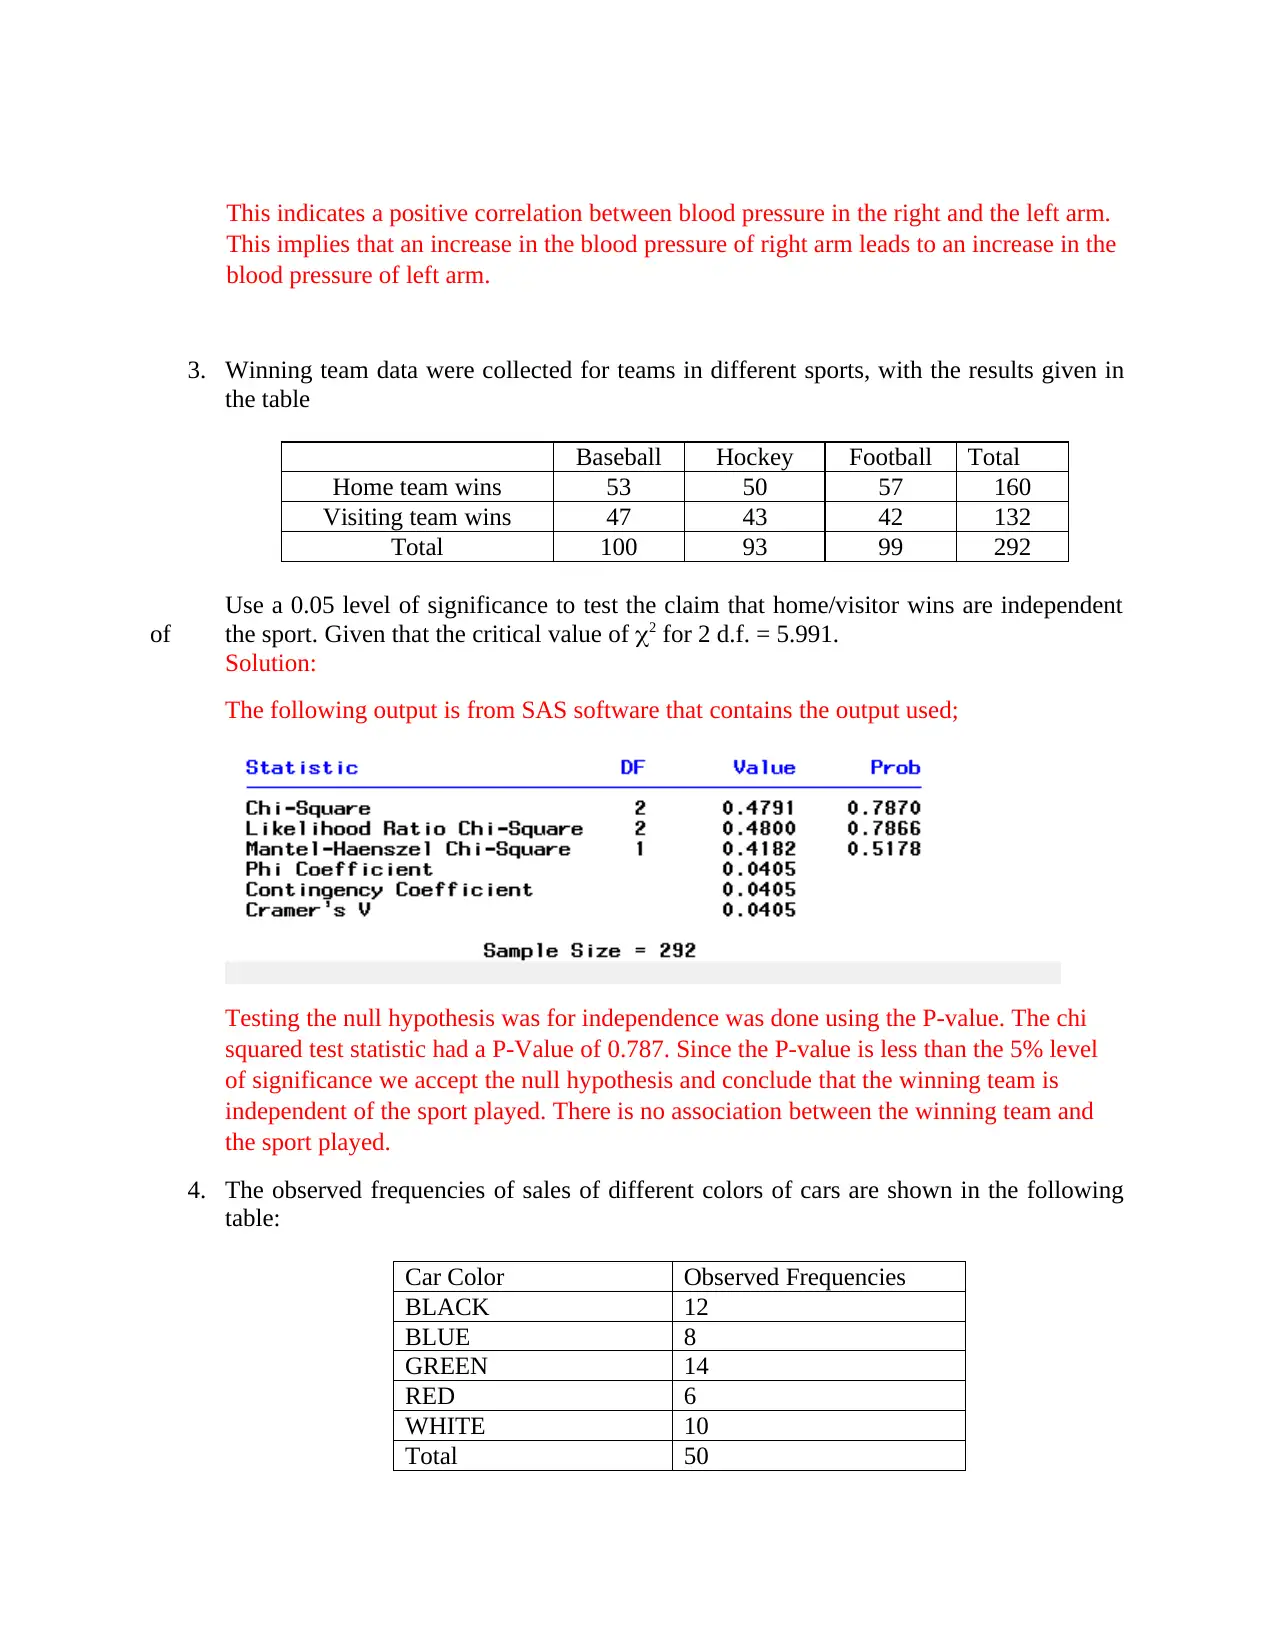
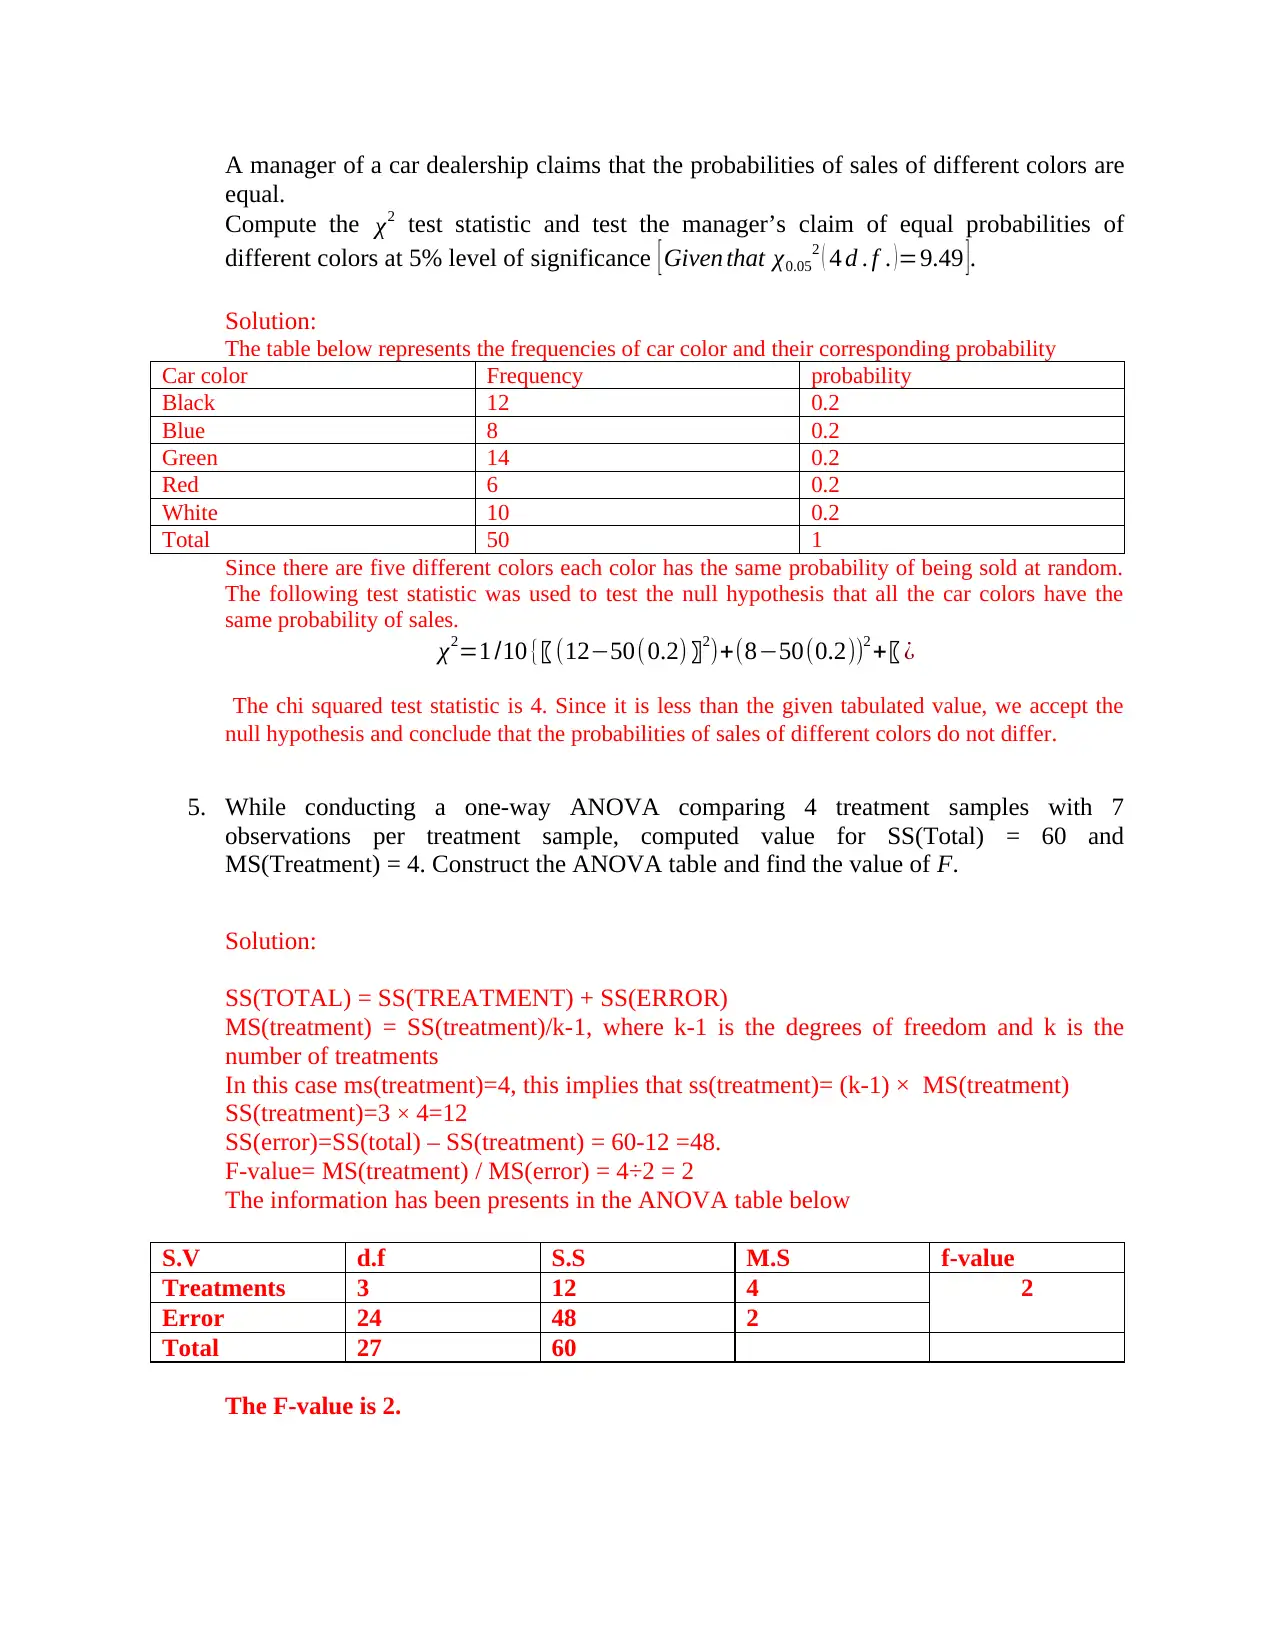
This statistics assignment provides detailed solutions to several problems. The first problem involves finding the predicted systolic blood pressure in the left arm using a regression line, given the systolic blood pressure in the right arm. The second problem calculates the linear correlation coefficient between blood pressures in the right and left arms. The third problem uses a chi-squared test to determine if home/visitor wins are independent of the sport played. The fourth problem calculates a chi-squared test statistic to assess if car sales of different colors have equal probabilities. The fifth problem constructs an ANOVA table and calculates the F-value for a one-way ANOVA. The final problem involves finding the F-test statistic value given sample data.
Document Page
1. Find the best predicted systolic blood pressure in the left arm given that the systolic blood
pressure in the right arm is 100 mm Hg (using Regression line).
Right Arm 102 101 94 79 79
Left Arm 175 169 182 146 144
Solution:
The best fitted regression model is given by: Y=43.5649 + 1.3146X ,where X is the right
Arm and Y is the left arm.
The regression equation was generated from the following regression output.
Coefficie
nts
Standa
rd
Error
t Stat P-
value
Interce
pt
43.56486 39.930
12
1.0910
28
0.3550
48
right_ar
m
1.314672 0.4360
73
3.0147
96
0.0569
94
The predicted systolic blood pressure in the left arm given that the systolic blood pressure
In the right arm is given as follows, Y=43.5649+1.3146(100) = 175.06.
2. Find the Linear correlation coefficient between the blood pressure in right arm (x) and the
blood pressure in left arm (y) using the data given in Question 1.
Solution
The correlation coefficient between the blood pressure in the right arm and the blood
pressure in the left arm is 0.87.
left_ar
m
right_ar
m
left_ar
m
1
right_ar
m
0.8670
87
1
The correlation coefficient was generated using Microsoft Excel and the output below
was produced
tabler-icon-diamond-filled.svg

Secure Best Marks with AI Grader

Need help grading? Try our AI Grader for instant feedback on your assignments.
Document Page
This indicates a positive correlation between blood pressure in the right and the left arm.
This implies that an increase in the blood pressure of right arm leads to an increase in the
blood pressure of left arm.
3. Winning team data were collected for teams in different sports, with the results given in
the table
Baseball Hockey Football Total
Home team wins 53 50 57 160
Visiting team wins 47 43 42 132
Total 100 93 99 292
Use a 0.05 level of significance to test the claim that home/visitor wins are independent
of the sport. Given that the critical value of 2 for 2 d.f. = 5.991.
Solution:
The following output is from SAS software that contains the output used;
Testing the null hypothesis was for independence was done using the P-value. The chi
squared test statistic had a P-Value of 0.787. Since the P-value is less than the 5% level
of significance we accept the null hypothesis and conclude that the winning team is
independent of the sport played. There is no association between the winning team and
the sport played.
4. The observed frequencies of sales of different colors of cars are shown in the following
table:
Car Color Observed Frequencies
BLACK 12
BLUE 8
GREEN 14
RED 6
WHITE 10
Total 50
Document Page
A manager of a car dealership claims that the probabilities of sales of different colors are
equal.
Compute the χ2 test statistic and test the manager’s claim of equal probabilities of
different colors at 5% level of significance [ Given that χ0.05
2 ( 4 d . f . )=9.49 ].
Solution:
The table below represents the frequencies of car color and their corresponding probability
Car color Frequency probability
Black 12 0.2
Blue 8 0.2
Green 14 0.2
Red 6 0.2
White 10 0.2
Total 50 1
Since there are five different colors each color has the same probability of being sold at random.
The following test statistic was used to test the null hypothesis that all the car colors have the
same probability of sales.
χ2=1 /10 { (1250(0.2) 2)+(850(0.2))2 + ¿
The chi squared test statistic is 4. Since it is less than the given tabulated value, we accept the
null hypothesis and conclude that the probabilities of sales of different colors do not differ.
5. While conducting a one-way ANOVA comparing 4 treatment samples with 7
observations per treatment sample, computed value for SS(Total) = 60 and
MS(Treatment) = 4. Construct the ANOVA table and find the value of F.
Solution:
SS(TOTAL) = SS(TREATMENT) + SS(ERROR)
MS(treatment) = SS(treatment)/k-1, where k-1 is the degrees of freedom and k is the
number of treatments
In this case ms(treatment)=4, this implies that ss(treatment)= (k-1) × MS(treatment)
SS(treatment)=3 × 4=12
SS(error)=SS(total) – SS(treatment) = 60-12 =48.
F-value= MS(treatment) / MS(error) = 4÷2 = 2
The information has been presents in the ANOVA table below
S.V d.f S.S M.S f-value
Treatments 3 12 4 2
Error 24 48 2
Total 27 60
The F-value is 2.
Document Page
6. Given the sample data below, find the F -test statistic value
Solution:
SS(Treatment) = {1/4 {( 3 ×2 )2 + ( 4 ×3 )2 + ( 4 ×4 )2 }362 /12}=¿8
MS(Treatment)=8÷2=4
SS(Total)= 130-362 /12=22
SS(Error)= SS(Total)- SS(Treatment)= ( 224=18 )
MSE= ( 18 ÷ 9 )=2 , where 9 is the degree of freedom of error sum of squares
F-VALUE=MS(TREATMENT)/MS(ERROR)=4÷2=2
The F-test statistic is 2.
Sample 1 Sample 2 Sample 3
n 4 4 4
Mean 2.0 3.0 4.0
Variance s2 0.75 1.00 1.25
chevron_up_icon
1 out of 4
circle_padding
hide_on_mobile
zoom_out_icon
[object Object]