Data Analysis Project: Correlation, Regression, and T-tests
VerifiedAdded on 2022/09/08
|10
|975
|17
Homework Assignment
AI Summary
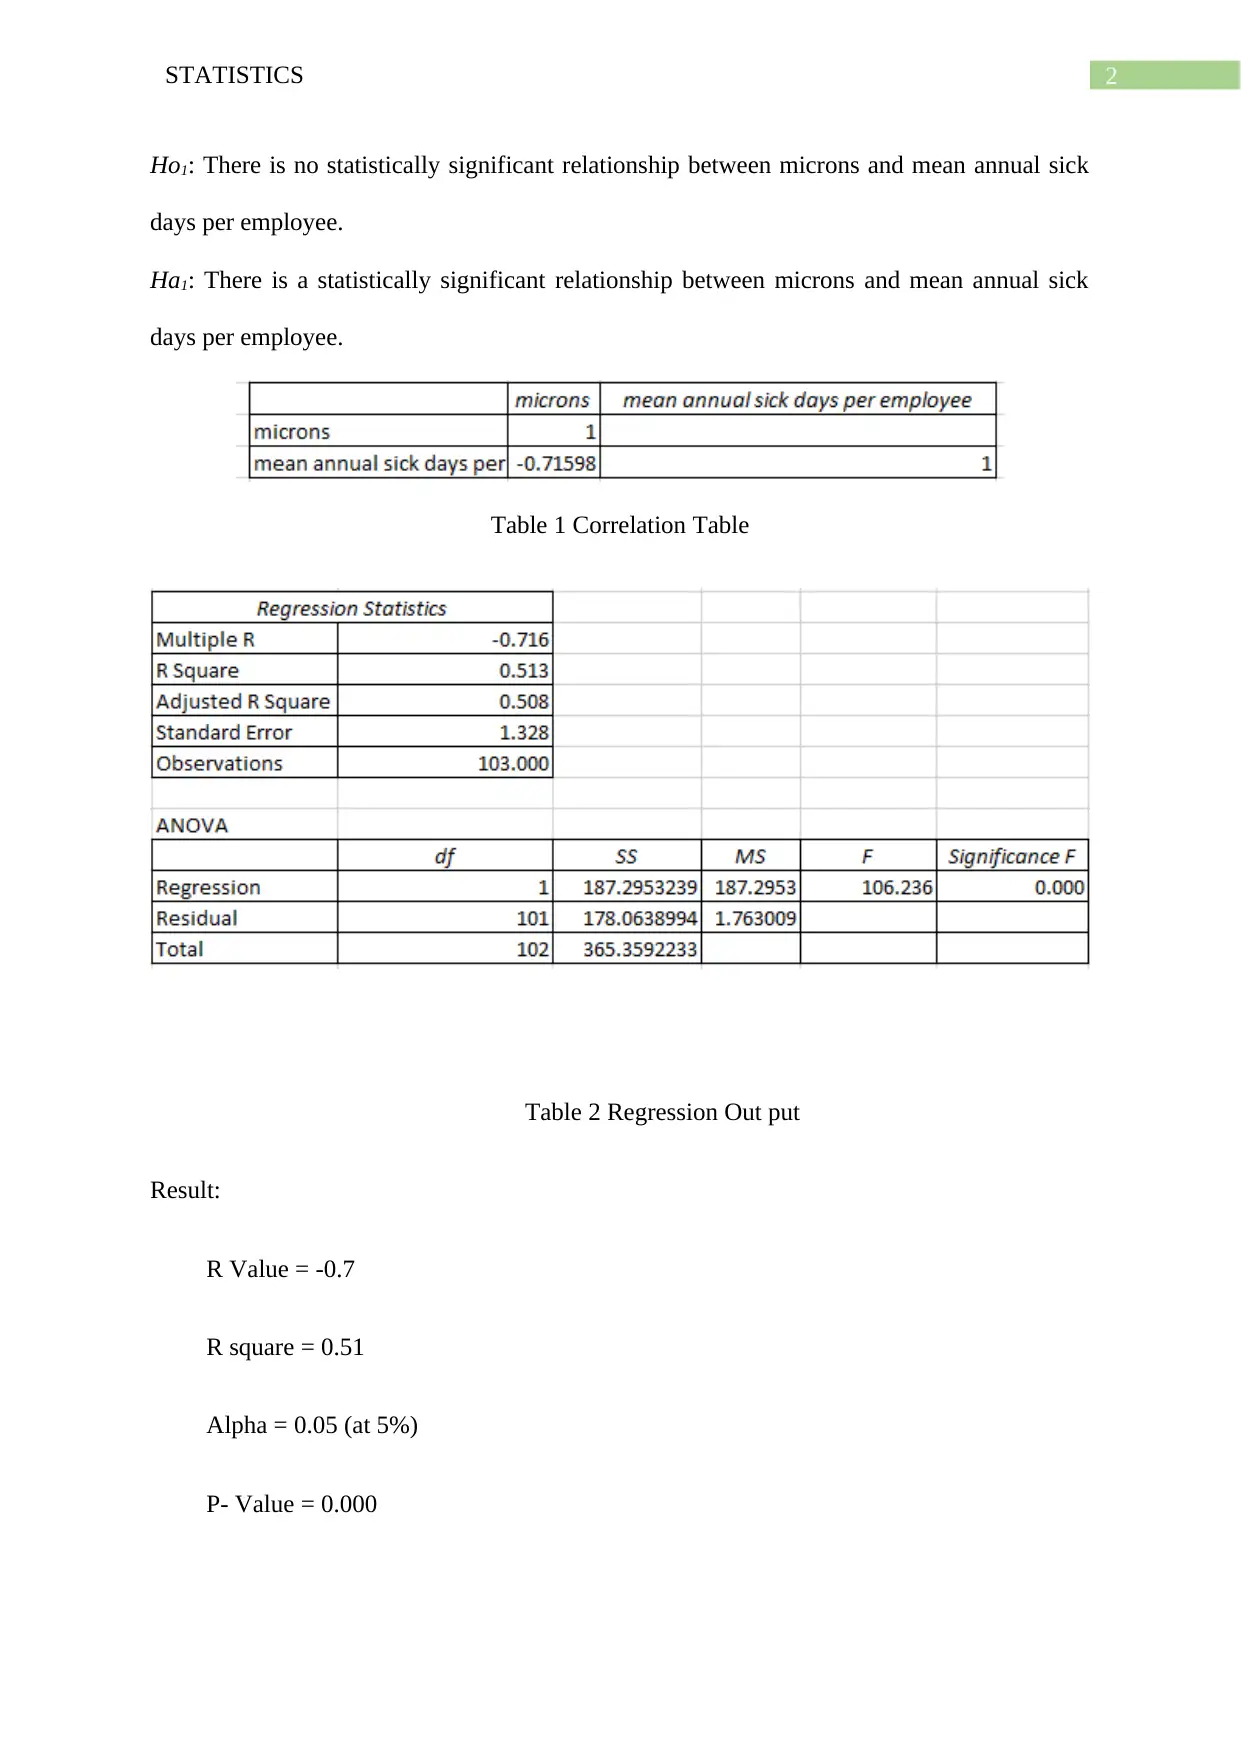
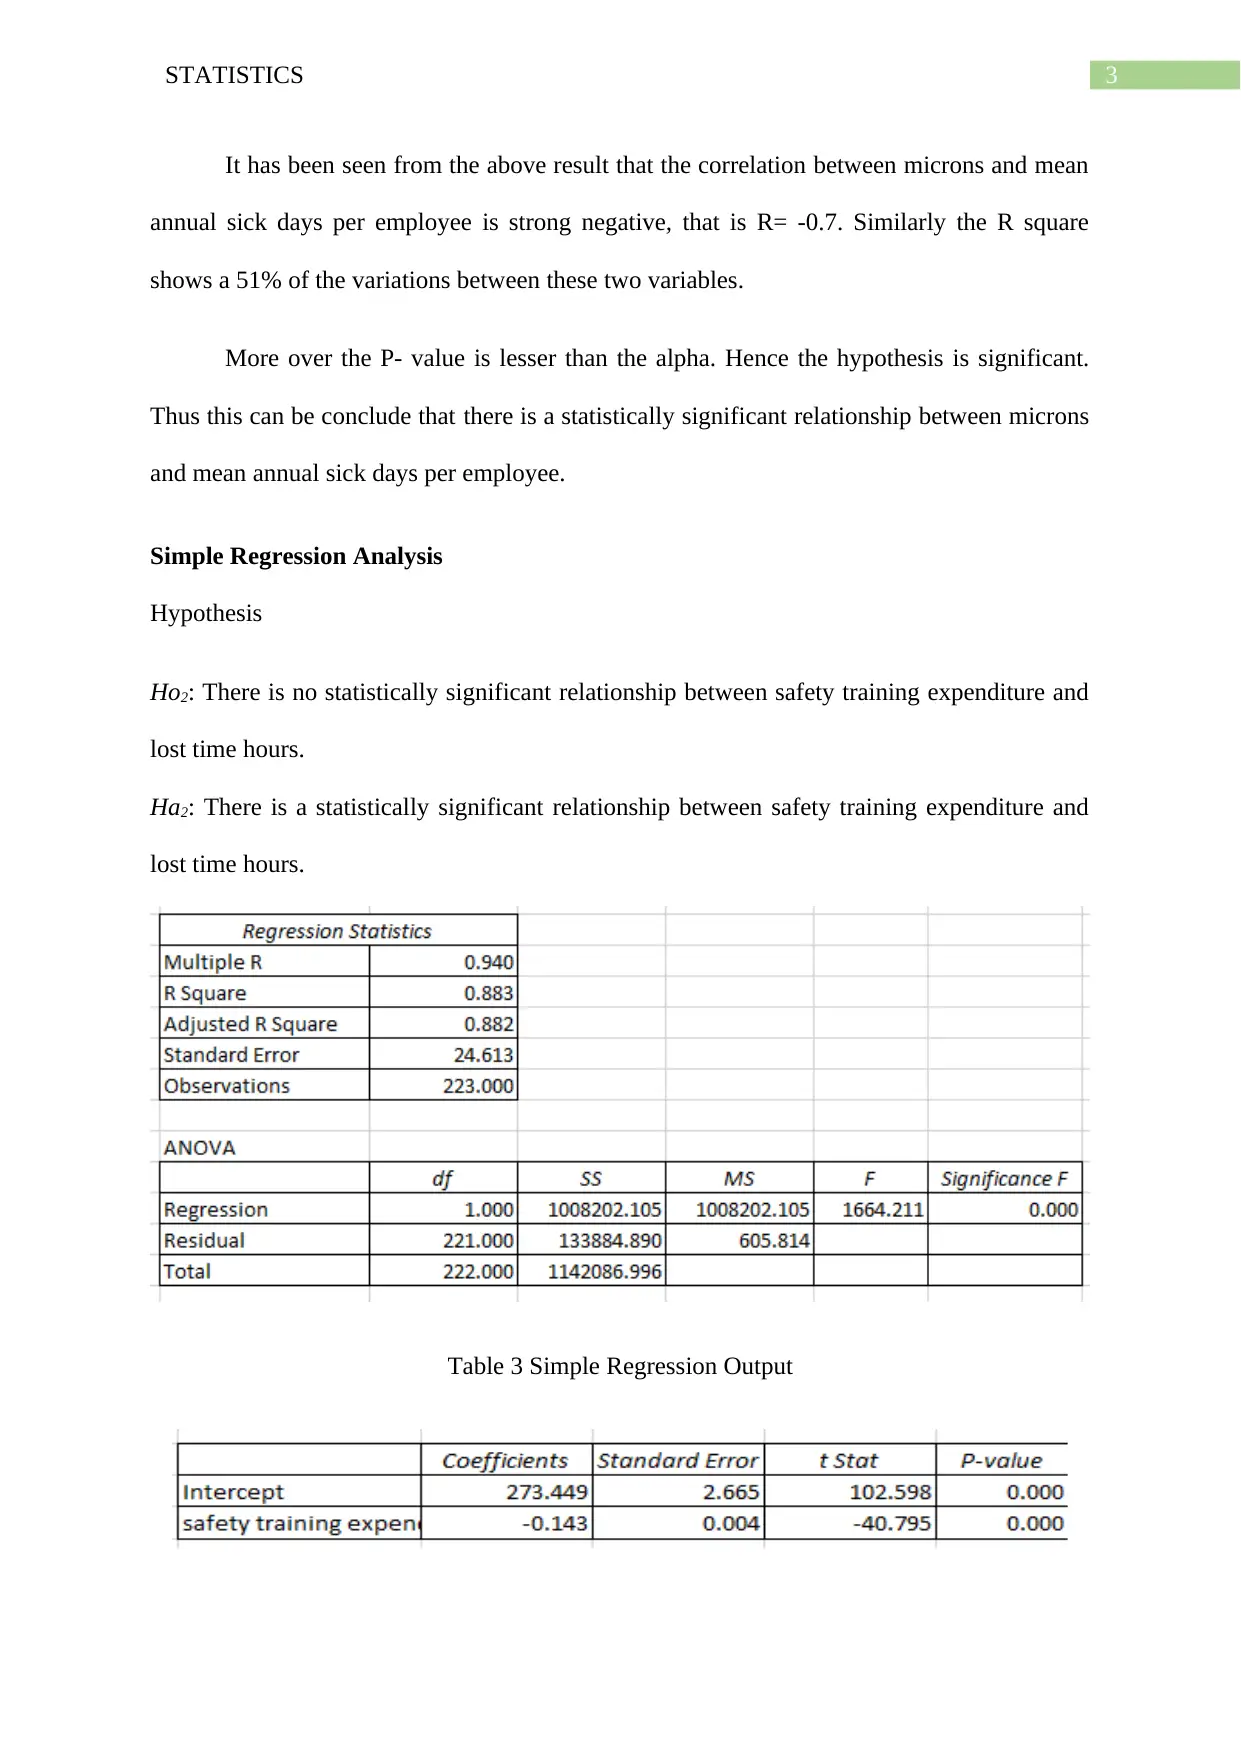
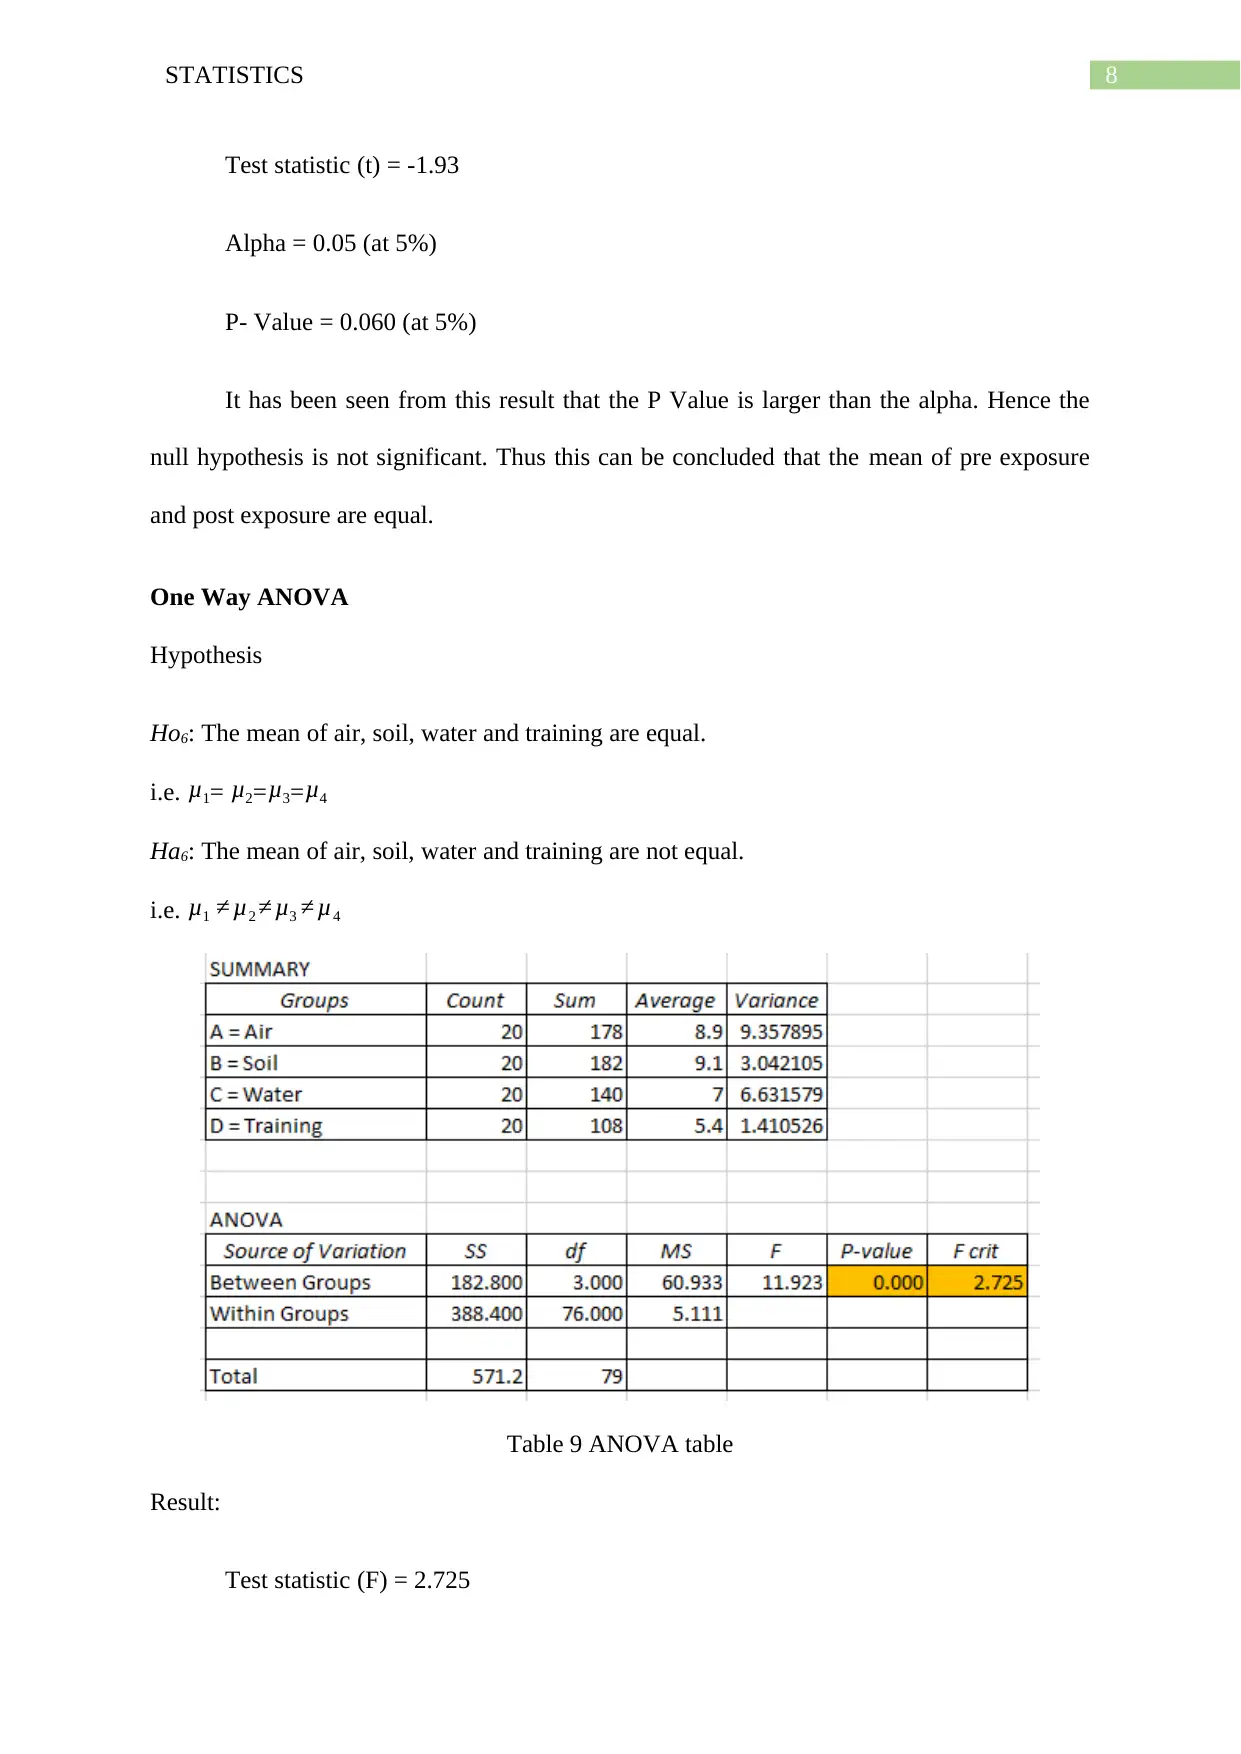
This statistics assignment presents a comprehensive analysis of the Sun Coast Remediation dataset, employing various statistical techniques to test hypotheses. The assignment encompasses correlation analysis, simple and multiple regression analyses, independent and paired sample t-tests, and one-way ANOVA. Each analysis includes the formulation of null and alternative hypotheses, presentation of statistical output tables, and interpretation of results, including r values, R-squared, alpha levels, and p-values. The document provides detailed explanations of the findings, determining the statistical significance of relationships between variables and drawing conclusions based on the data. Regression equations are also presented and discussed. The assignment demonstrates a strong understanding of statistical methods and the ability to apply them to real-world data analysis.

Running head: STATISTICS
Statistics
Name of the Student:
Name of the University:
Author note:
Table of Contents
Statistics
Name of the Student:
Name of the University:
Author note:
Table of Contents
Paraphrase This Document
Need a fresh take? Get an instant paraphrase of this document with our AI Paraphraser

1STATISTICS
Correlation Analysis...................................................................................................................2
Simple Regression Analysis.......................................................................................................3
Multiple Regression Analysis....................................................................................................4
Independent sample t test...........................................................................................................5
Paired sample T test...................................................................................................................6
One Way ANOVA.....................................................................................................................7
Bibliography...............................................................................................................................9
Correlation Analysis
Hypothesis

2STATISTICS
Ho1: There is no statistically significant relationship between microns and mean annual sick
days per employee.
Ha1: There is a statistically significant relationship between microns and mean annual sick
days per employee.
Table 1 Correlation Table
Table 2 Regression Out put
Result:
R Value = -0.7
R square = 0.51
Alpha = 0.05 (at 5%)
P- Value = 0.000
⊘ This is a preview!⊘
Do you want full access?
Subscribe today to unlock all pages.

Trusted by 1+ million students worldwide

3STATISTICS
It has been seen from the above result that the correlation between microns and mean
annual sick days per employee is strong negative, that is R= -0.7. Similarly the R square
shows a 51% of the variations between these two variables.
More over the P- value is lesser than the alpha. Hence the hypothesis is significant.
Thus this can be conclude that there is a statistically significant relationship between microns
and mean annual sick days per employee.
Simple Regression Analysis
Hypothesis
Ho2: There is no statistically significant relationship between safety training expenditure and
lost time hours.
Ha2: There is a statistically significant relationship between safety training expenditure and
lost time hours.
Table 3 Simple Regression Output
Paraphrase This Document
Need a fresh take? Get an instant paraphrase of this document with our AI Paraphraser

4STATISTICS
Table 4 Regression coefficient
Result:
R Value = 0.94
R- Square = 0.88
Alpha level = 0.05 (at 5%)
F- Statistic = 1664.21
P – Value = 0.000
The above result shows that the P value is lesser than the alpha. Hence the hypothesis
is significant. Thus this can be concluded at 5% significance level that there is a statistically
significant relationship between safety training expenditure and lost time hours.
Regression equation:
Y= -0.413x + 273.449
Where
Y = lost time hours
X = Safety training expenditure
Multiple Regression Analysis
Hypothesis
Ho3: There is no statistically significant relationship between frequency and angle in degrees,
chord length, velocity, displacement and decibel.
Ha3: There is a statistically significant relationship between frequency and angle in degrees,
chord length, velocity, displacement and decibel.

5STATISTICS
Table 5 Multiple Regression Output
Table 6 Multiple Regression coefficient
R Value = 0.58
R- Square = 0.34
Alpha level = 0.05 (at 5%)
F- Statistic = 154.73
P – Value = 0.000
The above result shows that the P- value is lesser than the alpha. Hence the hypothesis
is significant. Thus this can be concluded at 5% significance level that there is a statistically
significant relationship between frequency and angle in degrees, chord length, velocity,
displacement and decibel.
⊘ This is a preview!⊘
Do you want full access?
Subscribe today to unlock all pages.

Trusted by 1+ million students worldwide

6STATISTICS
Y= 32243.94- 86.46 X1-741.56 X2 +42.06 X3 – 65093.43 X4 – 241.11 X5
Where
Y = Frequency
X1= Angle in degrees
X2= Chord length
X3= Velocity
X4 = Displacement
X5 = Decibel
Independent sample t test
Hypothesis
Ho4: The mean of prior training and revised training score are equal.
i.e. μ1= μ2
Ha4: The mean of prior training and revised training score are not equal.
i.e. μ1 ≠ μ2
Table 7 Independent sample t test
Result:
Paraphrase This Document
Need a fresh take? Get an instant paraphrase of this document with our AI Paraphraser

7STATISTICS
Test statistic (t) = -9.667
Alpha = 0.05 (at 5%)
P- Value = 0.000 (at 5%)
It has been seen from this result that the P Value is lesser than the alpha. Hence the
null hypothesis is significant. Thus this can be concluded that the mean of prior training and
revised training score are not equal.
Paired sample T test
Hypothesis
Ho5: The mean of pre exposure and post exposure are equal.
i.e. μ1= μ2
Ha5: The mean of pre exposure and post exposure are equal.
i.e. μ1 ≠ μ2
Table 8 paired sample t test
Result:

8STATISTICS
Test statistic (t) = -1.93
Alpha = 0.05 (at 5%)
P- Value = 0.060 (at 5%)
It has been seen from this result that the P Value is larger than the alpha. Hence the
null hypothesis is not significant. Thus this can be concluded that the mean of pre exposure
and post exposure are equal.
One Way ANOVA
Hypothesis
Ho6: The mean of air, soil, water and training are equal.
i.e. μ1= μ2=μ3=μ4
Ha6: The mean of air, soil, water and training are not equal.
i.e. μ1 ≠ μ2 ≠ μ3 ≠ μ4
Table 9 ANOVA table
Result:
Test statistic (F) = 2.725
⊘ This is a preview!⊘
Do you want full access?
Subscribe today to unlock all pages.

Trusted by 1+ million students worldwide

9STATISTICS
Alpha = 0.05 (at 5%)
P- Value = 0.000 (at 5%)
It has been seen from this result that the P Value is lesser than the alpha. Hence the null
hypothesis is significant. Thus this can be concluded that the mean of air, soil, water and
training are not equal.
Bibliography
Cameron, A. C., & Trivedi, P. K. (2013). Regression analysis of count data (Vol. 53).
Cambridge university press.
Chatterjee, S., & Hadi, A. S. (2015). Regression analysis by example. John Wiley & Sons.
De Winter, J. C. (2013). Using the Student's t-test with extremely small sample sizes.
Practical Assessment, Research & Evaluation, 18(10).
Lakens, D. (2013). Calculating and reporting effect sizes to facilitate cumulative science: a
practical primer for t-tests and ANOVAs. Frontiers in psychology, 4, 863.
1 out of 10
Related Documents

Your All-in-One AI-Powered Toolkit for Academic Success.
+13062052269
info@desklib.com
Available 24*7 on WhatsApp / Email
Unlock your academic potential
Copyright © 2020–2025 A2Z Services. All Rights Reserved. Developed and managed by ZUCOL.