University Economics: MAE256 T2 2019 Assignment on Regression Analysis
VerifiedAdded on 2022/10/15
|5
|1017
|16
Homework Assignment
AI Summary
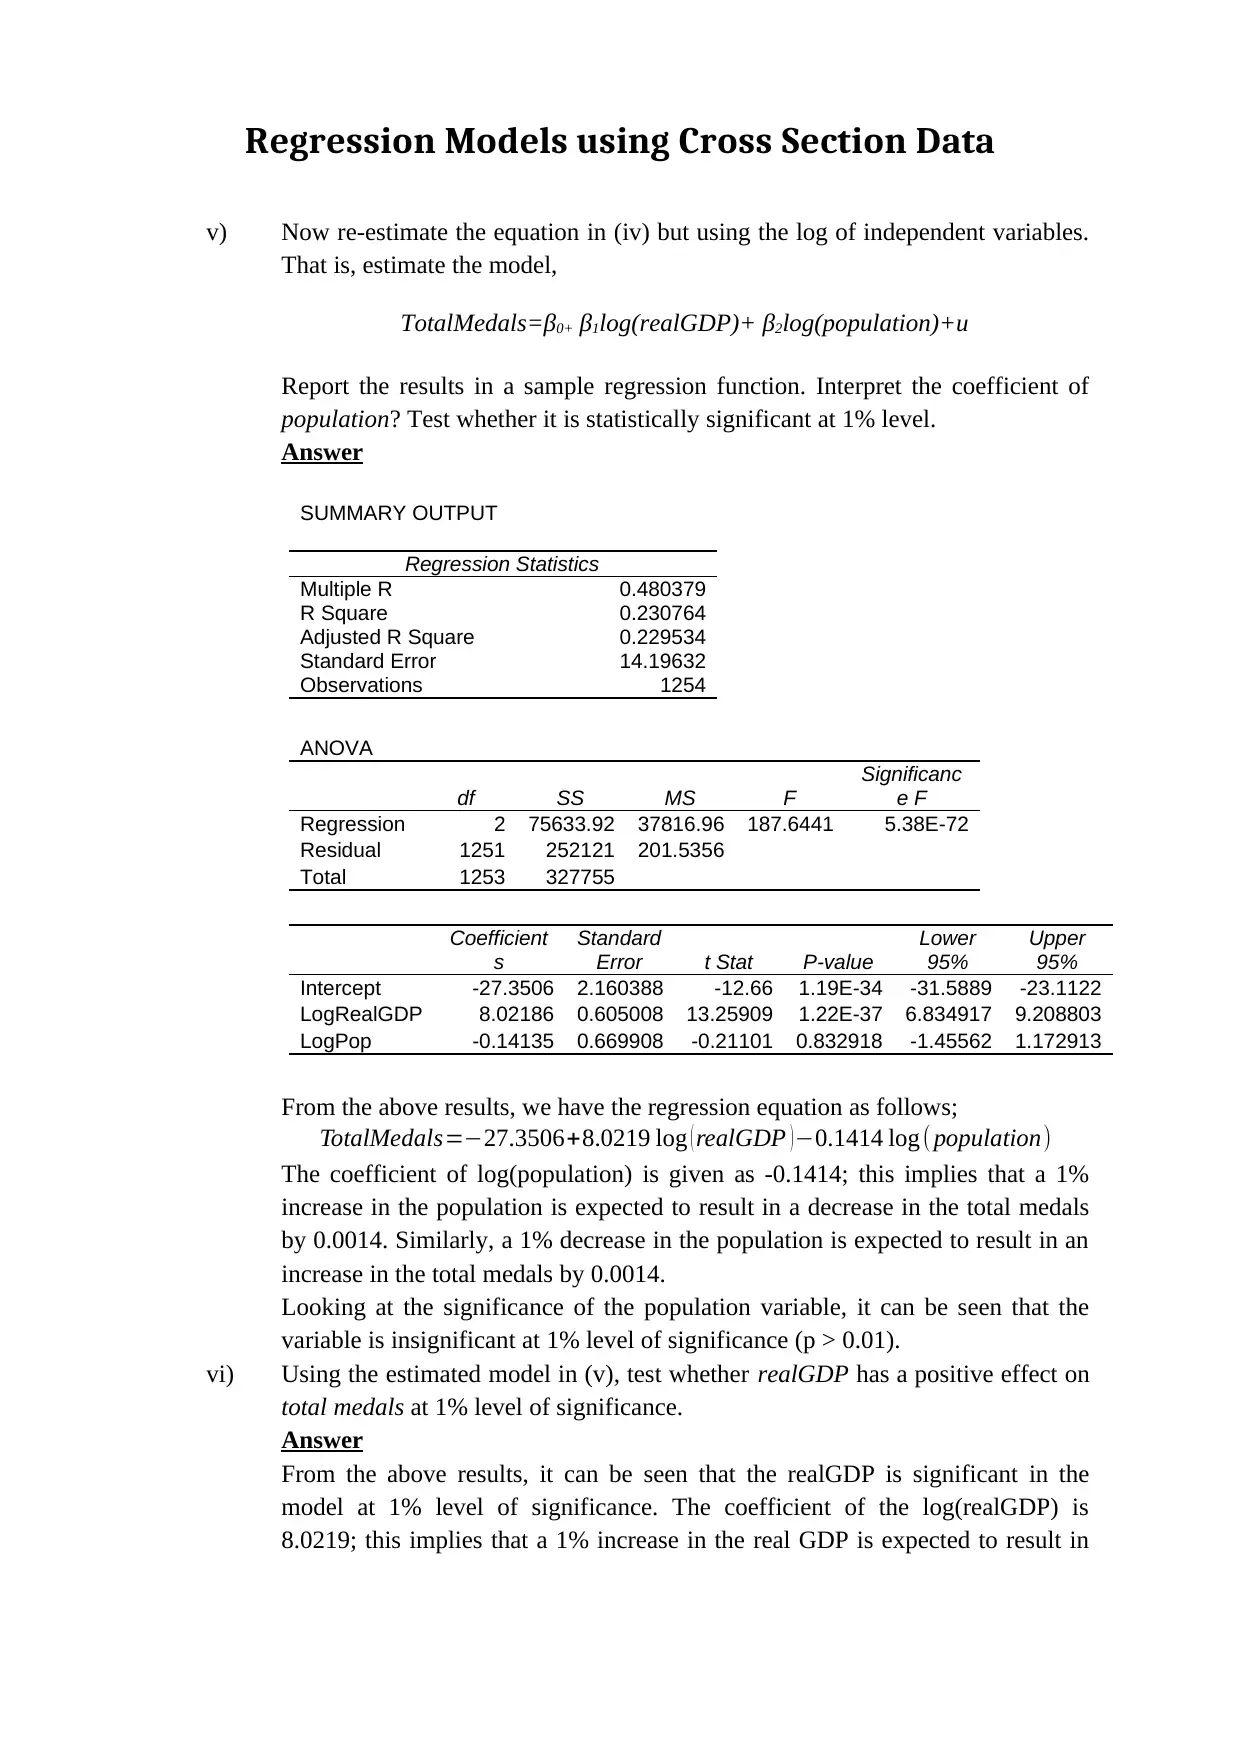
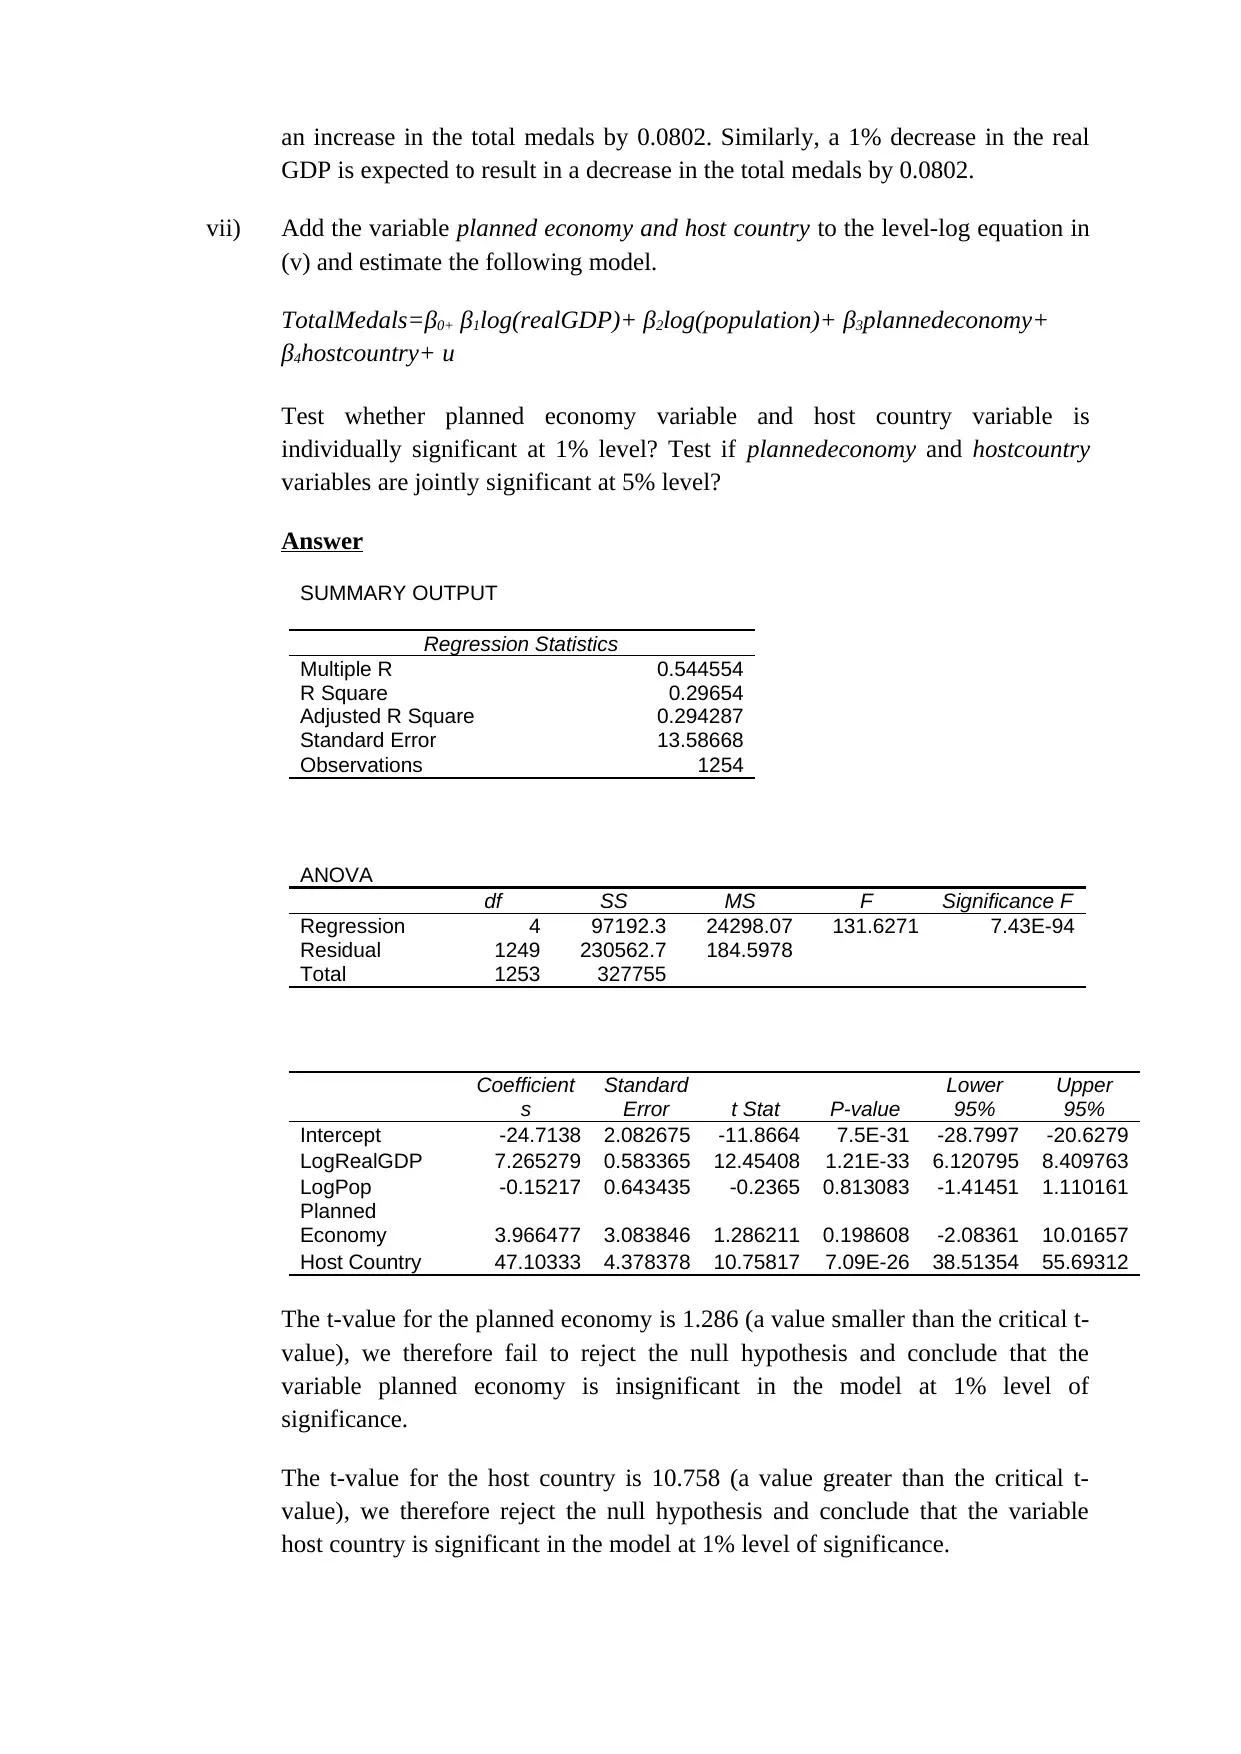
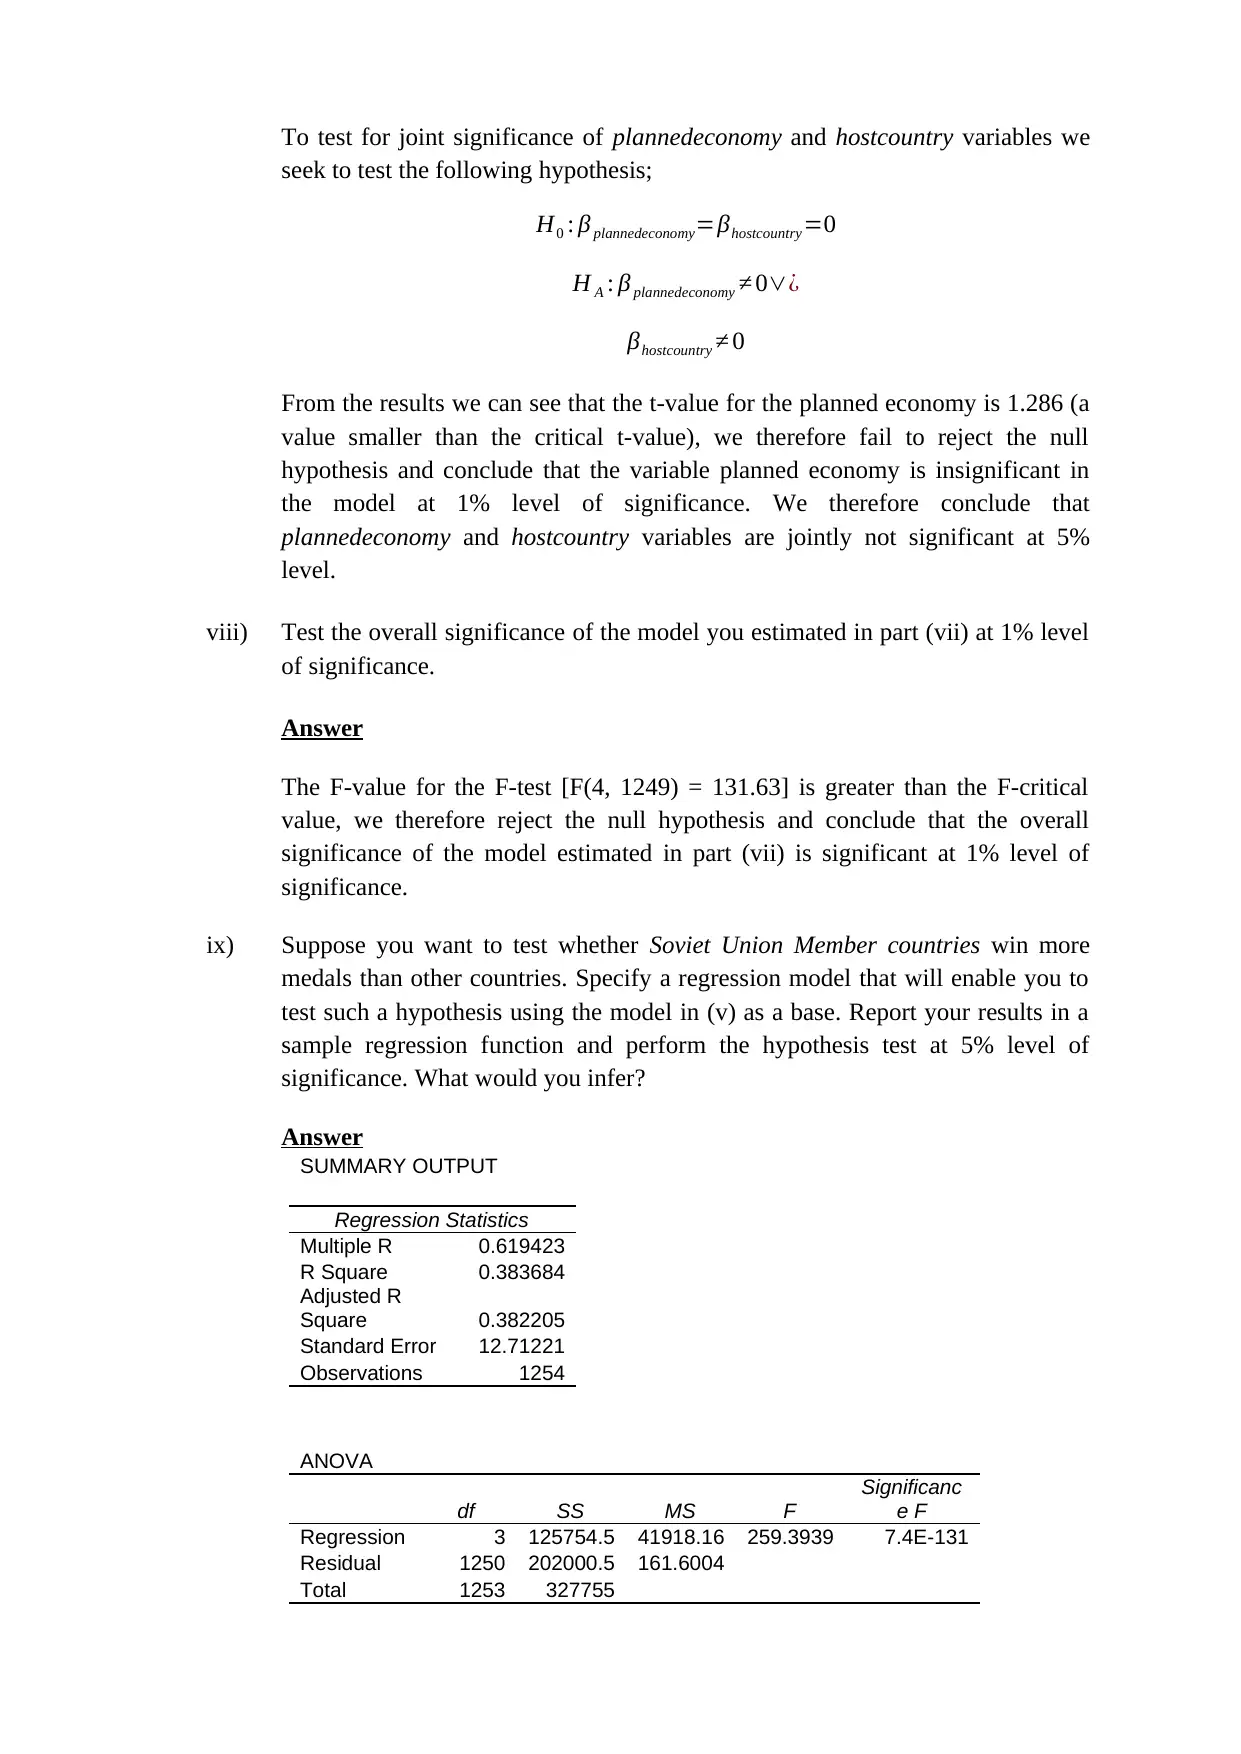
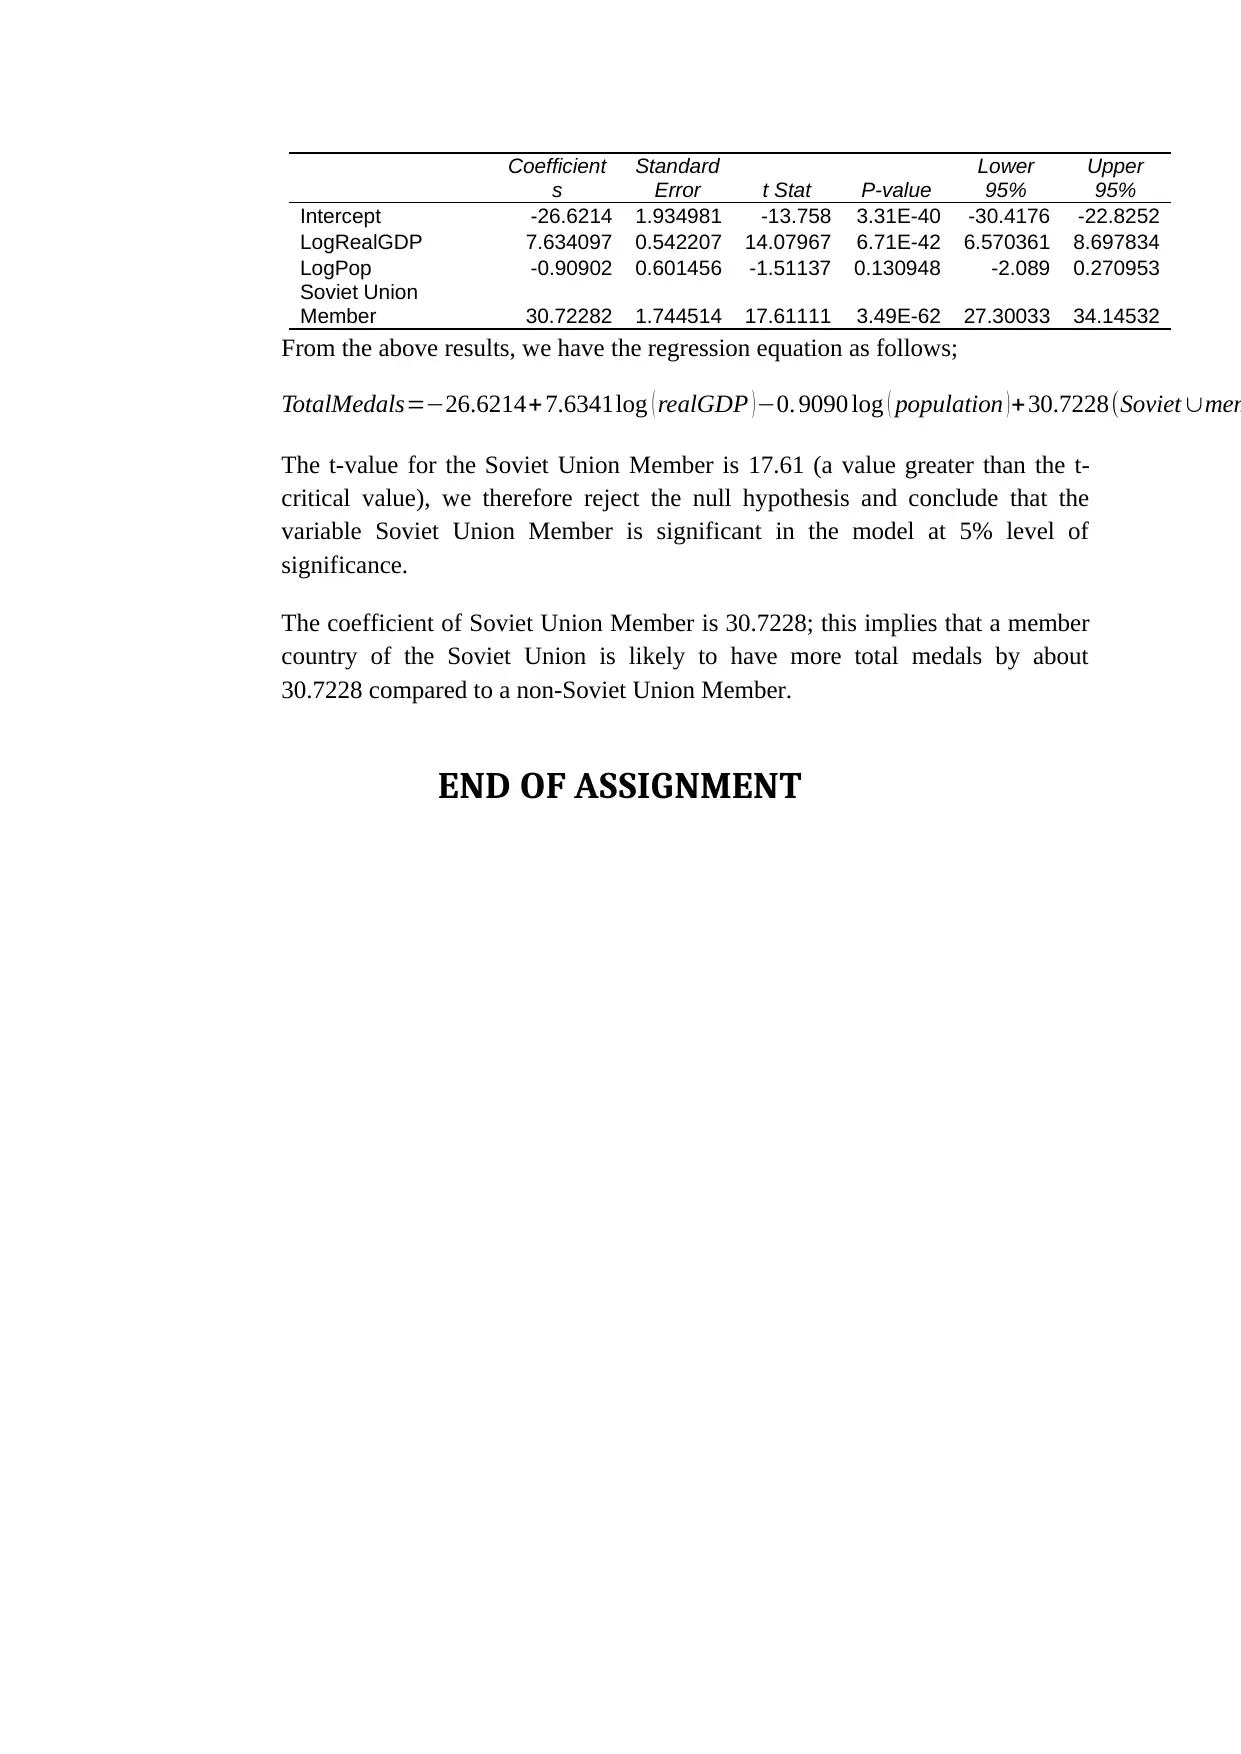
This economics assignment focuses on regression models using cross-section data. The student re-estimates an equation with the log of independent variables, interprets coefficients, and tests for statistical significance. The assignment explores the impact of real GDP and population on total medals, tests the significance of planned economy and host country variables, and examines the overall significance of the model. Furthermore, the student tests the hypothesis that Soviet Union member countries win more medals, providing regression results and interpretations. The analysis includes interpreting coefficients, testing significance levels, and constructing regression equations to analyze the relationship between different economic variables and their impact on the number of medals won by countries. The assignment demonstrates the application of regression analysis in economic modeling and hypothesis testing, providing a comprehensive understanding of the subject matter.

MAE256 T2 2019 – Assignment Details
Student Name:
University Name:
27th July 2019
Student Name:
University Name:
27th July 2019
Paraphrase This Document
Need a fresh take? Get an instant paraphrase of this document with our AI Paraphraser

Regression Models using Cross Section Data
v) Now re-estimate the equation in (iv) but using the log of independent variables.
That is, estimate the model,
TotalMedals=β0+ β1log(realGDP)+ β2log(population)+u
Report the results in a sample regression function. Interpret the coefficient of
population? Test whether it is statistically significant at 1% level.
Answer
SUMMARY OUTPUT
Regression Statistics
Multiple R 0.480379
R Square 0.230764
Adjusted R Square 0.229534
Standard Error 14.19632
Observations 1254
ANOVA
df SS MS F
Significanc
e F
Regression 2 75633.92 37816.96 187.6441 5.38E-72
Residual 1251 252121 201.5356
Total 1253 327755
Coefficient
s
Standard
Error t Stat P-value
Lower
95%
Upper
95%
Intercept -27.3506 2.160388 -12.66 1.19E-34 -31.5889 -23.1122
LogRealGDP 8.02186 0.605008 13.25909 1.22E-37 6.834917 9.208803
LogPop -0.14135 0.669908 -0.21101 0.832918 -1.45562 1.172913
From the above results, we have the regression equation as follows;
TotalMedals=−27.3506+8.0219 log ( realGDP ) −0.1414 log ( population)
The coefficient of log(population) is given as -0.1414; this implies that a 1%
increase in the population is expected to result in a decrease in the total medals
by 0.0014. Similarly, a 1% decrease in the population is expected to result in an
increase in the total medals by 0.0014.
Looking at the significance of the population variable, it can be seen that the
variable is insignificant at 1% level of significance (p > 0.01).
vi) Using the estimated model in (v), test whether realGDP has a positive effect on
total medals at 1% level of significance.
Answer
From the above results, it can be seen that the realGDP is significant in the
model at 1% level of significance. The coefficient of the log(realGDP) is
8.0219; this implies that a 1% increase in the real GDP is expected to result in

an increase in the total medals by 0.0802. Similarly, a 1% decrease in the real
GDP is expected to result in a decrease in the total medals by 0.0802.
vii) Add the variable planned economy and host country to the level-log equation in
(v) and estimate the following model.
TotalMedals=β0+ β1log(realGDP)+ β2log(population)+ β3plannedeconomy+
β4hostcountry+ u
Test whether planned economy variable and host country variable is
individually significant at 1% level? Test if plannedeconomy and hostcountry
variables are jointly significant at 5% level?
Answer
SUMMARY OUTPUT
Regression Statistics
Multiple R 0.544554
R Square 0.29654
Adjusted R Square 0.294287
Standard Error 13.58668
Observations 1254
ANOVA
df SS MS F Significance F
Regression 4 97192.3 24298.07 131.6271 7.43E-94
Residual 1249 230562.7 184.5978
Total 1253 327755
Coefficient
s
Standard
Error t Stat P-value
Lower
95%
Upper
95%
Intercept -24.7138 2.082675 -11.8664 7.5E-31 -28.7997 -20.6279
LogRealGDP 7.265279 0.583365 12.45408 1.21E-33 6.120795 8.409763
LogPop -0.15217 0.643435 -0.2365 0.813083 -1.41451 1.110161
Planned
Economy 3.966477 3.083846 1.286211 0.198608 -2.08361 10.01657
Host Country 47.10333 4.378378 10.75817 7.09E-26 38.51354 55.69312
The t-value for the planned economy is 1.286 (a value smaller than the critical t-
value), we therefore fail to reject the null hypothesis and conclude that the
variable planned economy is insignificant in the model at 1% level of
significance.
The t-value for the host country is 10.758 (a value greater than the critical t-
value), we therefore reject the null hypothesis and conclude that the variable
host country is significant in the model at 1% level of significance.
⊘ This is a preview!⊘
Do you want full access?
Subscribe today to unlock all pages.

Trusted by 1+ million students worldwide

To test for joint significance of plannedeconomy and hostcountry variables we
seek to test the following hypothesis;
H0 : β plannedeconomy=βhostcountry=0
H A : β plannedeconomy ≠ 0∨¿
βhostcountry ≠ 0
From the results we can see that the t-value for the planned economy is 1.286 (a
value smaller than the critical t-value), we therefore fail to reject the null
hypothesis and conclude that the variable planned economy is insignificant in
the model at 1% level of significance. We therefore conclude that
plannedeconomy and hostcountry variables are jointly not significant at 5%
level.
viii) Test the overall significance of the model you estimated in part (vii) at 1% level
of significance.
Answer
The F-value for the F-test [F(4, 1249) = 131.63] is greater than the F-critical
value, we therefore reject the null hypothesis and conclude that the overall
significance of the model estimated in part (vii) is significant at 1% level of
significance.
ix) Suppose you want to test whether Soviet Union Member countries win more
medals than other countries. Specify a regression model that will enable you to
test such a hypothesis using the model in (v) as a base. Report your results in a
sample regression function and perform the hypothesis test at 5% level of
significance. What would you infer?
Answer
SUMMARY OUTPUT
Regression Statistics
Multiple R 0.619423
R Square 0.383684
Adjusted R
Square 0.382205
Standard Error 12.71221
Observations 1254
ANOVA
df SS MS F
Significanc
e F
Regression 3 125754.5 41918.16 259.3939 7.4E-131
Residual 1250 202000.5 161.6004
Total 1253 327755
Paraphrase This Document
Need a fresh take? Get an instant paraphrase of this document with our AI Paraphraser

Coefficient
s
Standard
Error t Stat P-value
Lower
95%
Upper
95%
Intercept -26.6214 1.934981 -13.758 3.31E-40 -30.4176 -22.8252
LogRealGDP 7.634097 0.542207 14.07967 6.71E-42 6.570361 8.697834
LogPop -0.90902 0.601456 -1.51137 0.130948 -2.089 0.270953
Soviet Union
Member 30.72282 1.744514 17.61111 3.49E-62 27.30033 34.14532
From the above results, we have the regression equation as follows;
TotalMedals=−26.6214+ 7.6341log ( realGDP )−0. 9090 log ( population )+ 30.7228(Soviet ∪mem
The t-value for the Soviet Union Member is 17.61 (a value greater than the t-
critical value), we therefore reject the null hypothesis and conclude that the
variable Soviet Union Member is significant in the model at 5% level of
significance.
The coefficient of Soviet Union Member is 30.7228; this implies that a member
country of the Soviet Union is likely to have more total medals by about
30.7228 compared to a non-Soviet Union Member.
END OF ASSIGNMENT
1 out of 5
Related Documents
Your All-in-One AI-Powered Toolkit for Academic Success.
+13062052269
info@desklib.com
Available 24*7 on WhatsApp / Email
Unlock your academic potential
Copyright © 2020–2025 A2Z Services. All Rights Reserved. Developed and managed by ZUCOL.


