Regression Analysis Report: Sales Volume in Indonesia (1991-2010)

Verified

Added on  2022/08/13

|11
|1384
|26
Report
AI Summary
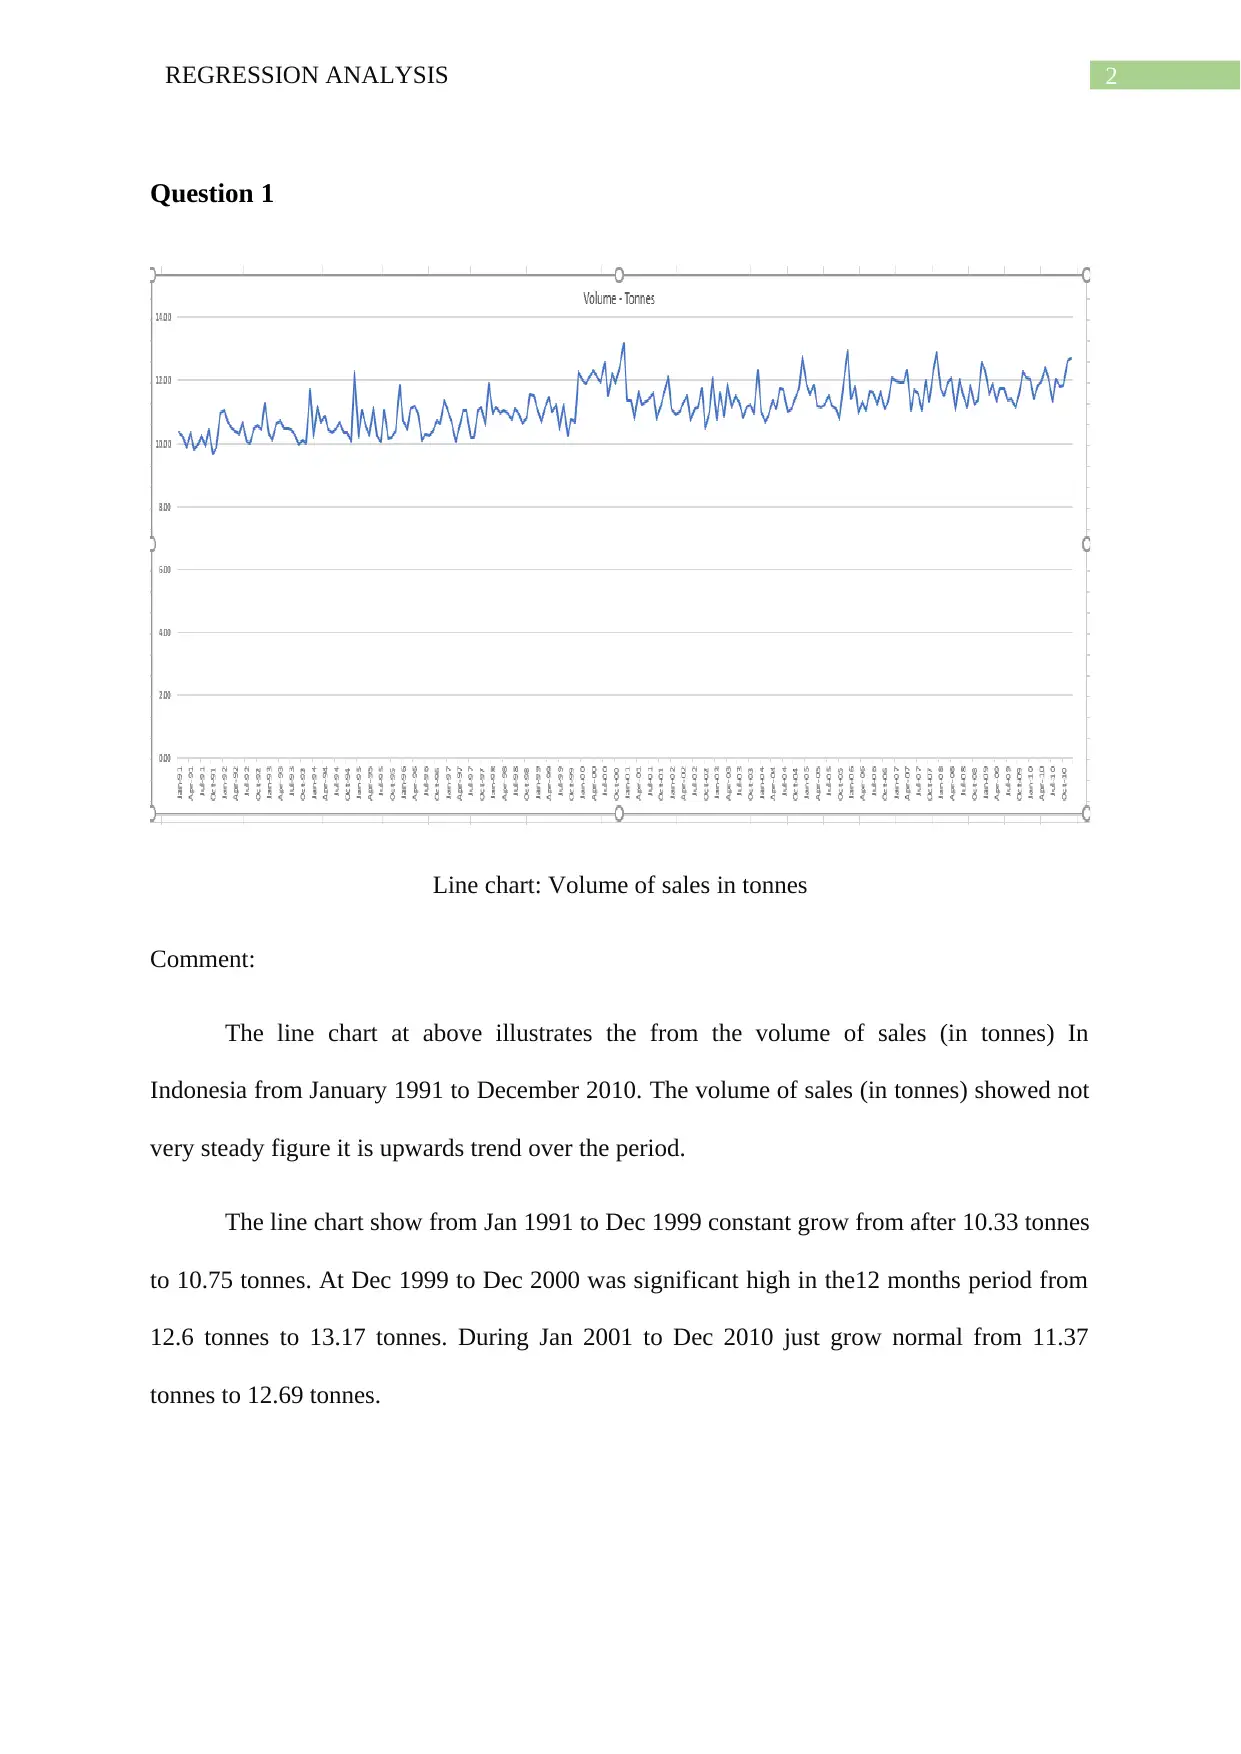
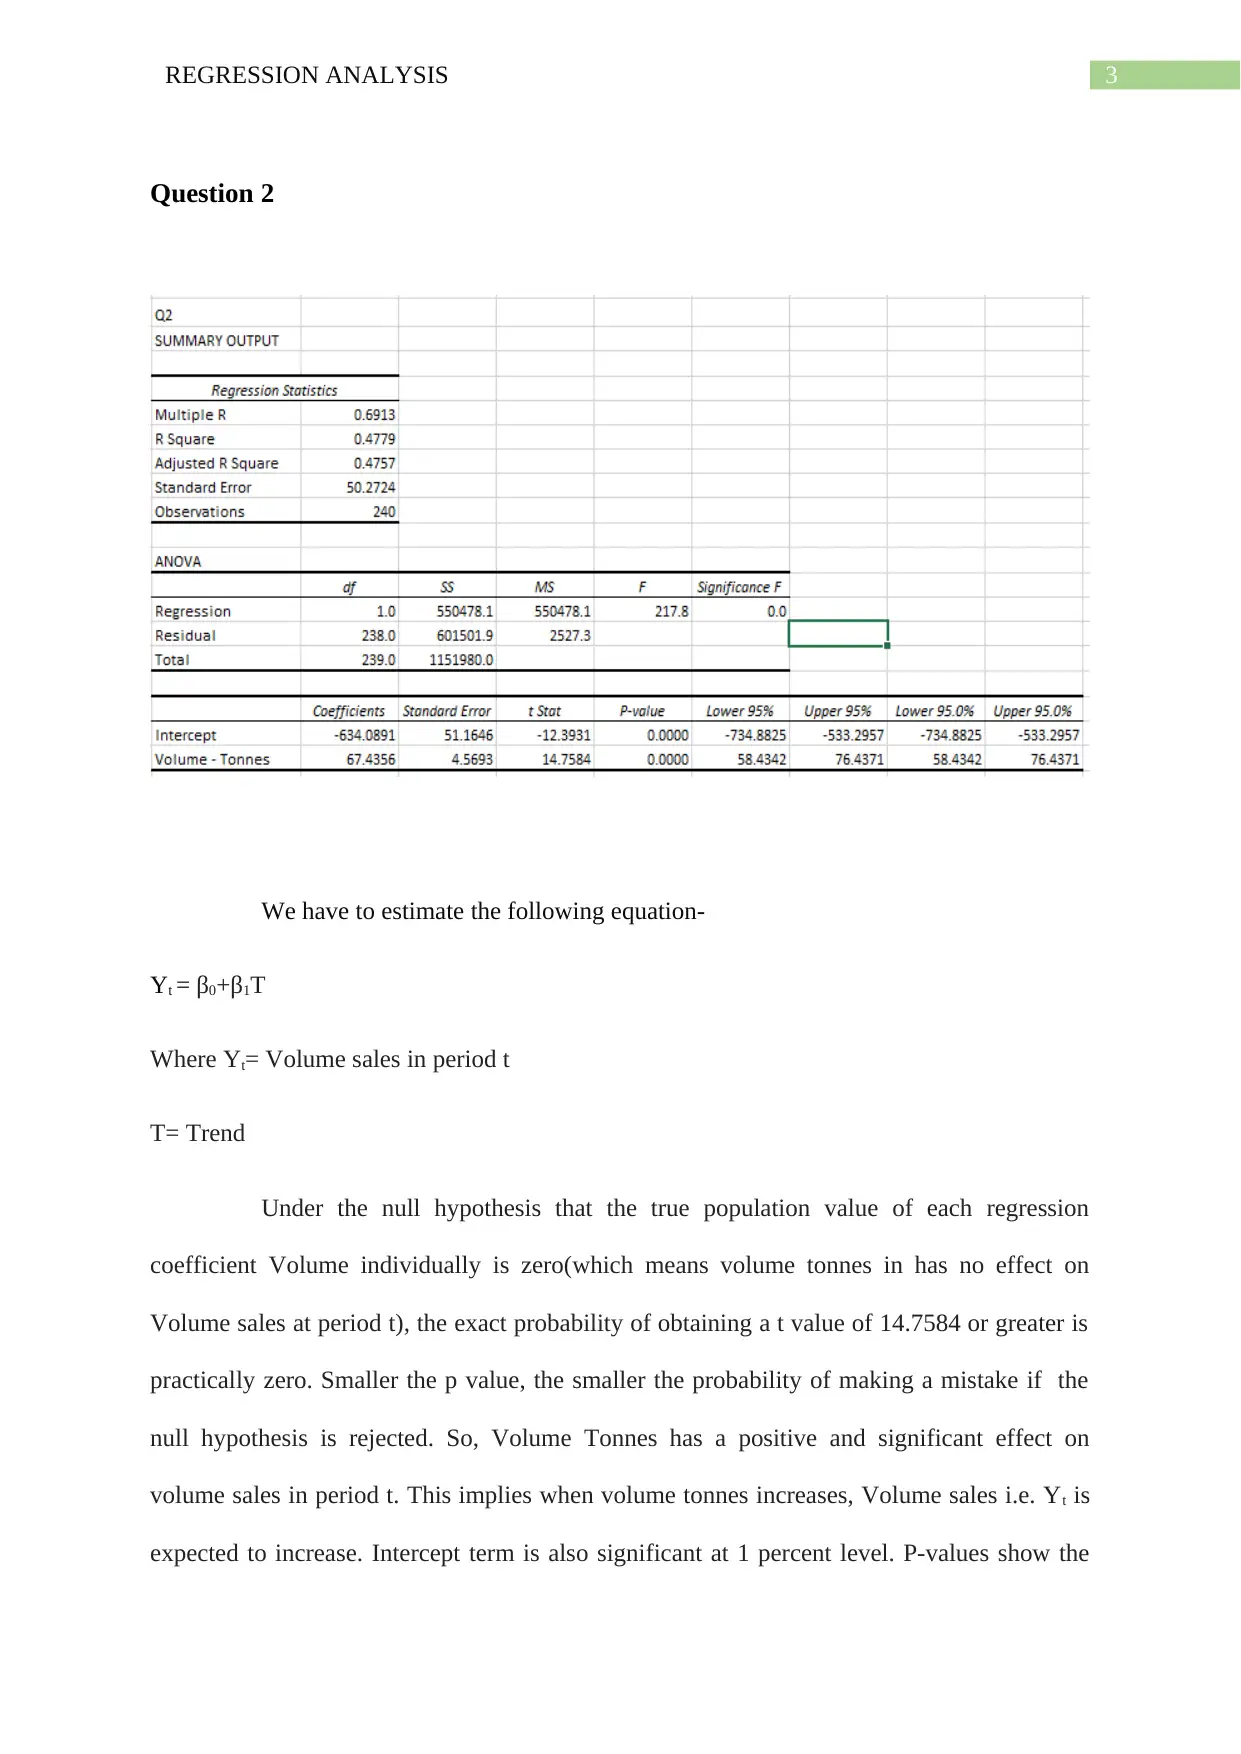
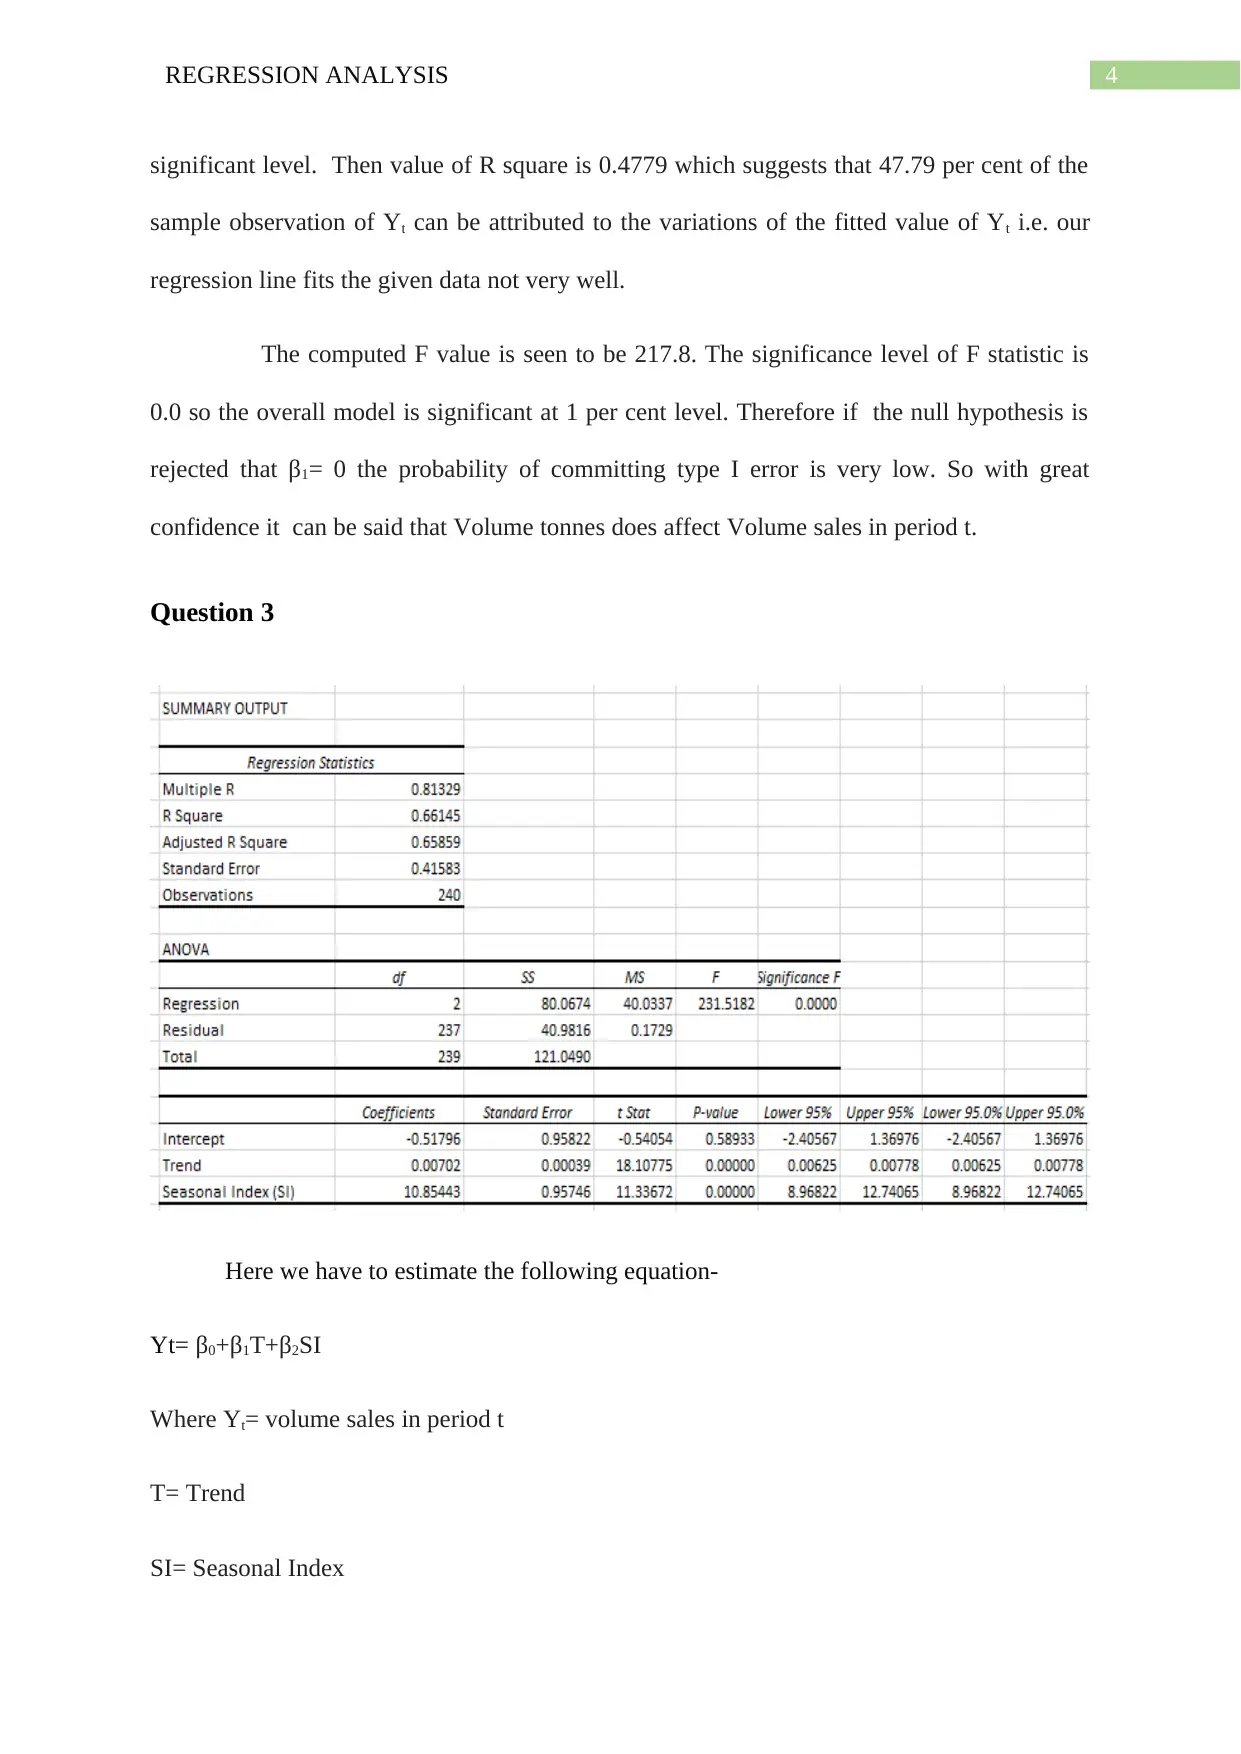
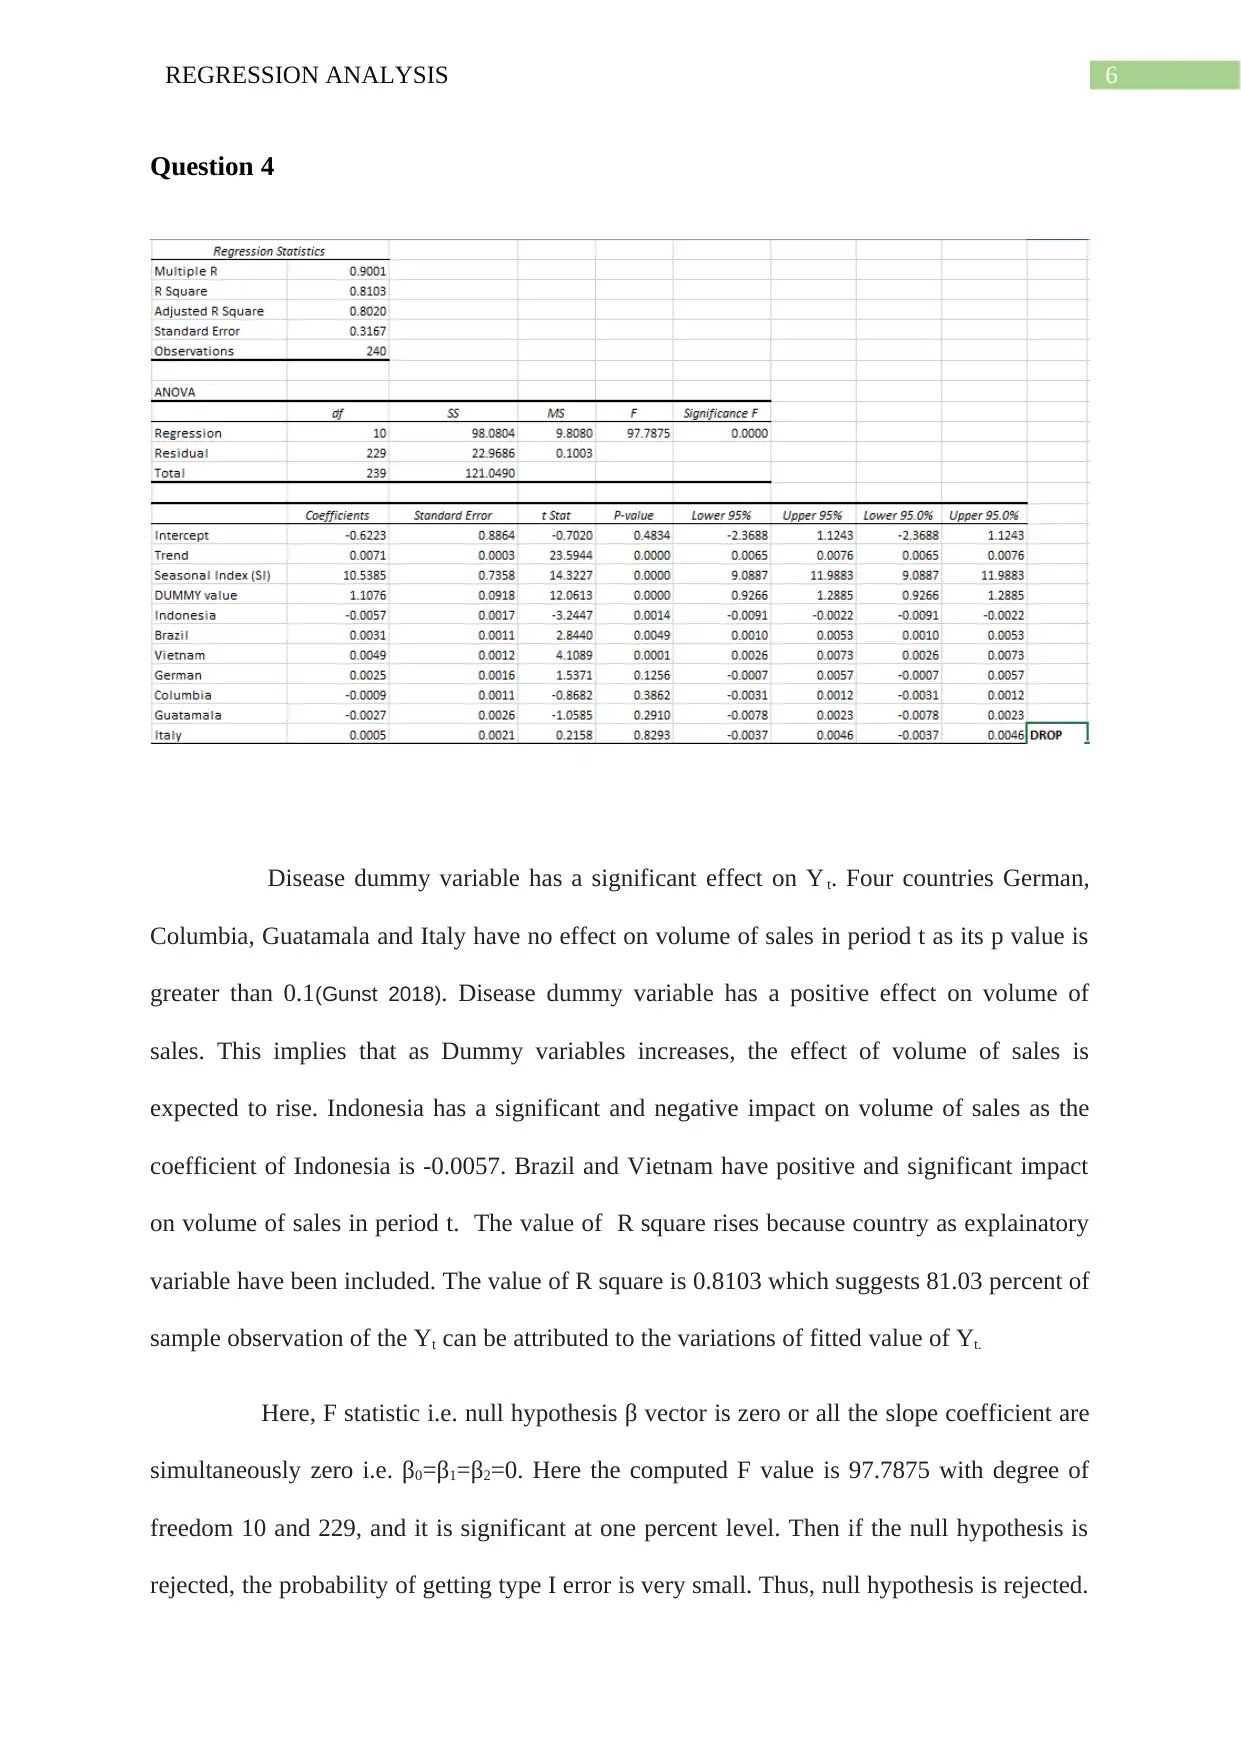
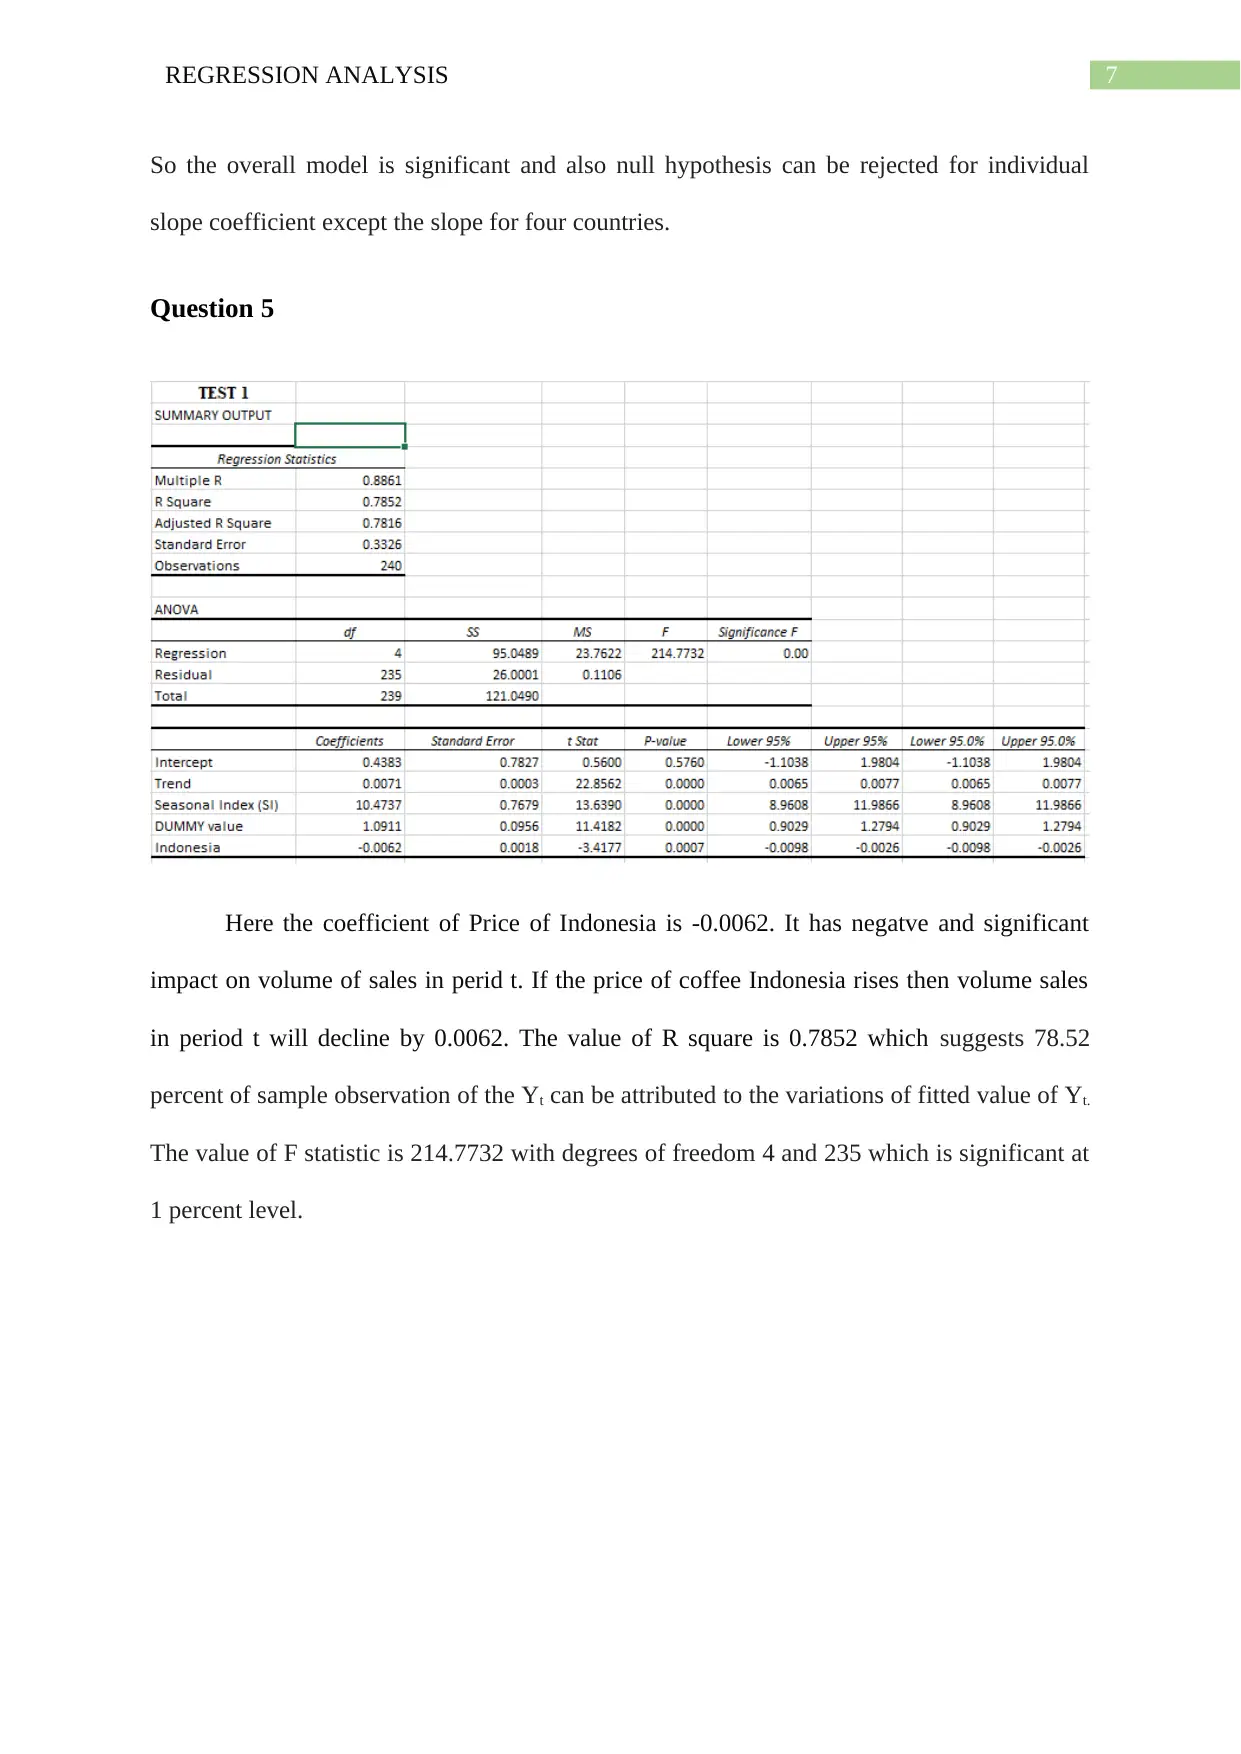
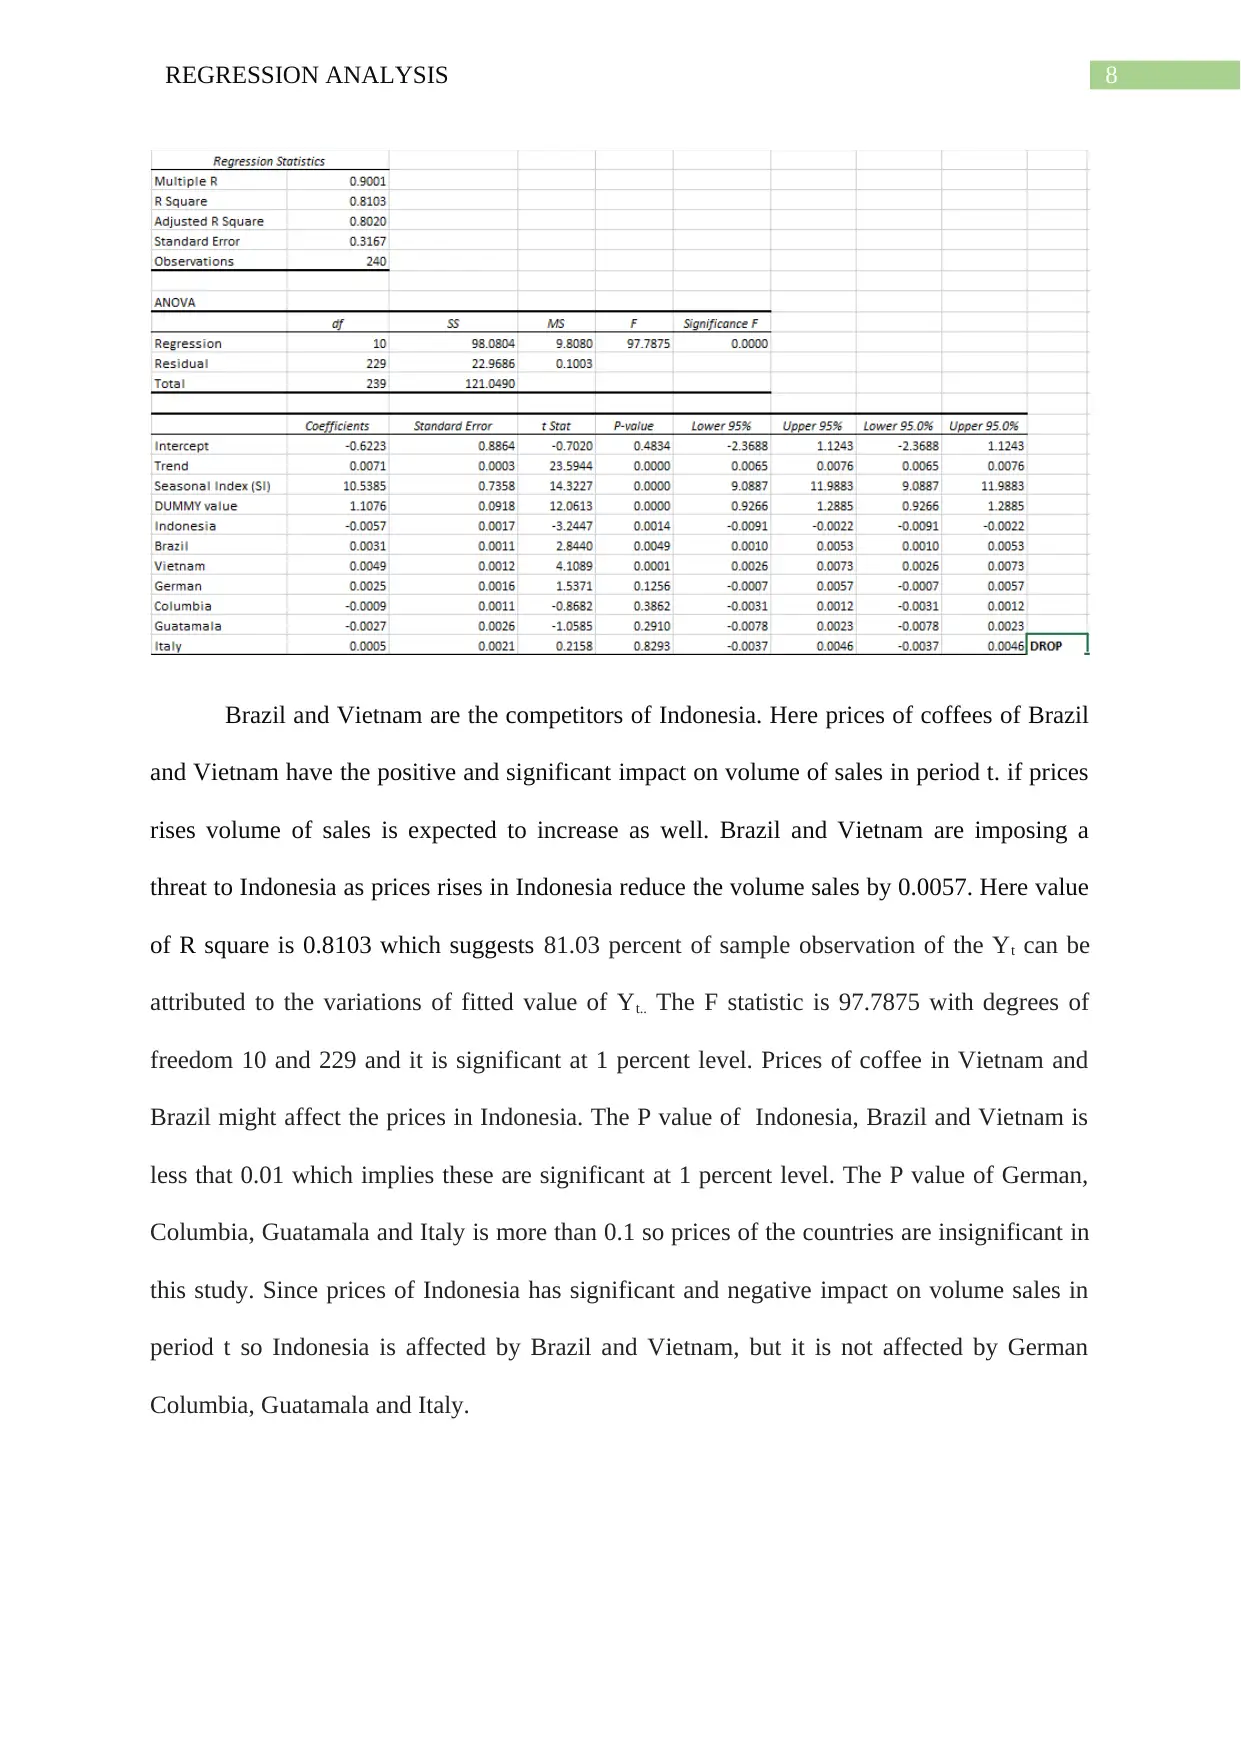
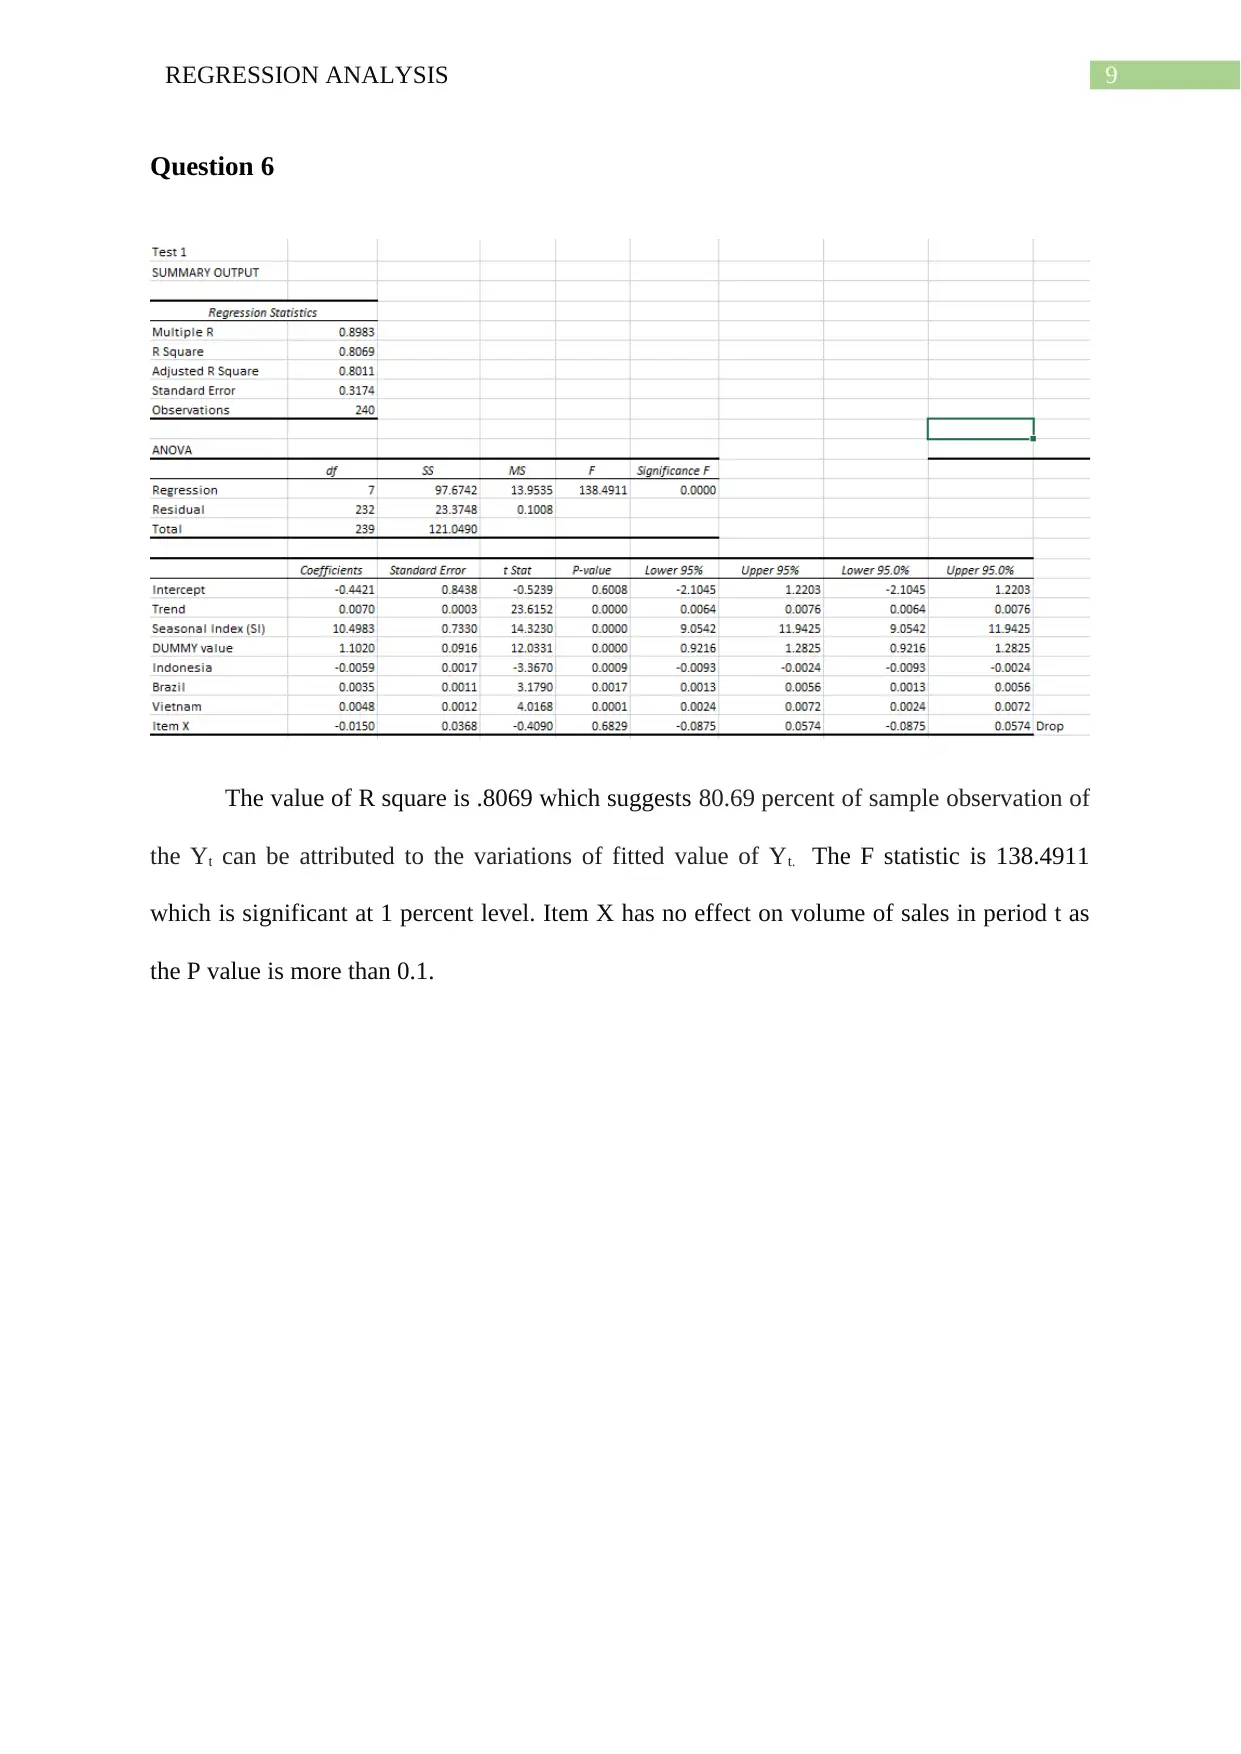
This report presents a comprehensive regression analysis of sales volume in Indonesia spanning from January 1991 to December 2010. The analysis begins with an examination of sales volume trends, utilizing a line chart to illustrate the upward trajectory over the period. It proceeds to estimate regression equations, assessing the impact of trend, seasonal indices, and various dummy variables (including disease and country-specific factors) on sales volume. The report investigates the significance of coefficients, R-squared values, and F-statistics to determine the explanatory power of each model. Furthermore, the analysis delves into the influence of coffee prices in Indonesia, Brazil, and Vietnam on sales volume, evaluating the price elasticity and competitive dynamics within the market. The findings indicate that trend, seasonal indices, and the prices of coffee in Brazil and Vietnam have significant impacts on Indonesian sales volume. Additionally, the study highlights the significance of various country-specific factors and disease dummy variables on the sales volume. The report concludes with a discussion of the overall model significance and implications for the Indonesian coffee market.
Document Page
Running head: REGRESSION ANALYSIS
REGRESSION ANALYSIS
Name of the Student
Name of the University
Author Note
tabler-icon-diamond-filled.svg

Secure Best Marks with AI Grader

Need help grading? Try our AI Grader for instant feedback on your assignments.
Document Page
1REGRESSION ANALYSIS
Table of Contents
Question 1..............................................................................................................................3
Question 2..............................................................................................................................4
Question 3..............................................................................................................................5
Question 4..............................................................................................................................7
Question 5..............................................................................................................................8
Question 6............................................................................................................................10
References................................................................................................................................11
Document Page
2REGRESSION ANALYSIS
Question 1
Line chart: Volume of sales in tonnes
Comment:
The line chart at above illustrates the from the volume of sales (in tonnes) In
Indonesia from January 1991 to December 2010. The volume of sales (in tonnes) showed not
very steady figure it is upwards trend over the period.
The line chart show from Jan 1991 to Dec 1999 constant grow from after 10.33 tonnes
to 10.75 tonnes. At Dec 1999 to Dec 2000 was significant high in the12 months period from
12.6 tonnes to 13.17 tonnes. During Jan 2001 to Dec 2010 just grow normal from 11.37
tonnes to 12.69 tonnes.
Document Page
3REGRESSION ANALYSIS
Question 2
We have to estimate the following equation-
Yt = β01T
Where Yt= Volume sales in period t
T= Trend
Under the null hypothesis that the true population value of each regression
coefficient Volume individually is zero(which means volume tonnes in has no effect on
Volume sales at period t), the exact probability of obtaining a t value of 14.7584 or greater is
practically zero. Smaller the p value, the smaller the probability of making a mistake if the
null hypothesis is rejected. So, Volume Tonnes has a positive and significant effect on
volume sales in period t. This implies when volume tonnes increases, Volume sales i.e. Yt is
expected to increase. Intercept term is also significant at 1 percent level. P-values show the
tabler-icon-diamond-filled.svg

Secure Best Marks with AI Grader

Need help grading? Try our AI Grader for instant feedback on your assignments.
Document Page
4REGRESSION ANALYSIS
significant level. Then value of R square is 0.4779 which suggests that 47.79 per cent of the
sample observation of Yt can be attributed to the variations of the fitted value of Yt i.e. our
regression line fits the given data not very well.
The computed F value is seen to be 217.8. The significance level of F statistic is
0.0 so the overall model is significant at 1 per cent level. Therefore if the null hypothesis is
rejected that β1= 0 the probability of committing type I error is very low. So with great
confidence it can be said that Volume tonnes does affect Volume sales in period t.
Question 3
Here we have to estimate the following equation-
Yt= β01T+β2SI
Where Yt= volume sales in period t
T= Trend
SI= Seasonal Index
Document Page
5REGRESSION ANALYSIS
Under the null hypothesis, the true population slope values are zero(which means
trend and Seasonal Index have no effect on volume sales in period t), the exact probability of
obtatining a t value of 0.00702 and 10.85443 are practically zero. Trend and Seasonal Index
have positive and significate value on volume sales at period t. This implies when volume
trend raises, volume of sales in period t is expected to rise. At the same time, when seasonal
index rises, volume of sales in peiod t is expected to rise. But the Intercept term is
insignificant as p value of intercept is 0.58 which is greater than 0.1. As here the one variable
i.e. seasonal index is added the value of R square has increased. Now the value of R square is
0.66145 which implies 66.145 percent of the sample observation of Yt can be attributed to the
variations of fitted value of Yt i.e. our regression lines fits the given data very well.
Here, F statistic i.e. null hypothesis β vector is zero or all the slope coefficient are
simultaneously zero i.e. β012=0. Here the computed F value is 231.5182 with degree of
freedom 2 and 237 and it is significant at one percent level. Then if the null hypothesis is
rejected the probability of getting type I error is very small. So the null hypothesis is rejected.
So the overall model is significant and also null hypothesis can be rejected for individual
slope coefficient. So trend and seasonal index have significant effect on volume of sales in
period t.
Document Page
6REGRESSION ANALYSIS
Question 4
Disease dummy variable has a significant effect on Y t. Four countries German,
Columbia, Guatamala and Italy have no effect on volume of sales in period t as its p value is
greater than 0.1(Gunst 2018). Disease dummy variable has a positive effect on volume of
sales. This implies that as Dummy variables increases, the effect of volume of sales is
expected to rise. Indonesia has a significant and negative impact on volume of sales as the
coefficient of Indonesia is -0.0057. Brazil and Vietnam have positive and significant impact
on volume of sales in period t. The value of R square rises because country as explainatory
variable have been included. The value of R square is 0.8103 which suggests 81.03 percent of
sample observation of the Yt can be attributed to the variations of fitted value of Yt.
Here, F statistic i.e. null hypothesis β vector is zero or all the slope coefficient are
simultaneously zero i.e. β012=0. Here the computed F value is 97.7875 with degree of
freedom 10 and 229, and it is significant at one percent level. Then if the null hypothesis is
rejected, the probability of getting type I error is very small. Thus, null hypothesis is rejected.
tabler-icon-diamond-filled.svg

Paraphrase This Document

Need a fresh take? Get an instant paraphrase of this document with our AI Paraphraser
Document Page
7REGRESSION ANALYSIS
So the overall model is significant and also null hypothesis can be rejected for individual
slope coefficient except the slope for four countries.
Question 5
Here the coefficient of Price of Indonesia is -0.0062. It has negatve and significant
impact on volume of sales in perid t. If the price of coffee Indonesia rises then volume sales
in period t will decline by 0.0062. The value of R square is 0.7852 which suggests 78.52
percent of sample observation of the Yt can be attributed to the variations of fitted value of Yt.
The value of F statistic is 214.7732 with degrees of freedom 4 and 235 which is significant at
1 percent level.
Document Page
8REGRESSION ANALYSIS
Brazil and Vietnam are the competitors of Indonesia. Here prices of coffees of Brazil
and Vietnam have the positive and significant impact on volume of sales in period t. if prices
rises volume of sales is expected to increase as well. Brazil and Vietnam are imposing a
threat to Indonesia as prices rises in Indonesia reduce the volume sales by 0.0057. Here value
of R square is 0.8103 which suggests 81.03 percent of sample observation of the Yt can be
attributed to the variations of fitted value of Yt.. The F statistic is 97.7875 with degrees of
freedom 10 and 229 and it is significant at 1 percent level. Prices of coffee in Vietnam and
Brazil might affect the prices in Indonesia. The P value of Indonesia, Brazil and Vietnam is
less that 0.01 which implies these are significant at 1 percent level. The P value of German,
Columbia, Guatamala and Italy is more than 0.1 so prices of the countries are insignificant in
this study. Since prices of Indonesia has significant and negative impact on volume sales in
period t so Indonesia is affected by Brazil and Vietnam, but it is not affected by German
Columbia, Guatamala and Italy.
Document Page
9REGRESSION ANALYSIS
Question 6
The value of R square is .8069 which suggests 80.69 percent of sample observation of
the Yt can be attributed to the variations of fitted value of Yt. The F statistic is 138.4911
which is significant at 1 percent level. Item X has no effect on volume of sales in period t as
the P value is more than 0.1.
tabler-icon-diamond-filled.svg

Secure Best Marks with AI Grader

Need help grading? Try our AI Grader for instant feedback on your assignments.
Document Page
10REGRESSION ANALYSIS
References
Chatterjee, S. and Hadi, A.S., 2015. Regression analysis by example. John Wiley & Sons.
Gunst, R.F., 2018. Regression analysis and its application: a data-oriented approach.
Routledge.
chevron_up_icon
1 out of 11
circle_padding
hide_on_mobile
zoom_out_icon
[object Object]