Quantitative Analysis: Evaluating Regression Models and Correlation
VerifiedAdded on 2023/06/16
|7
|1197
|55
Report
AI Summary
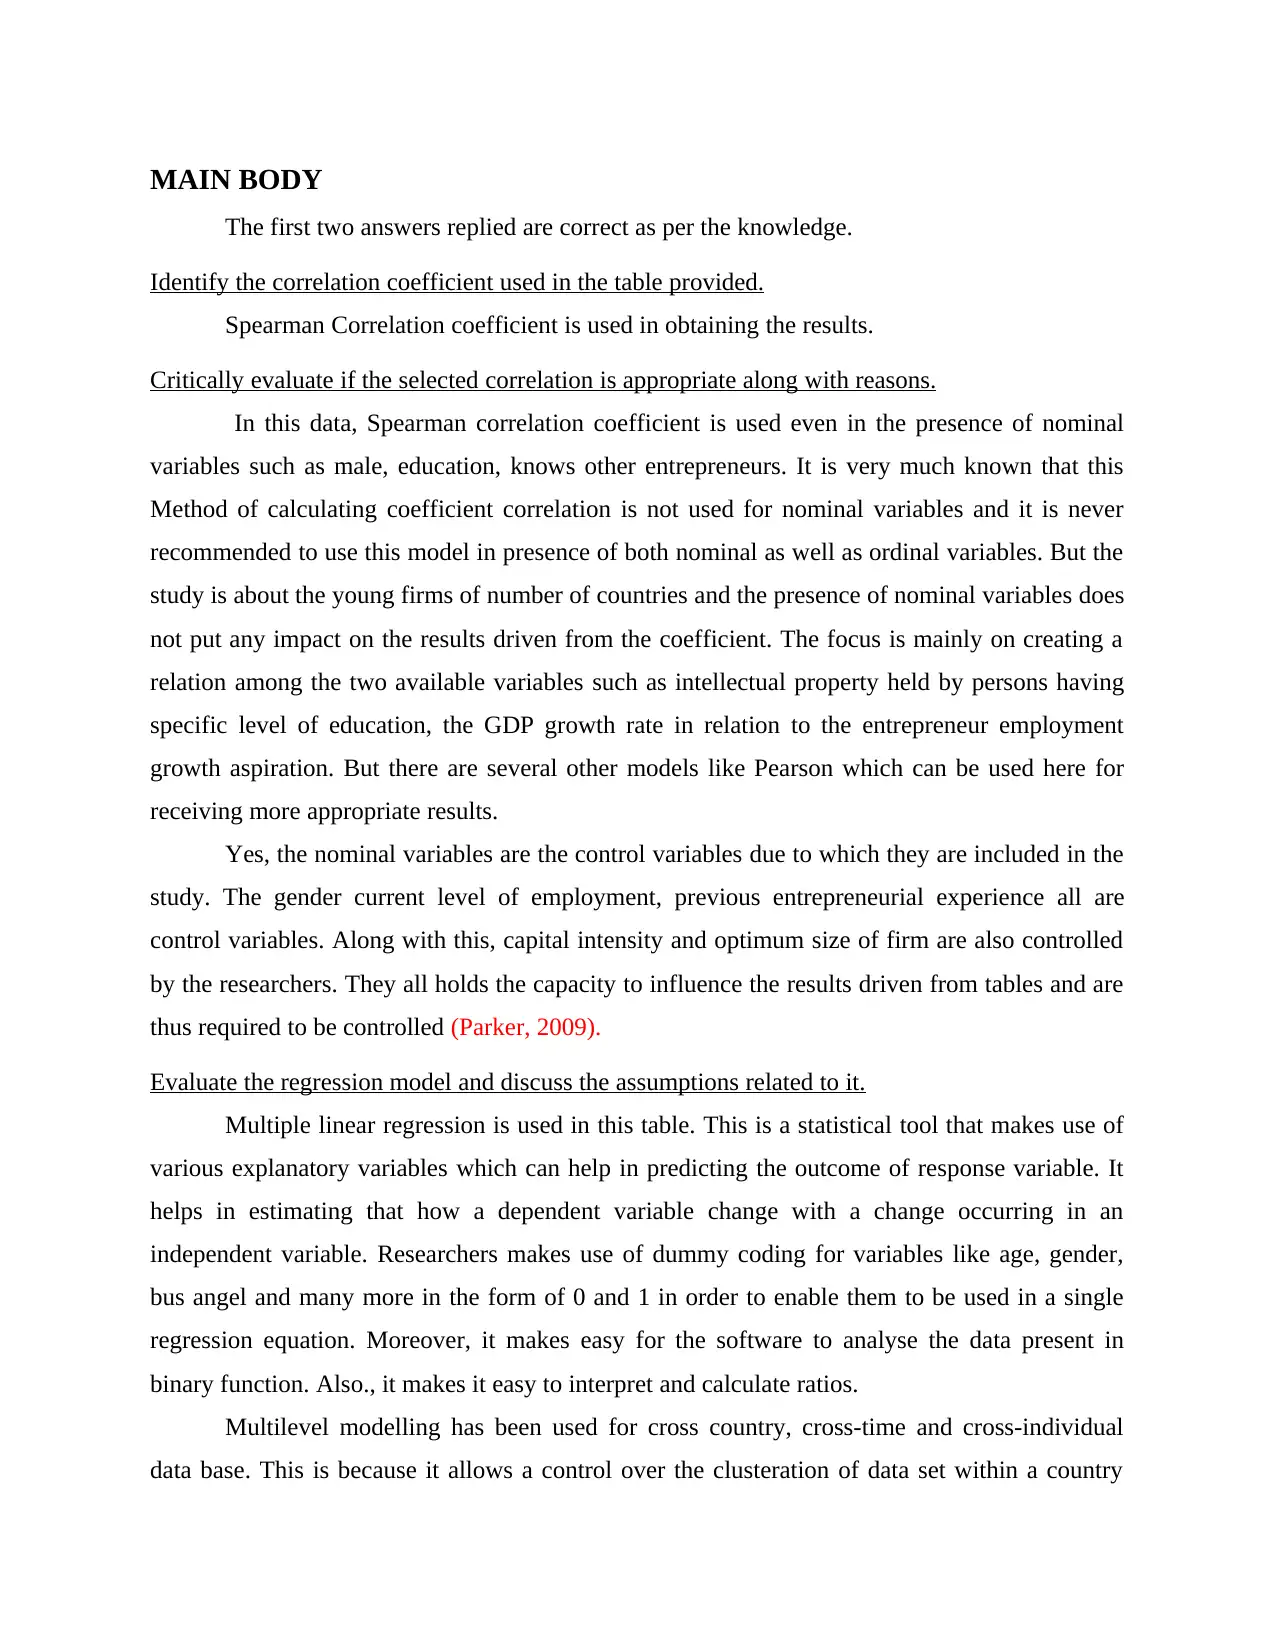
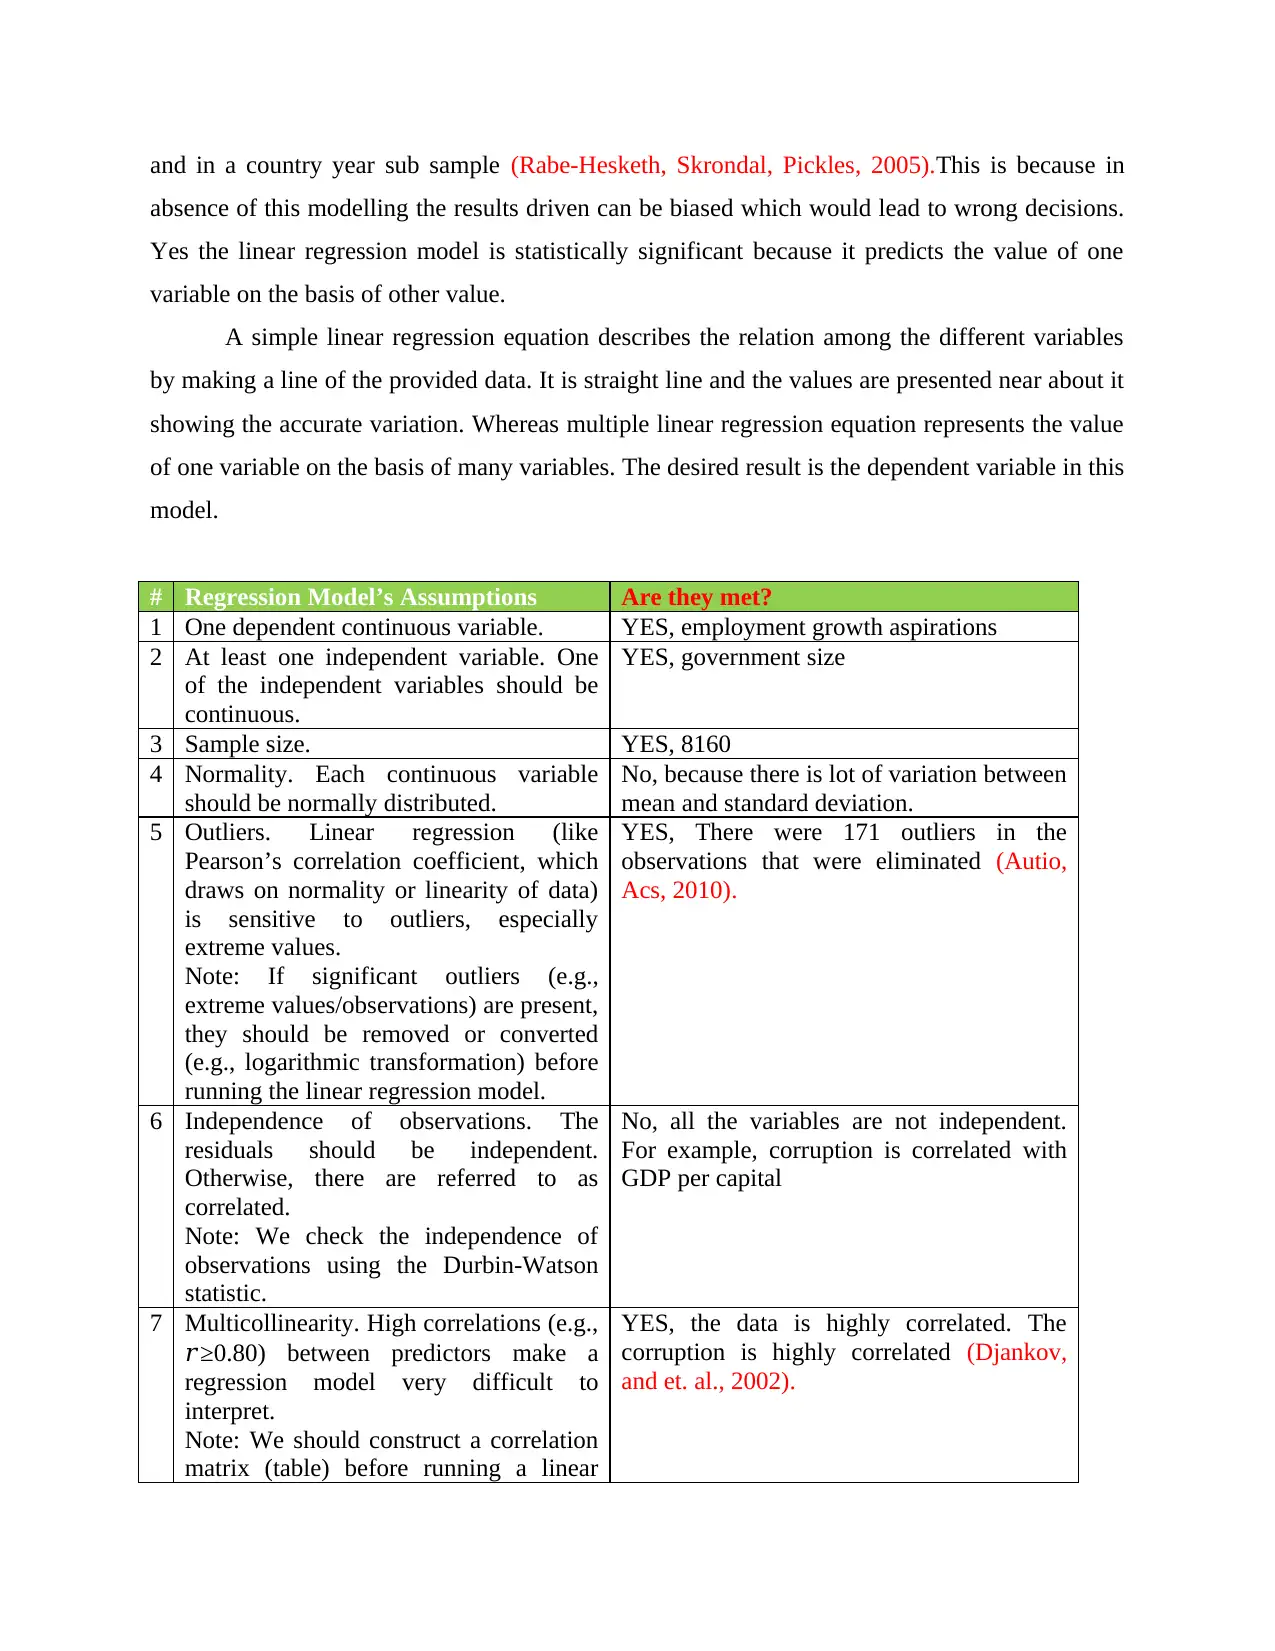
This assignment provides a quantitative analysis and evaluation of a regression model, focusing on the appropriateness of the Spearman correlation coefficient used and its limitations with nominal variables. It assesses the assumptions of the multiple linear regression model, including normality, independence of observations, and multicollinearity, using examples from the provided data. The analysis identifies whether these assumptions are met, referencing statistical tests and conditions for valid results. The report also discusses the use of dummy coding and multilevel modeling for handling cross-country data, highlighting the importance of controlling for variables like gender, employment, and capital intensity. The student concludes by referencing relevant academic literature to support the evaluation and analysis.


1 out of 7
Related Documents


Your All-in-One AI-Powered Toolkit for Academic Success.
+13062052269
info@desklib.com
Available 24*7 on WhatsApp / Email
![[object Object]](/_next/static/media/star-bottom.7253800d.svg)
Copyright © 2020–2026 A2Z Services. All Rights Reserved. Developed and managed by ZUCOL.