Statistics: Analysis of the dataset and the outliers, Regression
VerifiedAdded on 2020/03/16
|5
|338
|96
Report
AI Summary
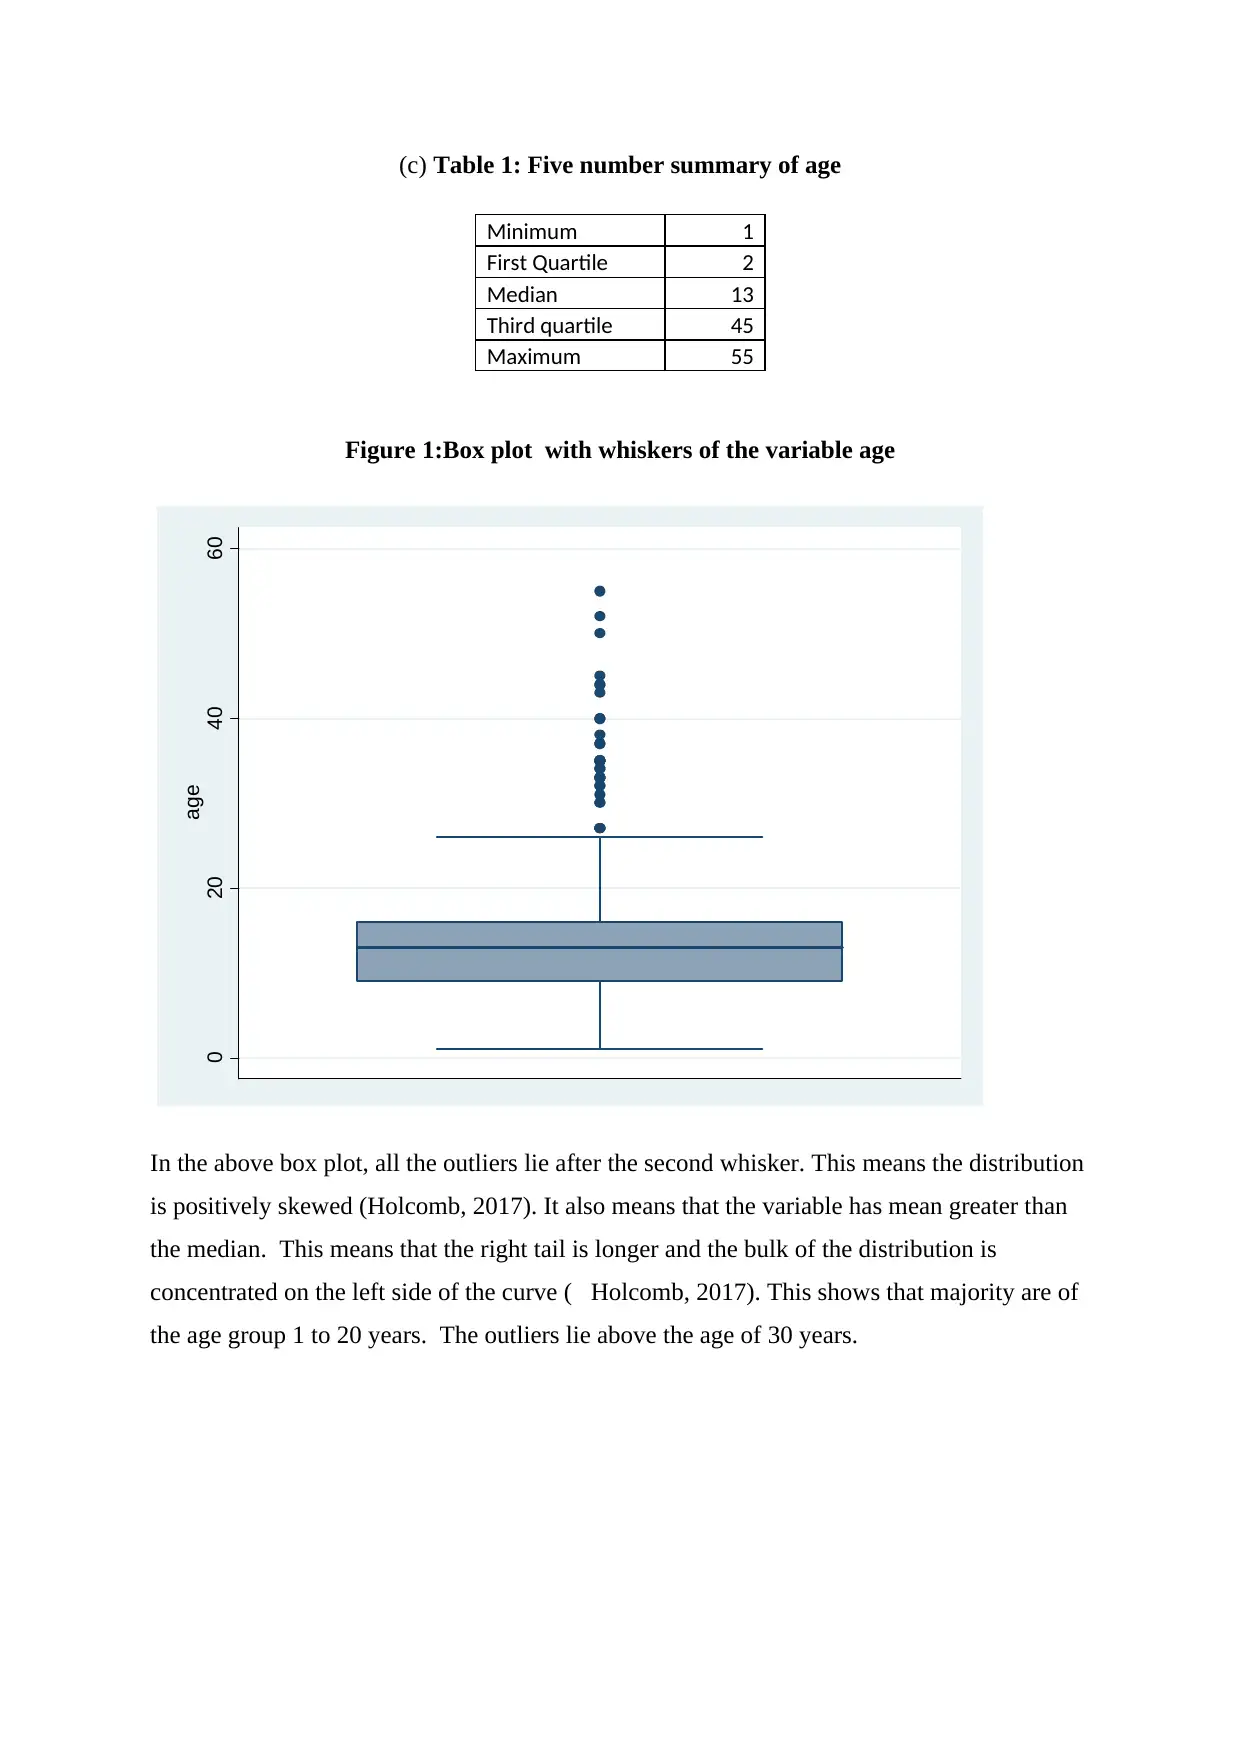
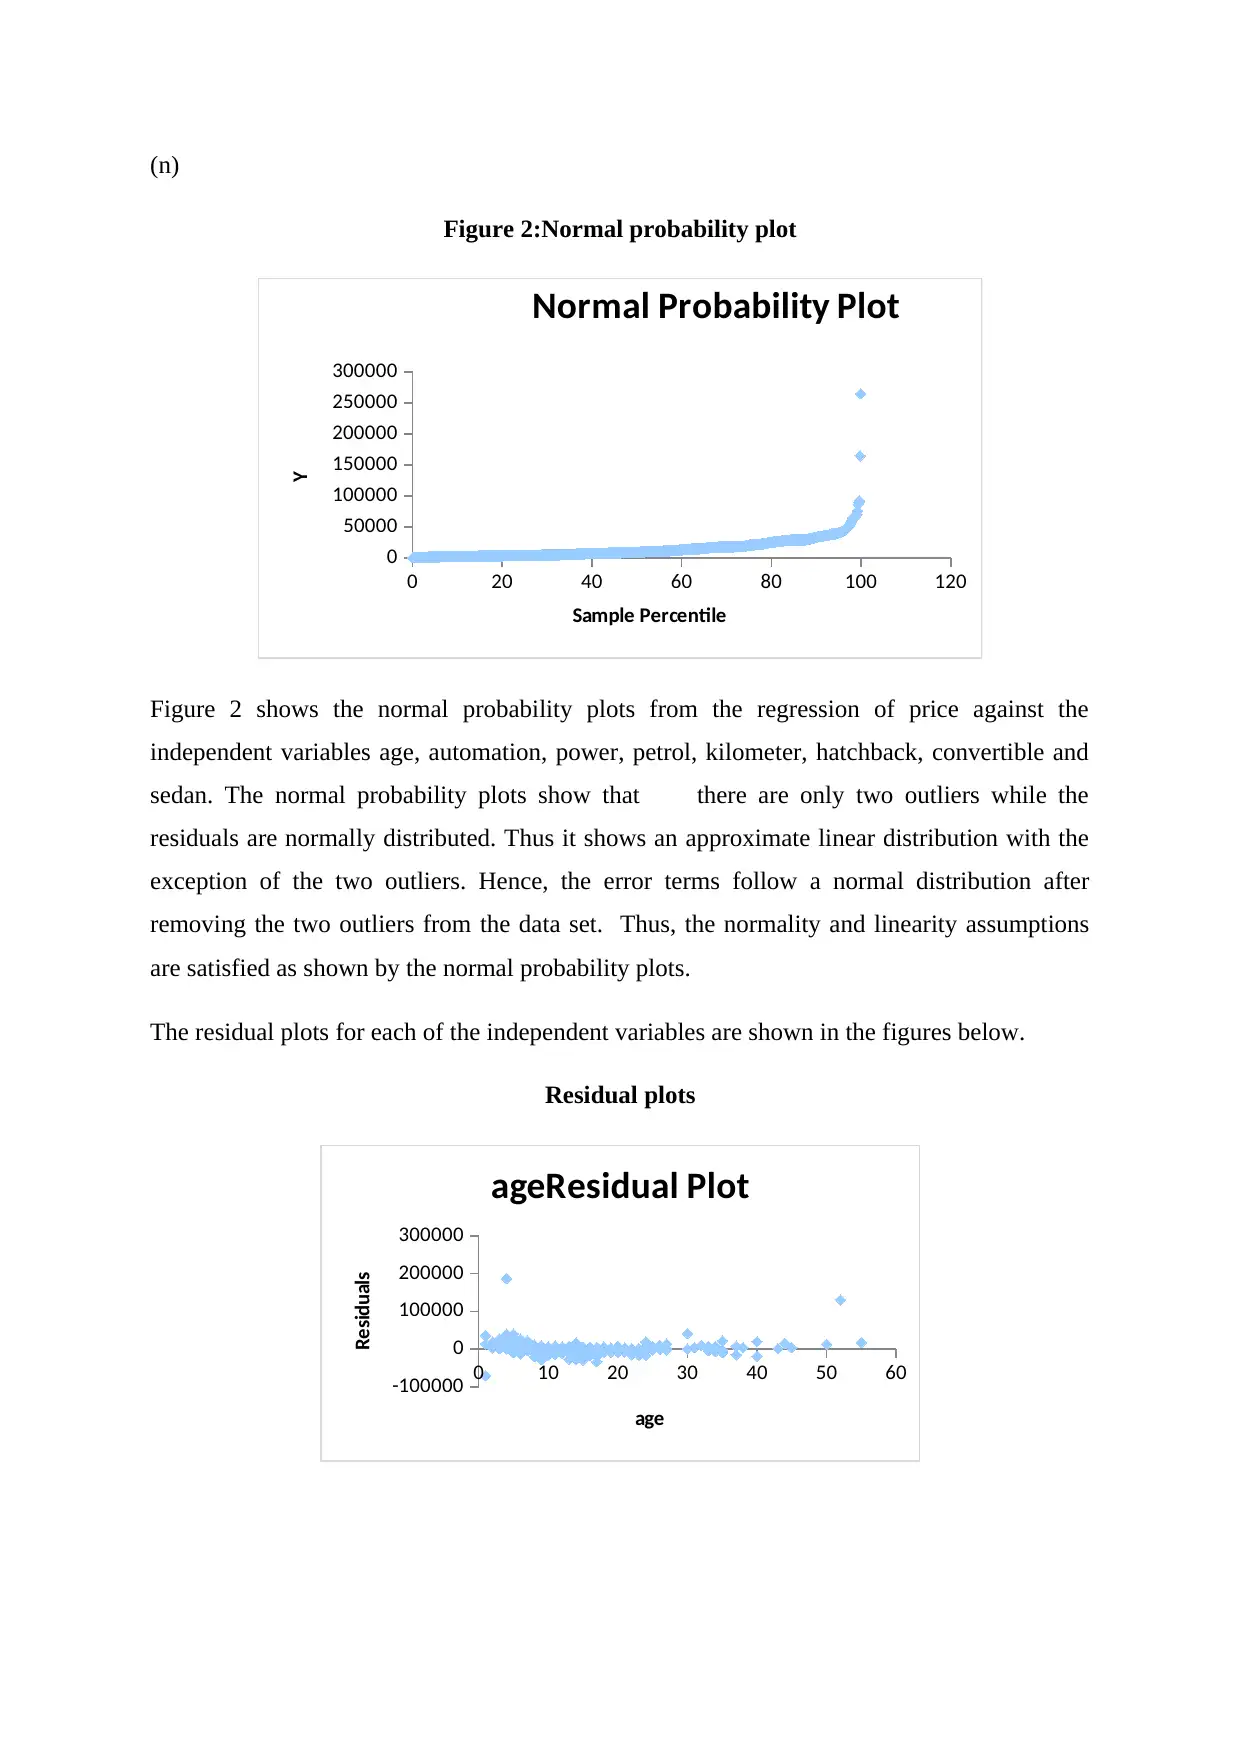
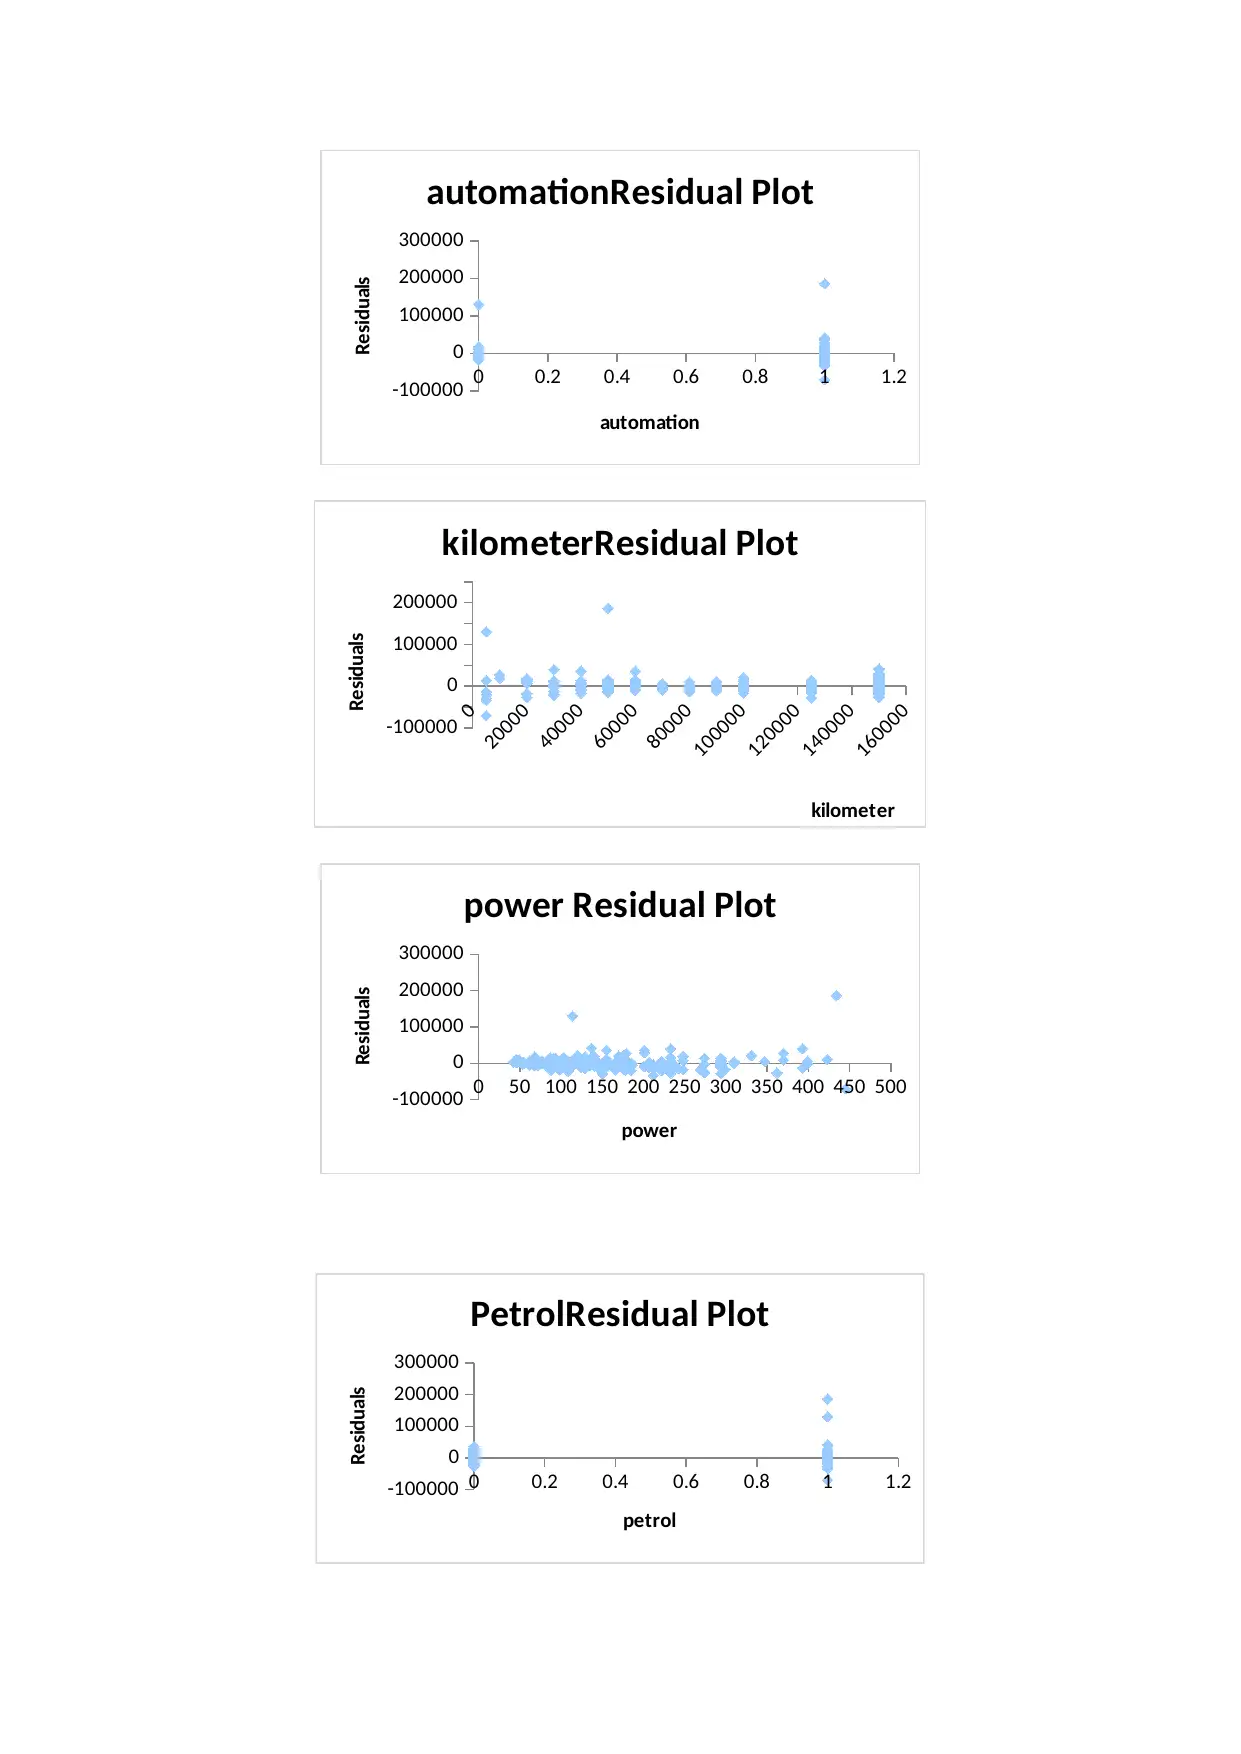
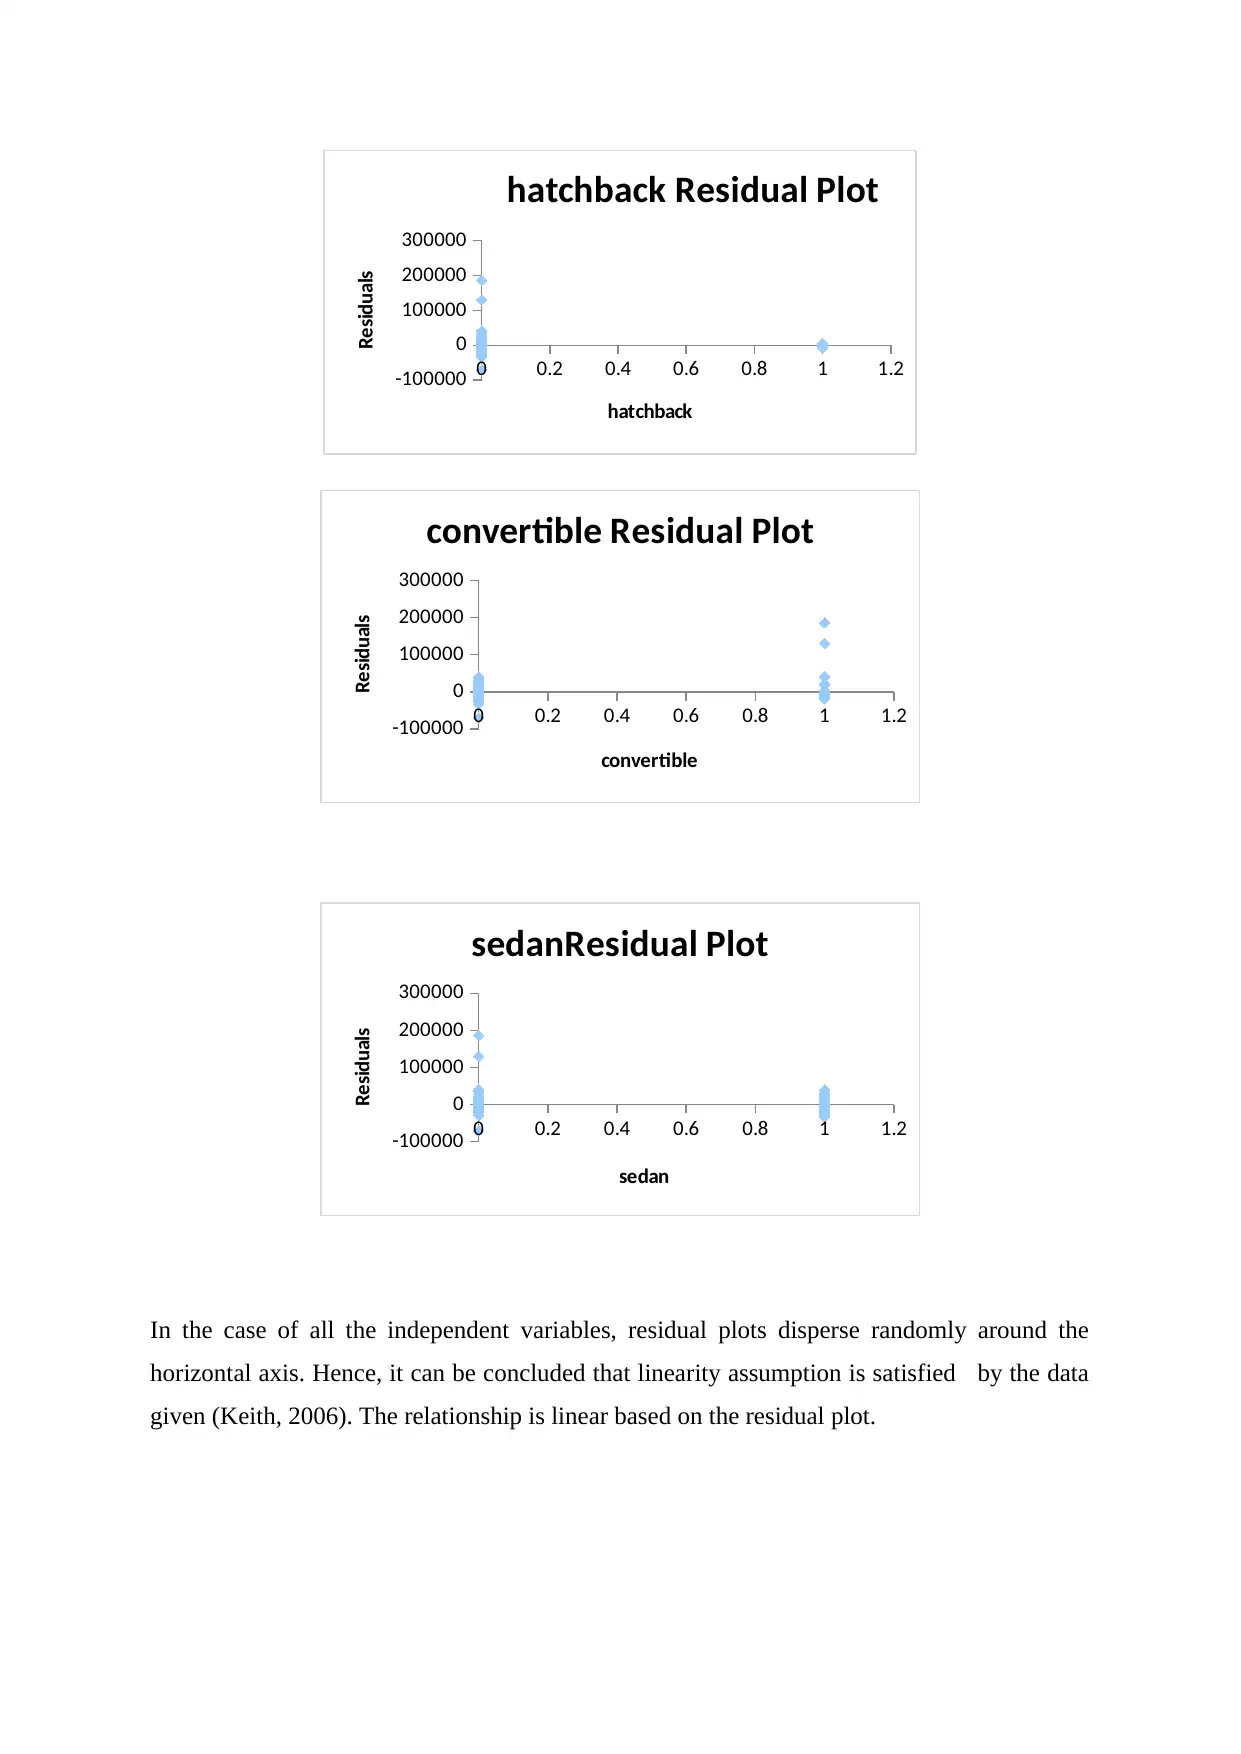
This report presents a statistical analysis of a given dataset, focusing on regression analysis and outlier identification. The report begins with a discussion of the five-number summary and a box plot, demonstrating the skewness of the data and the presence of outliers. The analysis then proceeds to examine normal probability plots to assess the distribution of residuals, concluding that the data, after removing outliers, generally follows a normal distribution. The report also includes residual plots for each independent variable, confirming the linearity assumption. The report highlights the importance of understanding the data distribution, identifying outliers, and ensuring the assumptions of regression analysis are met for accurate interpretation and prediction. The report concludes with references to the sources used.
1 out of 5
Related Documents


Your All-in-One AI-Powered Toolkit for Academic Success.
+13062052269
info@desklib.com
Available 24*7 on WhatsApp / Email
![[object Object]](/_next/static/media/star-bottom.7253800d.svg)
Copyright © 2020–2026 A2Z Services. All Rights Reserved. Developed and managed by ZUCOL.