University Canada West: Regression Report for Quantitative Skills
VerifiedAdded on 2022/12/30
|9
|1248
|39
Report
AI Summary
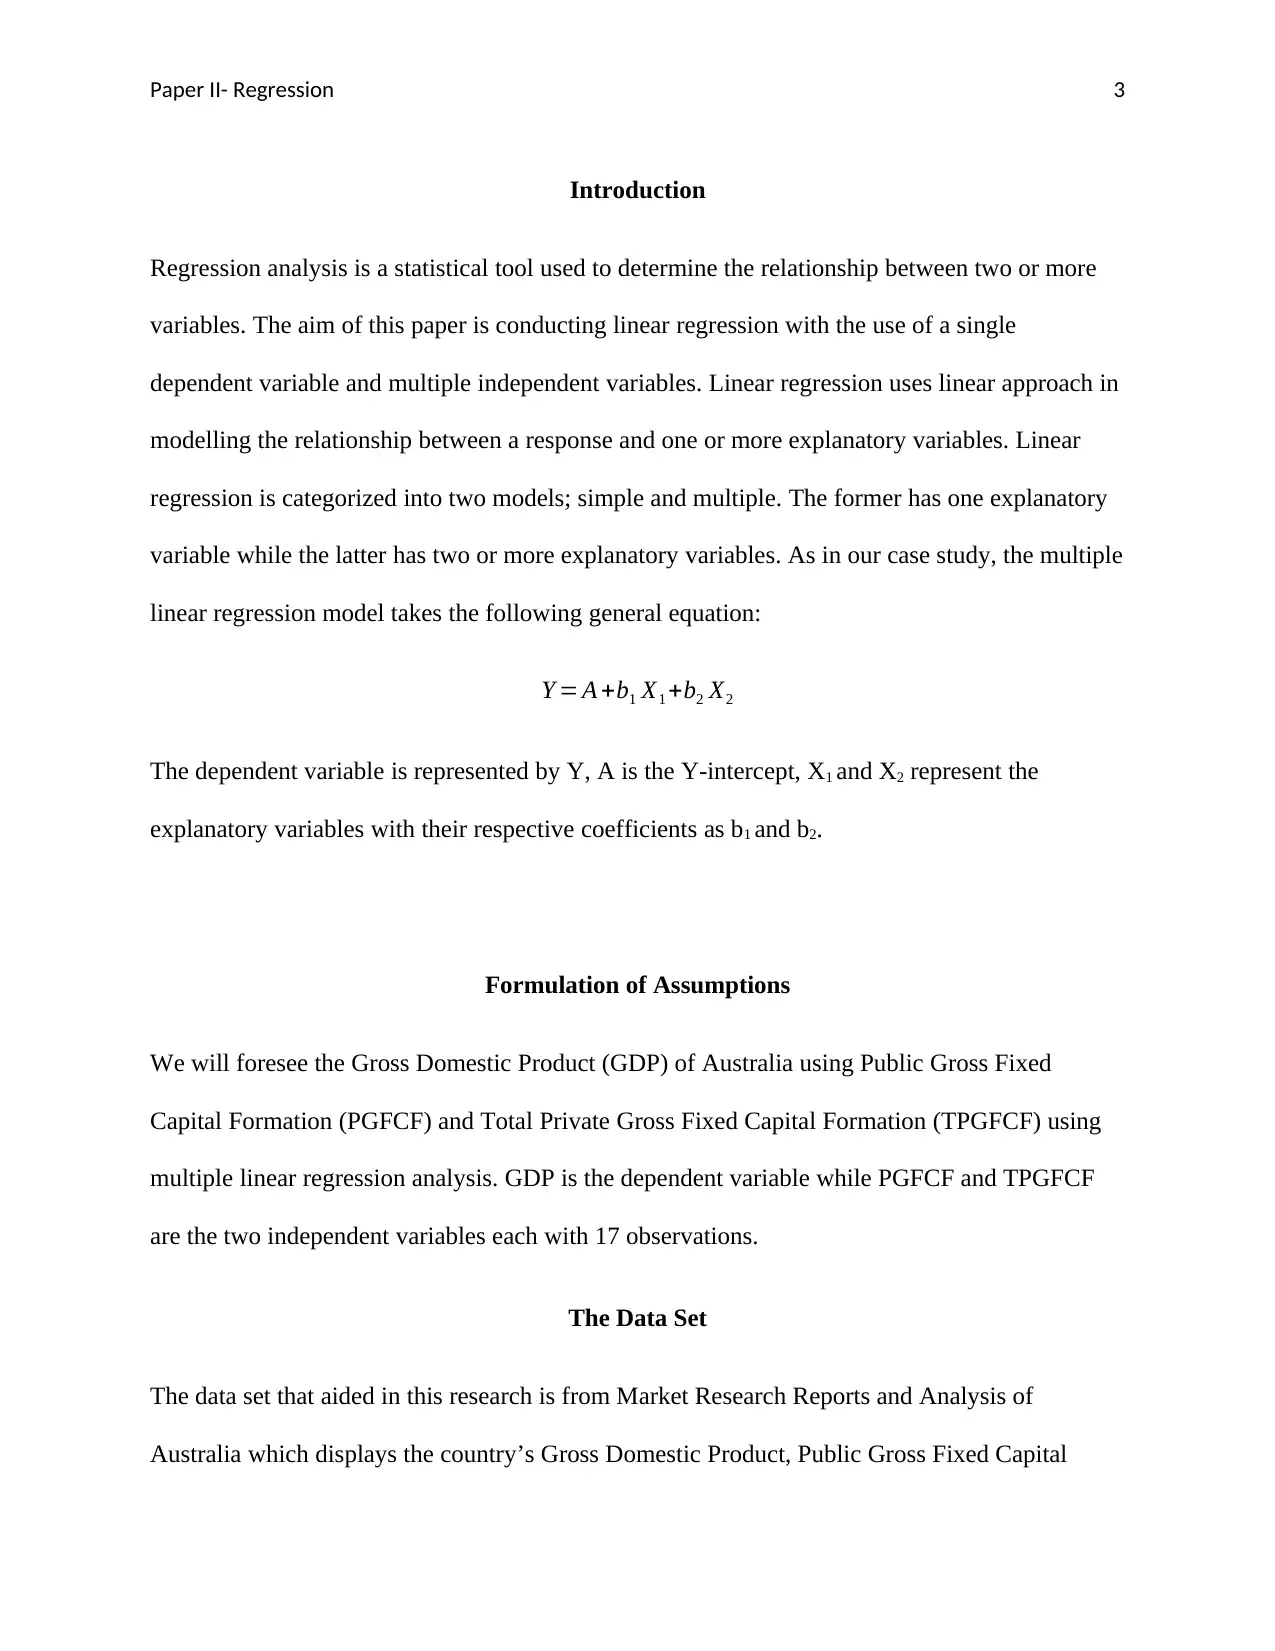
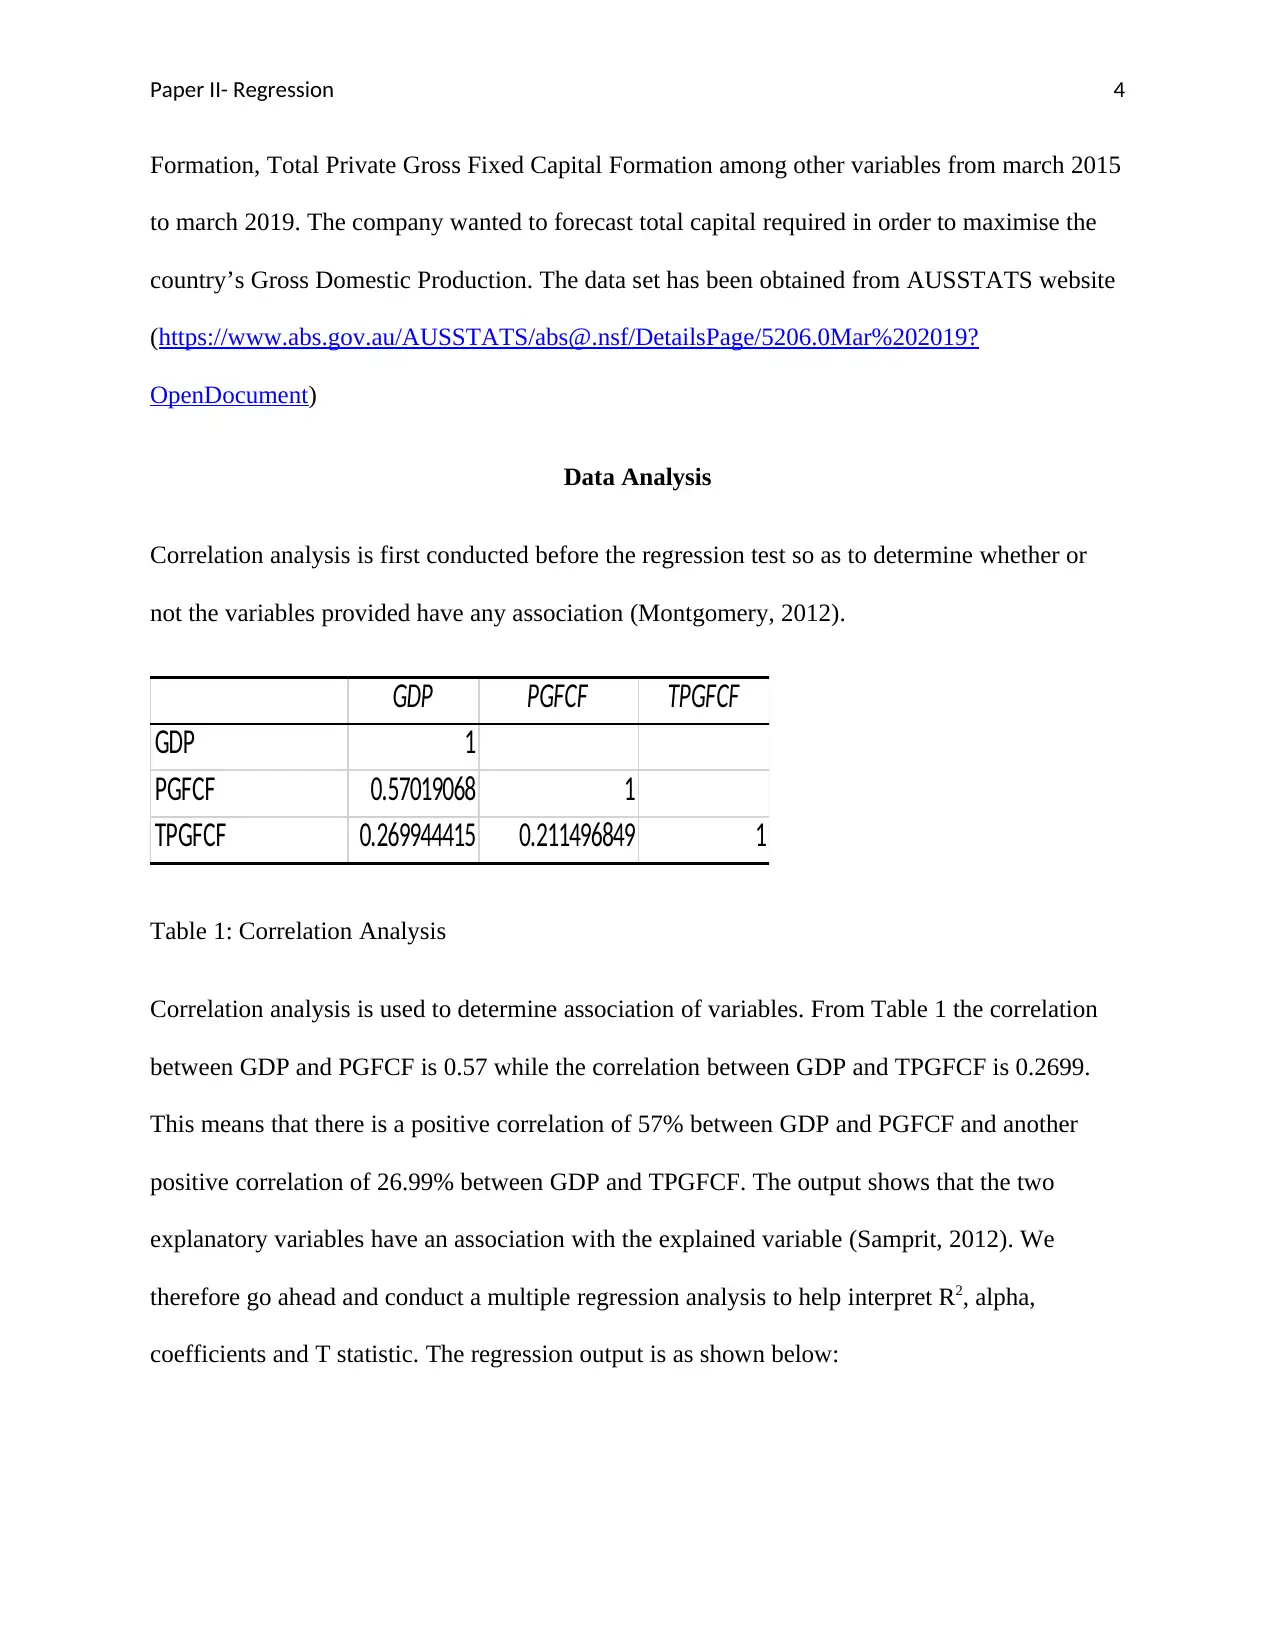
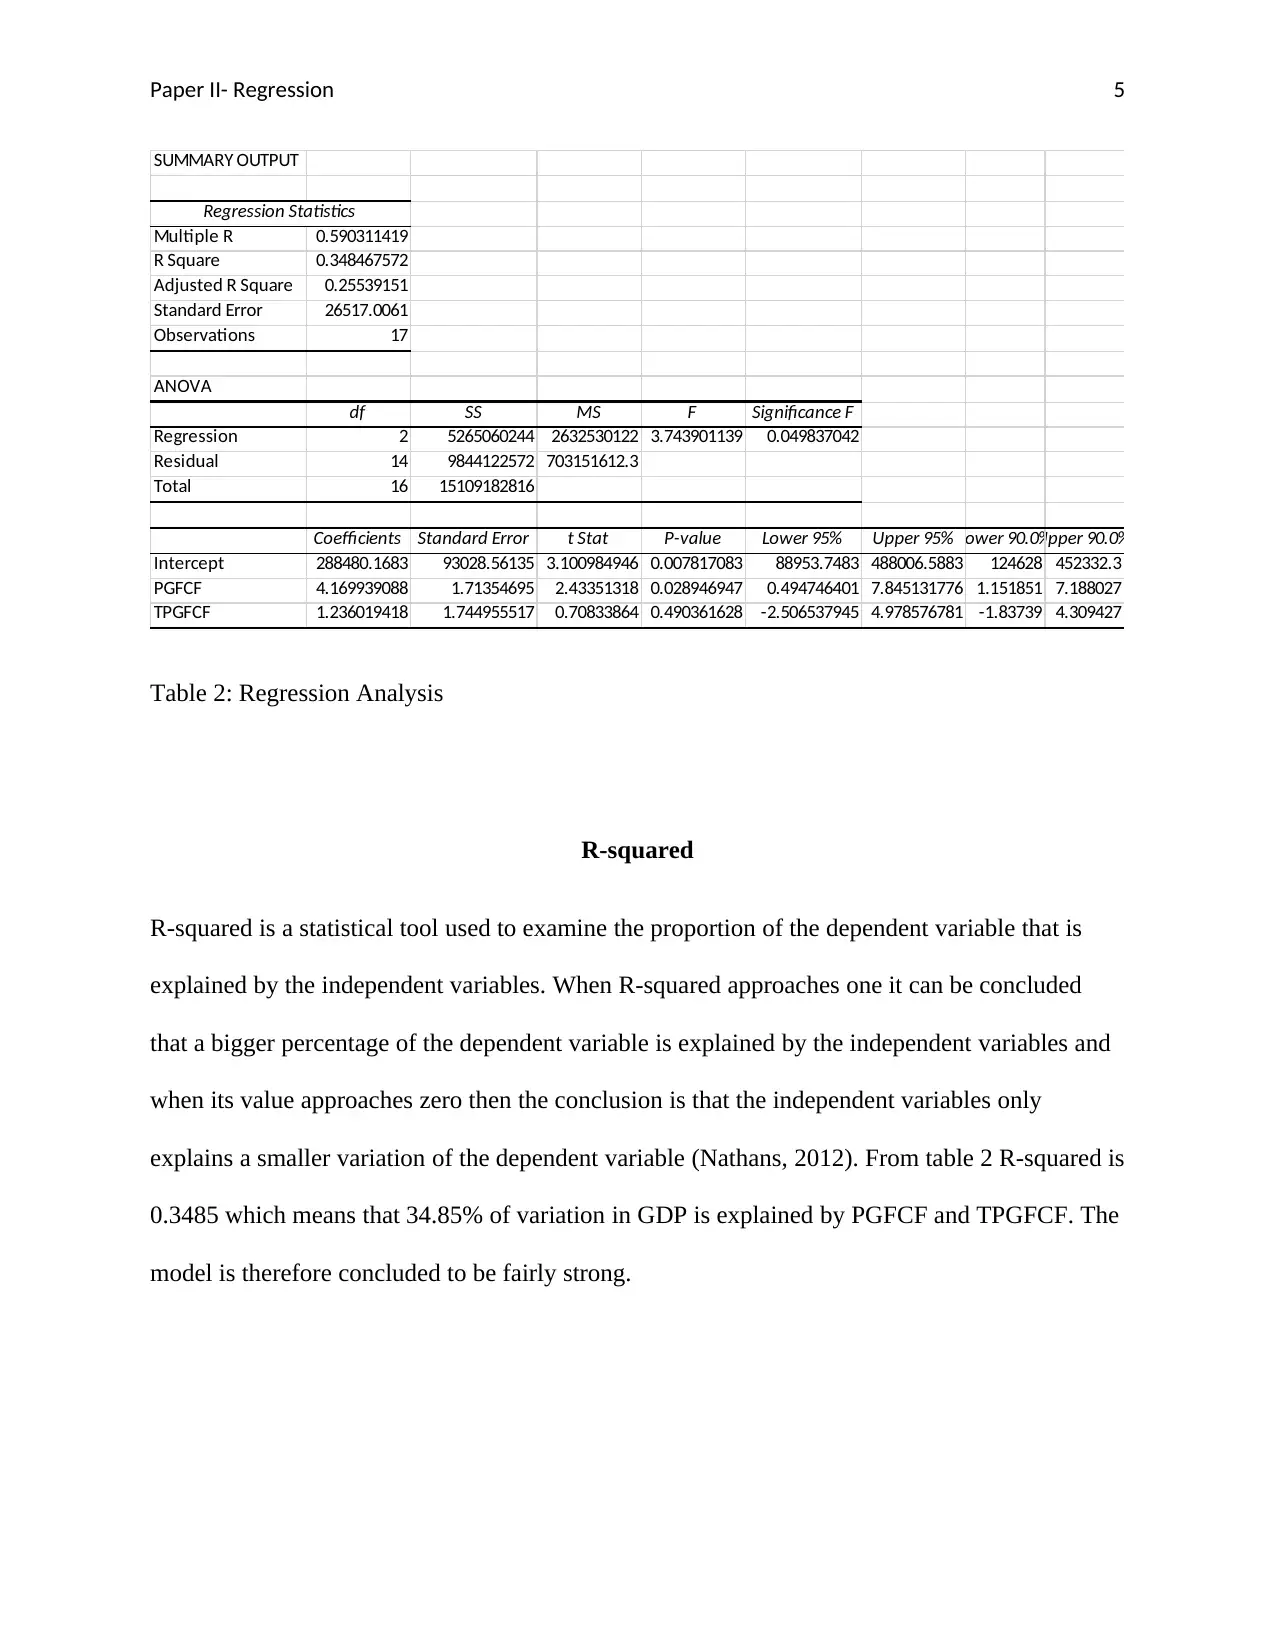
This report presents a multiple linear regression analysis, focusing on the relationship between Australia's Gross Domestic Product (GDP) as the dependent variable, and Public Gross Fixed Capital Formation (PGFCF) and Total Private Gross Fixed Capital Formation (TPGFCF) as independent variables. T...
Read More
Contribute Materials
Your contribution can guide someone’s learning journey. Share your
documents today.

Paper II- Regression 1
Regression Report
by Student’s Name
University
Professor’s Name
Code + Name of Course
Date
Regression Report
by Student’s Name
University
Professor’s Name
Code + Name of Course
Date
Secure Best Marks with AI Grader
Need help grading? Try our AI Grader for instant feedback on your assignments.

Paper II- Regression 2
Table of Contents
Introduction.................................................................................................................................................3
Formulation of Assumptions...................................................................................................................3
The Data Set................................................................................................................................................3
Data Analysis...............................................................................................................................................4
R-squared................................................................................................................................................5
Alpha level (α ¿........................................................................................................................................5
Coefficients..............................................................................................................................................6
T statistic.................................................................................................................................................7
Conclusion...................................................................................................................................................7

Paper II- Regression 3
Introduction
Regression analysis is a statistical tool used to determine the relationship between two or more
variables. The aim of this paper is conducting linear regression with the use of a single
dependent variable and multiple independent variables. Linear regression uses linear approach in
modelling the relationship between a response and one or more explanatory variables. Linear
regression is categorized into two models; simple and multiple. The former has one explanatory
variable while the latter has two or more explanatory variables. As in our case study, the multiple
linear regression model takes the following general equation:
Y = A +b1 X1 +b2 X2
The dependent variable is represented by Y, A is the Y-intercept, X1 and X2 represent the
explanatory variables with their respective coefficients as b1 and b2.
Formulation of Assumptions
We will foresee the Gross Domestic Product (GDP) of Australia using Public Gross Fixed
Capital Formation (PGFCF) and Total Private Gross Fixed Capital Formation (TPGFCF) using
multiple linear regression analysis. GDP is the dependent variable while PGFCF and TPGFCF
are the two independent variables each with 17 observations.
The Data Set
The data set that aided in this research is from Market Research Reports and Analysis of
Australia which displays the country’s Gross Domestic Product, Public Gross Fixed Capital

Paper II- Regression 4
Formation, Total Private Gross Fixed Capital Formation among other variables from march 2015
to march 2019. The company wanted to forecast total capital required in order to maximise the
country’s Gross Domestic Production. The data set has been obtained from AUSSTATS website
(https://www.abs.gov.au/AUSSTATS/abs@.nsf/DetailsPage/5206.0Mar%202019?
OpenDocument)
Data Analysis
Correlation analysis is first conducted before the regression test so as to determine whether or
not the variables provided have any association (Montgomery, 2012).
GDP PGFCF TPGFCF
GDP 1
PGFCF 0.57019068 1
TPGFCF 0.269944415 0.211496849 1
Table 1: Correlation Analysis
Correlation analysis is used to determine association of variables. From Table 1 the correlation
between GDP and PGFCF is 0.57 while the correlation between GDP and TPGFCF is 0.2699.
This means that there is a positive correlation of 57% between GDP and PGFCF and another
positive correlation of 26.99% between GDP and TPGFCF. The output shows that the two
explanatory variables have an association with the explained variable (Samprit, 2012). We
therefore go ahead and conduct a multiple regression analysis to help interpret R2, alpha,
coefficients and T statistic. The regression output is as shown below:
Secure Best Marks with AI Grader
Need help grading? Try our AI Grader for instant feedback on your assignments.

Paper II- Regression 5
SUMMARY OUTPUT
Regression Statistics
Multiple R 0.590311419
R Square 0.348467572
Adjusted R Square 0.25539151
Standard Error 26517.0061
Observations 17
ANOVA
df SS MS F Significance F
Regression 2 5265060244 2632530122 3.743901139 0.049837042
Residual 14 9844122572 703151612.3
Total 16 15109182816
Coefficients Standard Error t Stat P-value Lower 95% Upper 95% Lower 90.0%Upper 90.0%
Intercept 288480.1683 93028.56135 3.100984946 0.007817083 88953.7483 488006.5883 124628 452332.3
PGFCF 4.169939088 1.71354695 2.43351318 0.028946947 0.494746401 7.845131776 1.151851 7.188027
TPGFCF 1.236019418 1.744955517 0.70833864 0.490361628 -2.506537945 4.978576781 -1.83739 4.309427
Table 2: Regression Analysis
R-squared
R-squared is a statistical tool used to examine the proportion of the dependent variable that is
explained by the independent variables. When R-squared approaches one it can be concluded
that a bigger percentage of the dependent variable is explained by the independent variables and
when its value approaches zero then the conclusion is that the independent variables only
explains a smaller variation of the dependent variable (Nathans, 2012). From table 2 R-squared is
0.3485 which means that 34.85% of variation in GDP is explained by PGFCF and TPGFCF. The
model is therefore concluded to be fairly strong.

Paper II- Regression 6
Alpha level (α ¿
The alpha level is the probability of rejecting the null hypothesis when it is true. The alpha value
is used in testing significance level of the independent variable as well as to test the hypothesis.
Together with P-values, alpha level tests the significance of independent variables. Also,
Significance F together with alpha level test the hypotheses. In our regression we used alpha as
0.1 and can conclude from the table that PGFCF is significant since P_value=0.0289 which is
less than alpha. TPDFCF on the other hand is not significant because its p-value is greater than
alpha. This is because most of the Private Sector concentrate more of their capital on
international trades and less on domestic production. For hypothesis testing we use the
Significance F-value and reject the null hypothesis if the F-value is less than alpha level,
otherwise the null hypothesis is accepted. Significance F-value in our case is less than the alpha
level therefore we allow the alternate hypothesis (Javanmard, 2014). It can hence be concluded
that the independent variables PGFCF and TPGFCF are related with the dependent variable
GDP.
Coefficients
GDP=288480.17+4.17 PGFCF +1.24 TPGFCF
Above is the summary of the regression analysis coefficients obtained from the excel output.
This can be interpreted as follows;

Paper II- Regression 7
GDP of 288480.17 $ millions is not affected by both PGFCF and TPGFCF. A unit increase in
PGFCF increases GDP by 4.17 $ millions while a unit increase in TPGFCF increases GDP by
1.24 $ millions (Nathans, 2012). It can be concluded that increase in both PGFCF and TPGFCF
causes an increase in GDP.
T statistic
T statistic is the coefficient estimate divided by the standard error. If it is less than -2 or greater
than 2 then the coefficient of independent variable is significant with a confidence of 90% and
above (Polit, 2010). In our case the t- statistic value for PGFCF is 2.43 hence its coefficient is
significant. For TPGFCF with t-statistic of 0.71 the coefficient is not significant implying that
the private sector is contributing less capital in domestic production.
Conclusion
The government can use the regression output obtained to make some decisions. For it to
increase domestic production, the government should focus more on increasing capital from
public sector. This is because most of public’s resources are channelled into domestic production
unlike the private sector whose concentration is on international trading and would therefore
have less impact on domestic production.
Paraphrase This Document
Need a fresh take? Get an instant paraphrase of this document with our AI Paraphraser

Paper II- Regression 8
References
Javanmard, A. &. (2014). Confidence intervals and hypothesis testing for high-dimensional
regression. The Jpurnal of Machine Learning Research, 15(1),2869-2909.
Montgomery, D. C. (2012). Introduction to linear regression analysis (Vol. 821). John Wiley
and Sons.
Nathans, L. L. (2012). Interpreting multiple linear regression: A guidebook of variable
importance. Practical assessment , research and evaluation, 17(9).
Polancszyk, G. V. (2014). ADHD prevalence estimates across three decades: an updated
systematic review and metaregression analysis. Innternational journal of epidemiology,
43(2), 434-442.
Polit, D. F. (2010). Statistics and data analysis for nursing research. Upper Saddle River: NJ:
Pearson.
Samprit, C. &. (2012). Handbook of regression analysis. New Jersy: John Wiley & Sons.
Sanford, W. (2013). Applied linear regression (4th ed.). Hoboken: John Wiley & Sons.
Tomasello, M. M. (2012). Two key steps in the evolution ofhuman cooperation: The
interdependence hypothesis. Current Antropology,53(6), 000-000.

Paper II- Regression 9
1 out of 9
Related Documents

Your All-in-One AI-Powered Toolkit for Academic Success.
+13062052269
info@desklib.com
Available 24*7 on WhatsApp / Email
Unlock your academic potential
© 2024 | Zucol Services PVT LTD | All rights reserved.