Tire Sales Prediction using Regression Analysis - MTH/216 Project

Verified

Added on  2023/04/25

|7
|529
|498
Project
AI Summary
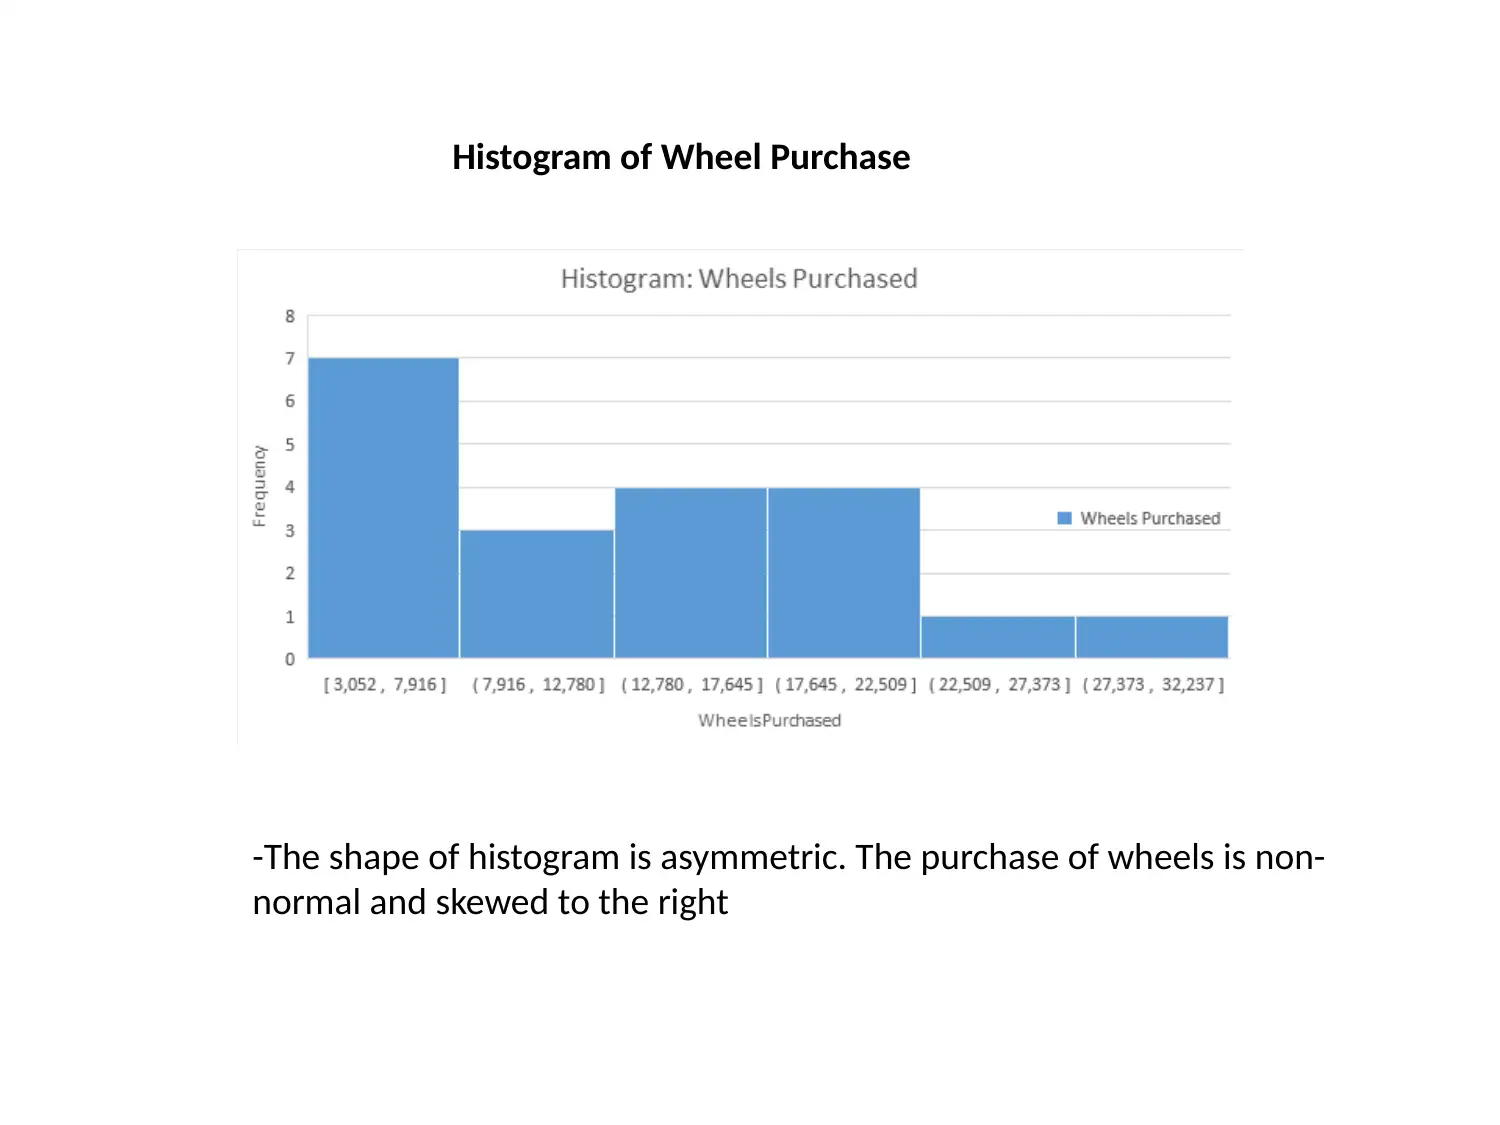
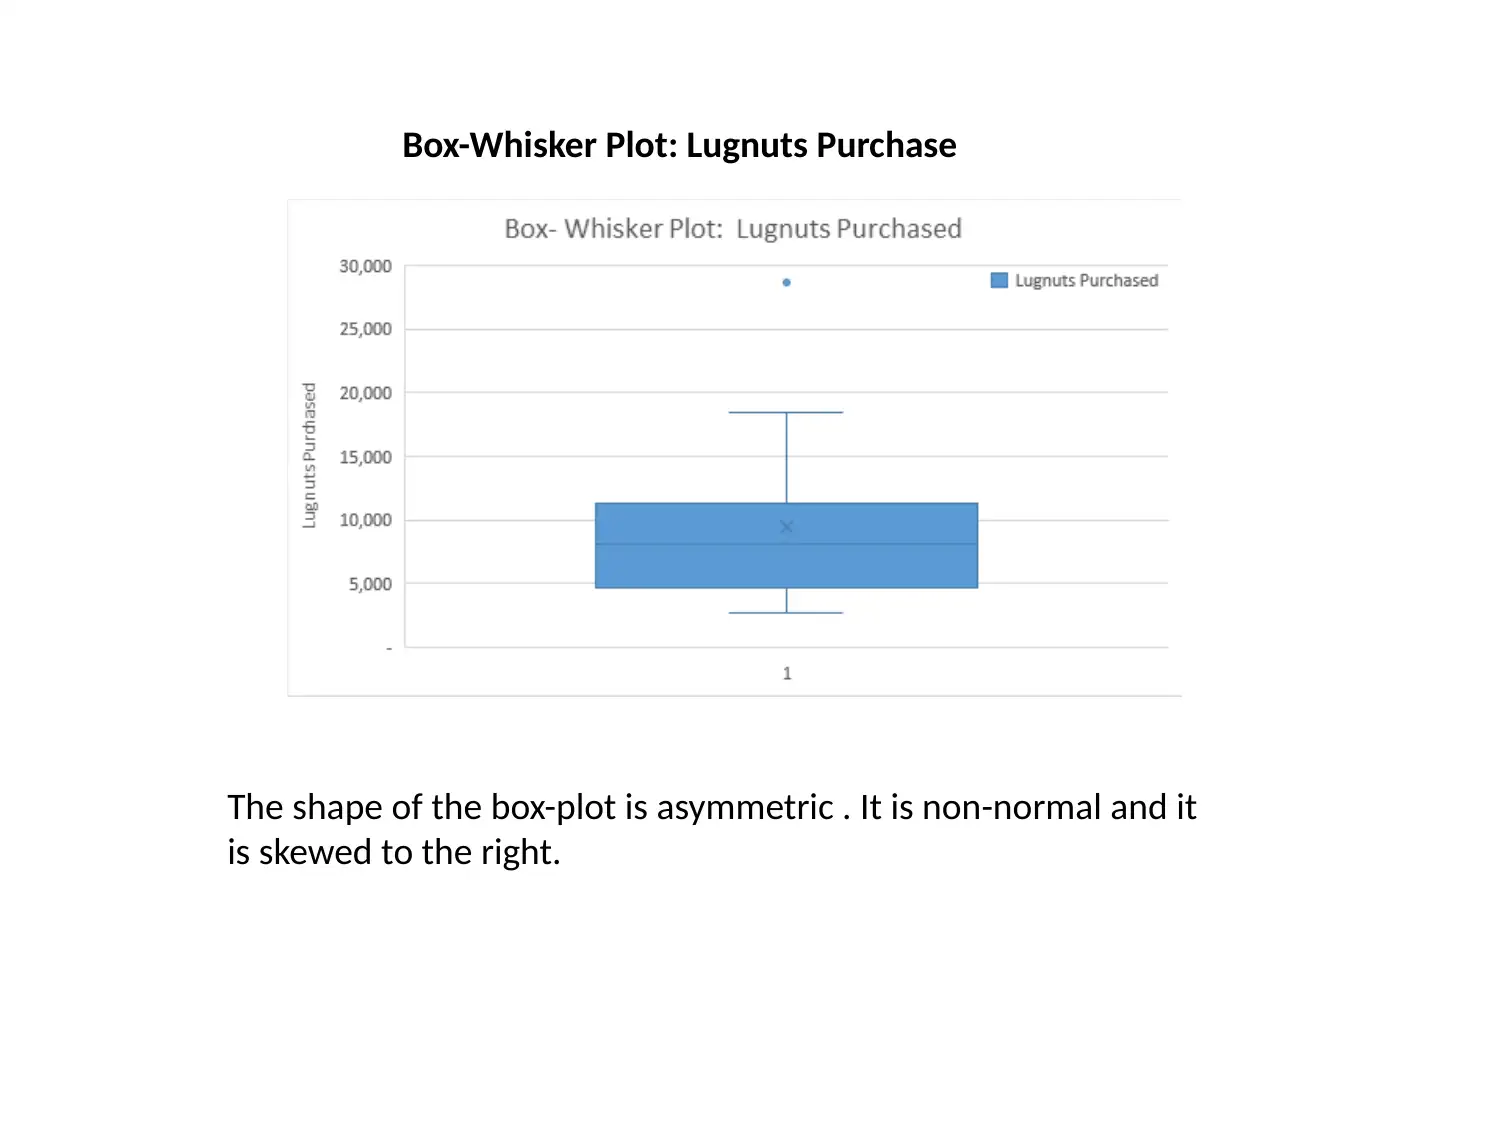
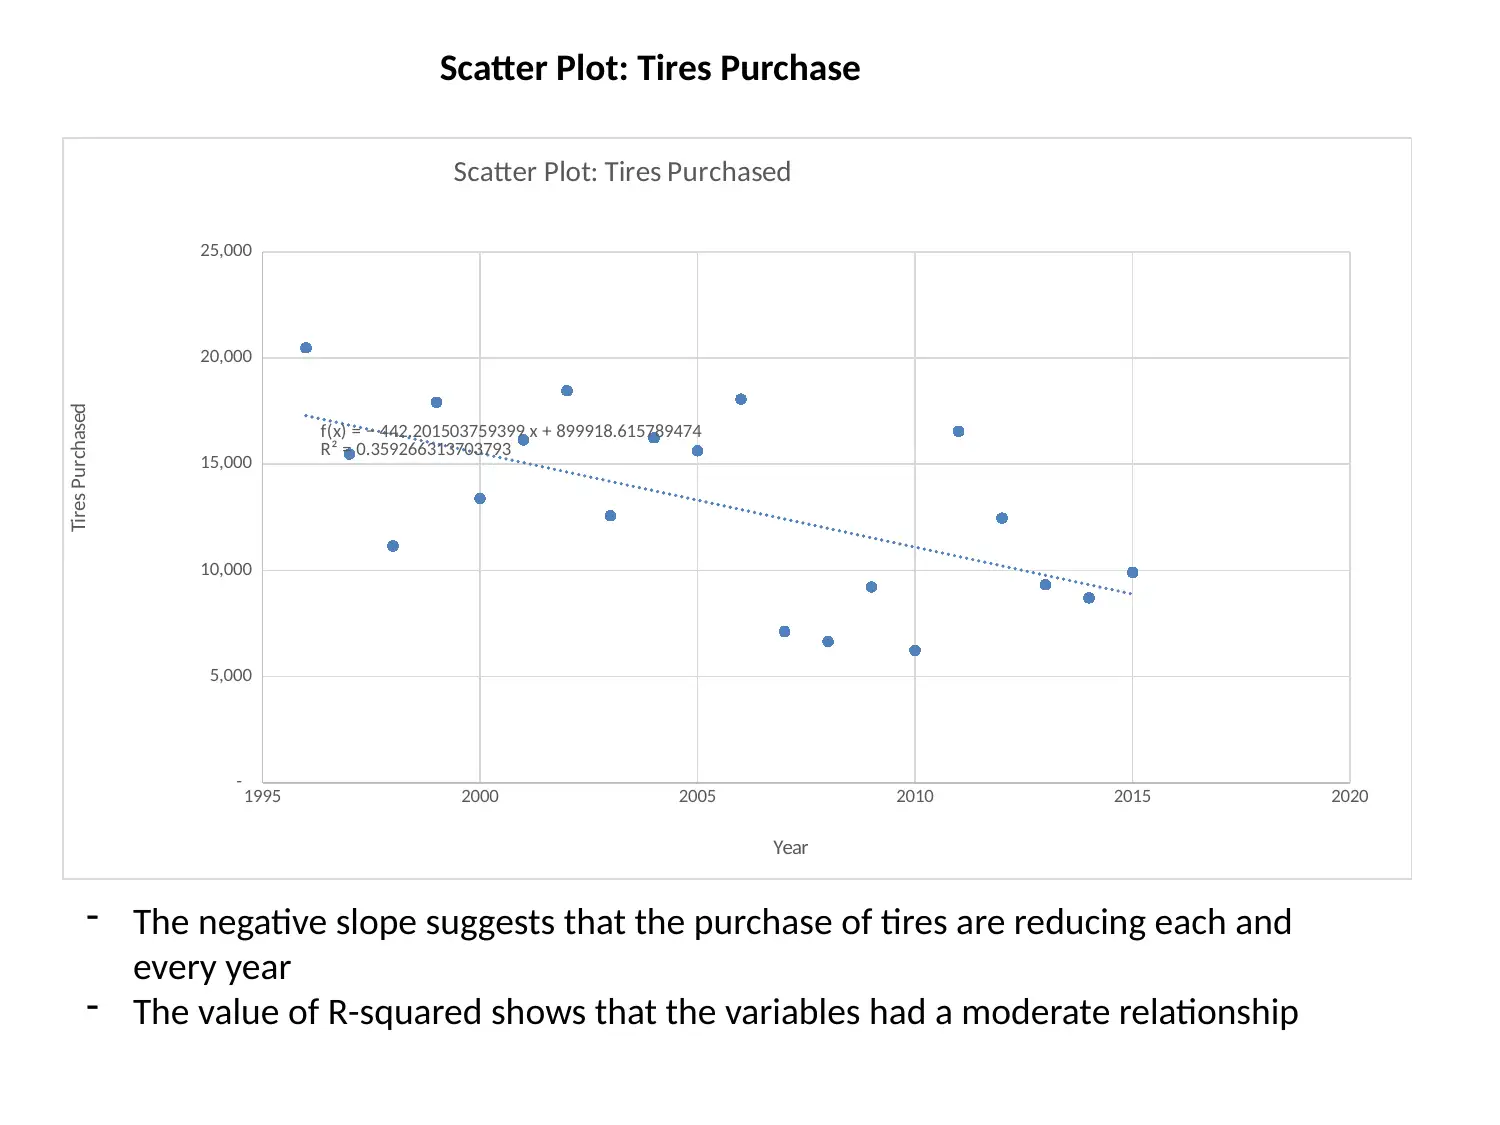
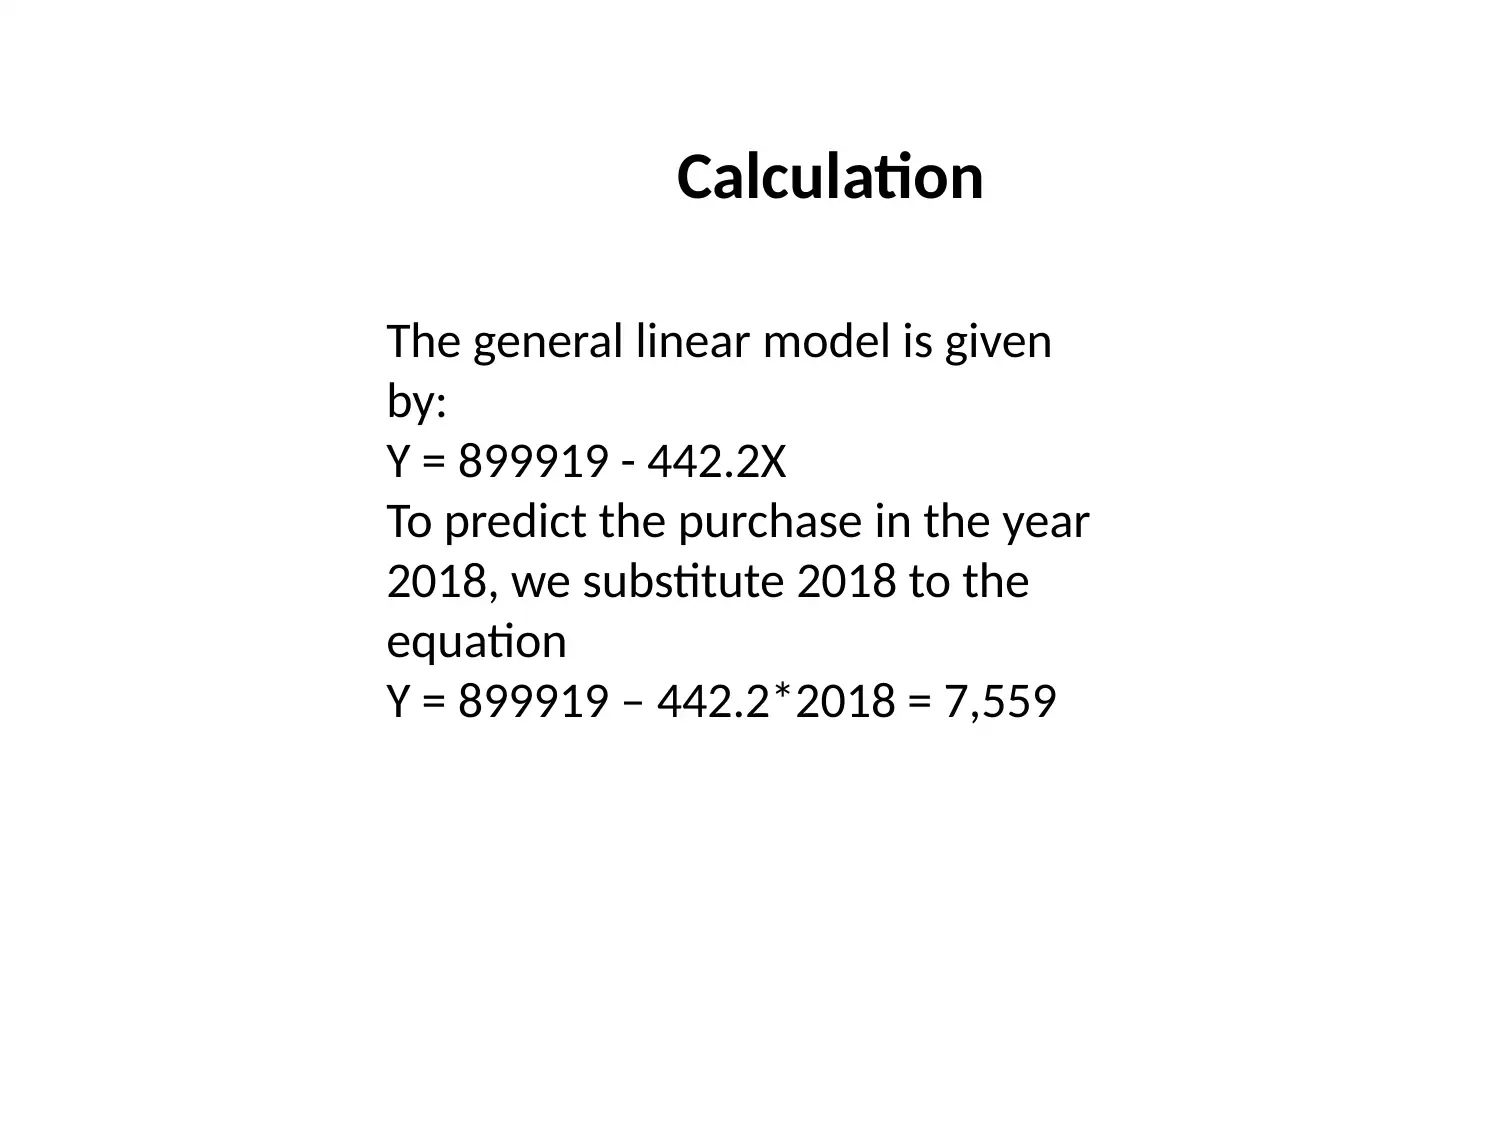
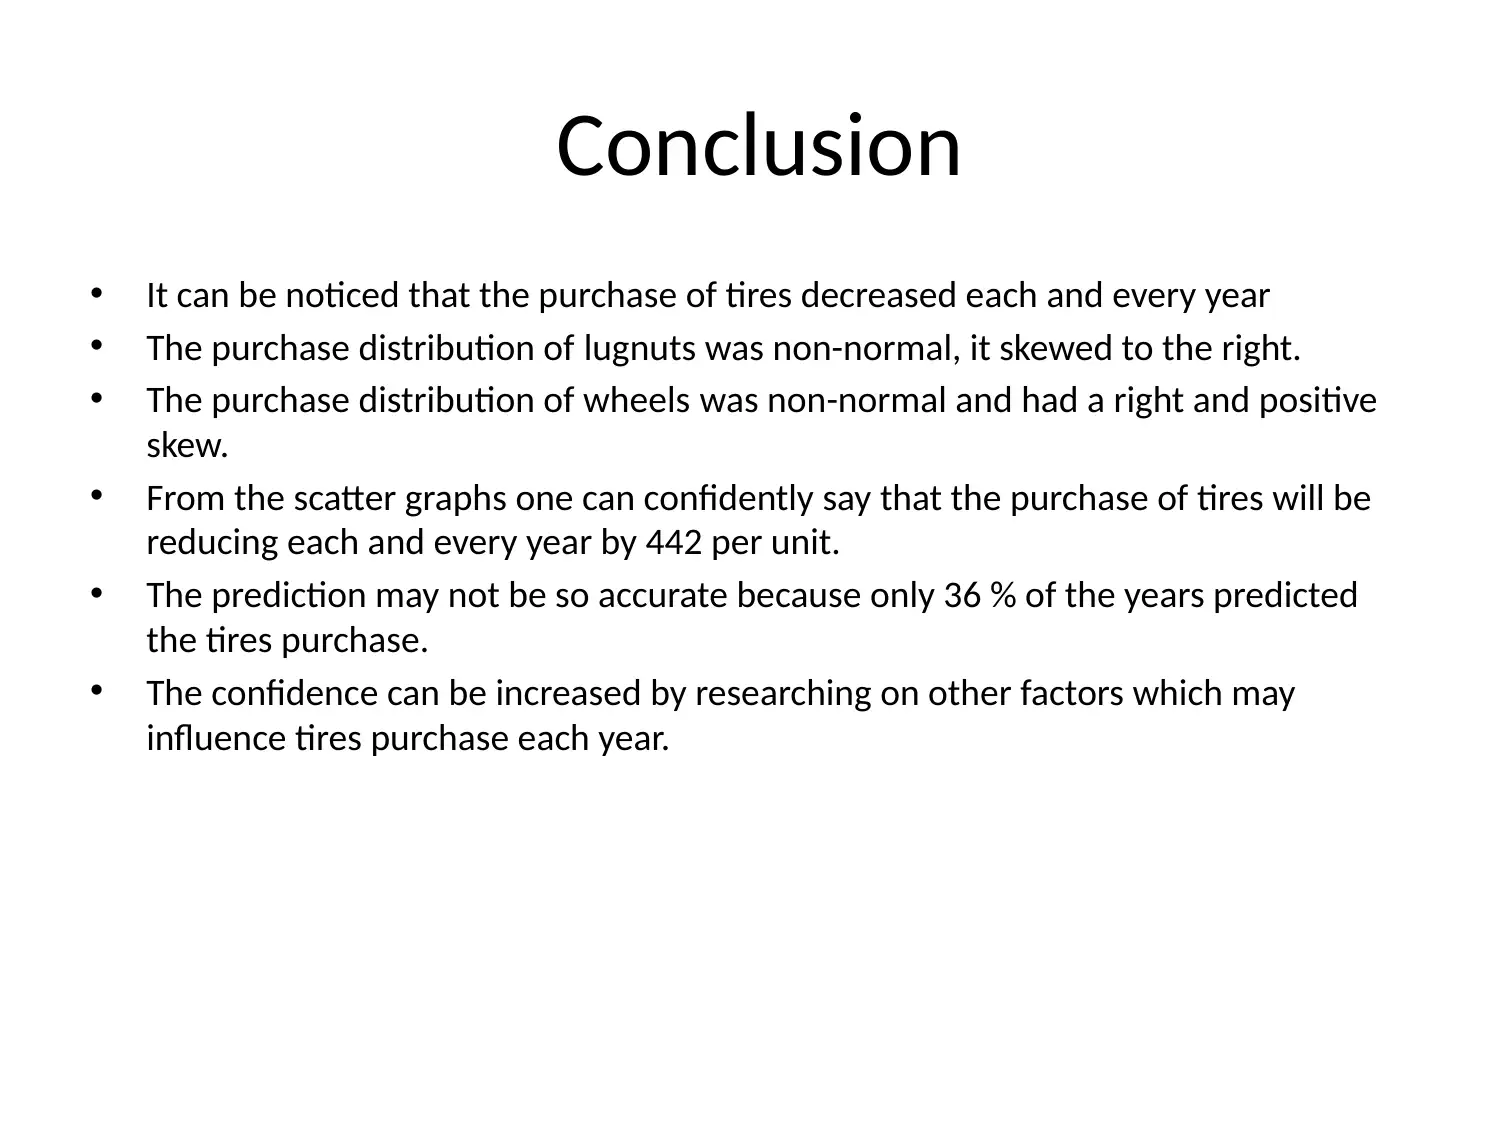
This project focuses on predicting the number of tires to be sold using data from previous years, with a secondary look at the trends of lugnuts and wheel purchases. The project utilizes regression analysis to forecast tire sales for 2018, estimating a purchase of 7,559 tires. The analysis includes histograms and box-whisker plots to assess the distribution of wheel and lugnut purchases, revealing non-normal distributions skewed to the right. A scatter plot illustrates a negative trend in tire purchases over the years, suggesting a decline of approximately 442 units per year. The project acknowledges that the prediction's accuracy is limited by the R-squared value, indicating a moderate relationship between the variables, and suggests further research into other influencing factors to improve confidence in future predictions. The study uses statistical learning elements and quantitative methods in business research.
Document Page
Introduction
The aim of the assignment was to predict a business scenario. The topic chosen
was to predict number of tires to be sold using data from the previous years. The
trend of purchase of Lugnuts and Wheels will also be shown but not a major
focus. It is a topic of interest because of the economy change over the past
years. It interests me because I want to major in Business Management and the
predictive analytics will expand my knowledge in this field. It is something that
people engaging in that kind of business should have some knowledge about.
The audience should grasp the basic information of the trend of tires sales over
the years. About life’s facts, this gives knowledge about the kind of businesses
that are fading out from the real market. It was estimated that 7,559 tires would
be purchased by customers in 2018 .
tabler-icon-diamond-filled.svg

Paraphrase This Document

Need a fresh take? Get an instant paraphrase of this document with our AI Paraphraser
Document Page
Histogram of Wheel Purchase
-The shape of histogram is asymmetric. The purchase of wheels is non-
normal and skewed to the right
Document Page
Box-Whisker Plot: Lugnuts Purchase
The shape of the box-plot is asymmetric . It is non-normal and it
is skewed to the right.
Document Page
1995 2000 2005 2010 2015 2020
-
5,000
10,000
15,000
20,000
25,000
f(x) = − 442.201503759399 x + 899918.615789474
R² = 0.359266313703793
Scatter Plot: Tires Purchased
Year
Tires Purchased
Scatter Plot: Tires Purchase
- The negative slope suggests that the purchase of tires are reducing each and
every year
- The value of R-squared shows that the variables had a moderate relationship
tabler-icon-diamond-filled.svg

Paraphrase This Document

Need a fresh take? Get an instant paraphrase of this document with our AI Paraphraser
Document Page
The general linear model is given
by:
Y = 899919 - 442.2X
To predict the purchase in the year
2018, we substitute 2018 to the
equation
Y = 899919 – 442.2*2018 = 7,559
Calculation
Document Page
Conclusion
It can be noticed that the purchase of tires decreased each and every year
The purchase distribution of lugnuts was non-normal, it skewed to the right.
The purchase distribution of wheels was non-normal and had a right and positive
skew.
From the scatter graphs one can confidently say that the purchase of tires will be
reducing each and every year by 442 per unit.
The prediction may not be so accurate because only 36 % of the years predicted
the tires purchase.
The confidence can be increased by researching on other factors which may
influence tires purchase each year.
Document Page
References
Eriksson, P. & Kovalainen, A. (2015) Quantitative methods in business research. 3rd
ed. London: Sage Publications.
Flick, U. (2015) Introducing research methodology: A beginner's guide to doing a
research project. 4th ed. New York: Sage Publications.
Hastie, T., Tibshirani, R. & Friedman, J. (2014) The Elements of Statistical Learning.
4th ed. New York: Springer Publications.
Hillier, F. (2016) Introduction to Operations Research. 6th ed. New York: McGraw
Hill Publications
chevron_up_icon
1 out of 7
circle_padding
hide_on_mobile
zoom_out_icon
[object Object]