REITS Analysis Report
VerifiedAdded on 2020/03/16
|24
|4284
|284
Report
AI Summary
This report provides a comprehensive analysis of two major Australian real estate investment trusts (REITS), Goodman Group and Mirvac Group. It evaluates their business summaries, property portfolios, historical share performances, financial performances, and profitability metrics. The report also includes market commentary and a comparison of key statistics, highlighting the strengths and weaknesses of each group. Recommendations for investors are provided based on the findings.

REITS
Name of the Student:
Name of the University:
Authors note:
Name of the Student:
Name of the University:
Authors note:
Paraphrase This Document
Need a fresh take? Get an instant paraphrase of this document with our AI Paraphraser
Table of Contents
Introduction:...............................................................................................................................2
Goodman Group:........................................................................................................................3
Business Summary:................................................................................................................3
Property Portfolio:..................................................................................................................4
Historic Share Performance:..................................................................................................4
Financial Performance:..........................................................................................................6
Profitability:...........................................................................................................................8
MIRVAC Group.........................................................................................................................9
Business summary:...............................................................................................................10
Property Portfolio:................................................................................................................11
Share Performance:..............................................................................................................16
Financial Performance:........................................................................................................17
Profitability:.........................................................................................................................19
Market Commentary................................................................................................................20
General Market Commentary:..............................................................................................20
Retail and Office Market:.....................................................................................................20
Industrial Market:.................................................................................................................20
Comparison:.........................................................................................................................21
Risks:....................................................................................................................................21
Reference..................................................................................................................................23
Introduction:
In this report, an effort has been made to compare and evaluate the activities and
performance of two Australia based real estate companies that are Mirvac Group and
Goodman Group. In this report discussion as well as evaluation regarding several aspects of
both the companies has been made which includes Business Summary, portfolio of the
company’s properties, historical performance of shares, financial information, profitability
and holding period return of both the companies (Afolayan 2017). On successful evaluation
of each of the following points as well as funds, a report has been prepared to facilitate
comparison between the two companies and to provide appropriate recommendations to the
investors and other important clients and peoples.
Goodman Group:
Business Summary:
Goodman Group is an Australia based real estate company that owns, manages and
develops business areas and industrial spaces of high and premium quality. According to the
current records, Goodman Group has over 161 established properties around Australia
location in different major cities like Adelaide, Brisbane, Melbourne, Perth and Sydney
(Brounen and de Koning 2013). The primary objective of this group is establishment of
secure and long-term relation with its client by providing services of premium quality backed
by incomparable standard. The blue-chip client database of Goodman Group includes a wide
⊘ This is a preview!⊘
Do you want full access?
Subscribe today to unlock all pages.
Trusted by 1+ million students worldwide
range of well-established and branded industries like Linfox, DHL, Coca-Cola, TNT,
Brambles and Toll.
An essential and important subsidiary of Goodman Group is Goodman Australia. In
the four unlisted property funds, i.e. Goodman Australia Industrial Partnership (GAIP),
Goodman Australia Partnership (GAP), Goodman Australia Development Partnership
(GADP) and KWASA-Goodman Industrial Partnership (KGIP), Goodman Group is a
cornerstone investor within Australia. The Goodman Australia team comprises of about 300
staffs who have a wide range of professional knowledge regarding Marketing and Finance,
Property, Development, Legal matters, etc. The contribution of all these members and staffs
is the secret behind the success of the entire Goodman Group.
Property Portfolio:
The significant properties of Goodman Australia are scattered all over Eastern and
South Australia’s major cities like Adelaide, Brisbane, Melbourne and Sydney. The group
has divided its entire property into four major categories which are In Adelaide the company
has a property that is under-construction named Corner Edinburgh Road and West Avenue
covering an area of 5000 to 80000 square metre (Hasan. and Sulaiman 2016).
Paraphrase This Document
Need a fresh take? Get an instant paraphrase of this document with our AI Paraphraser
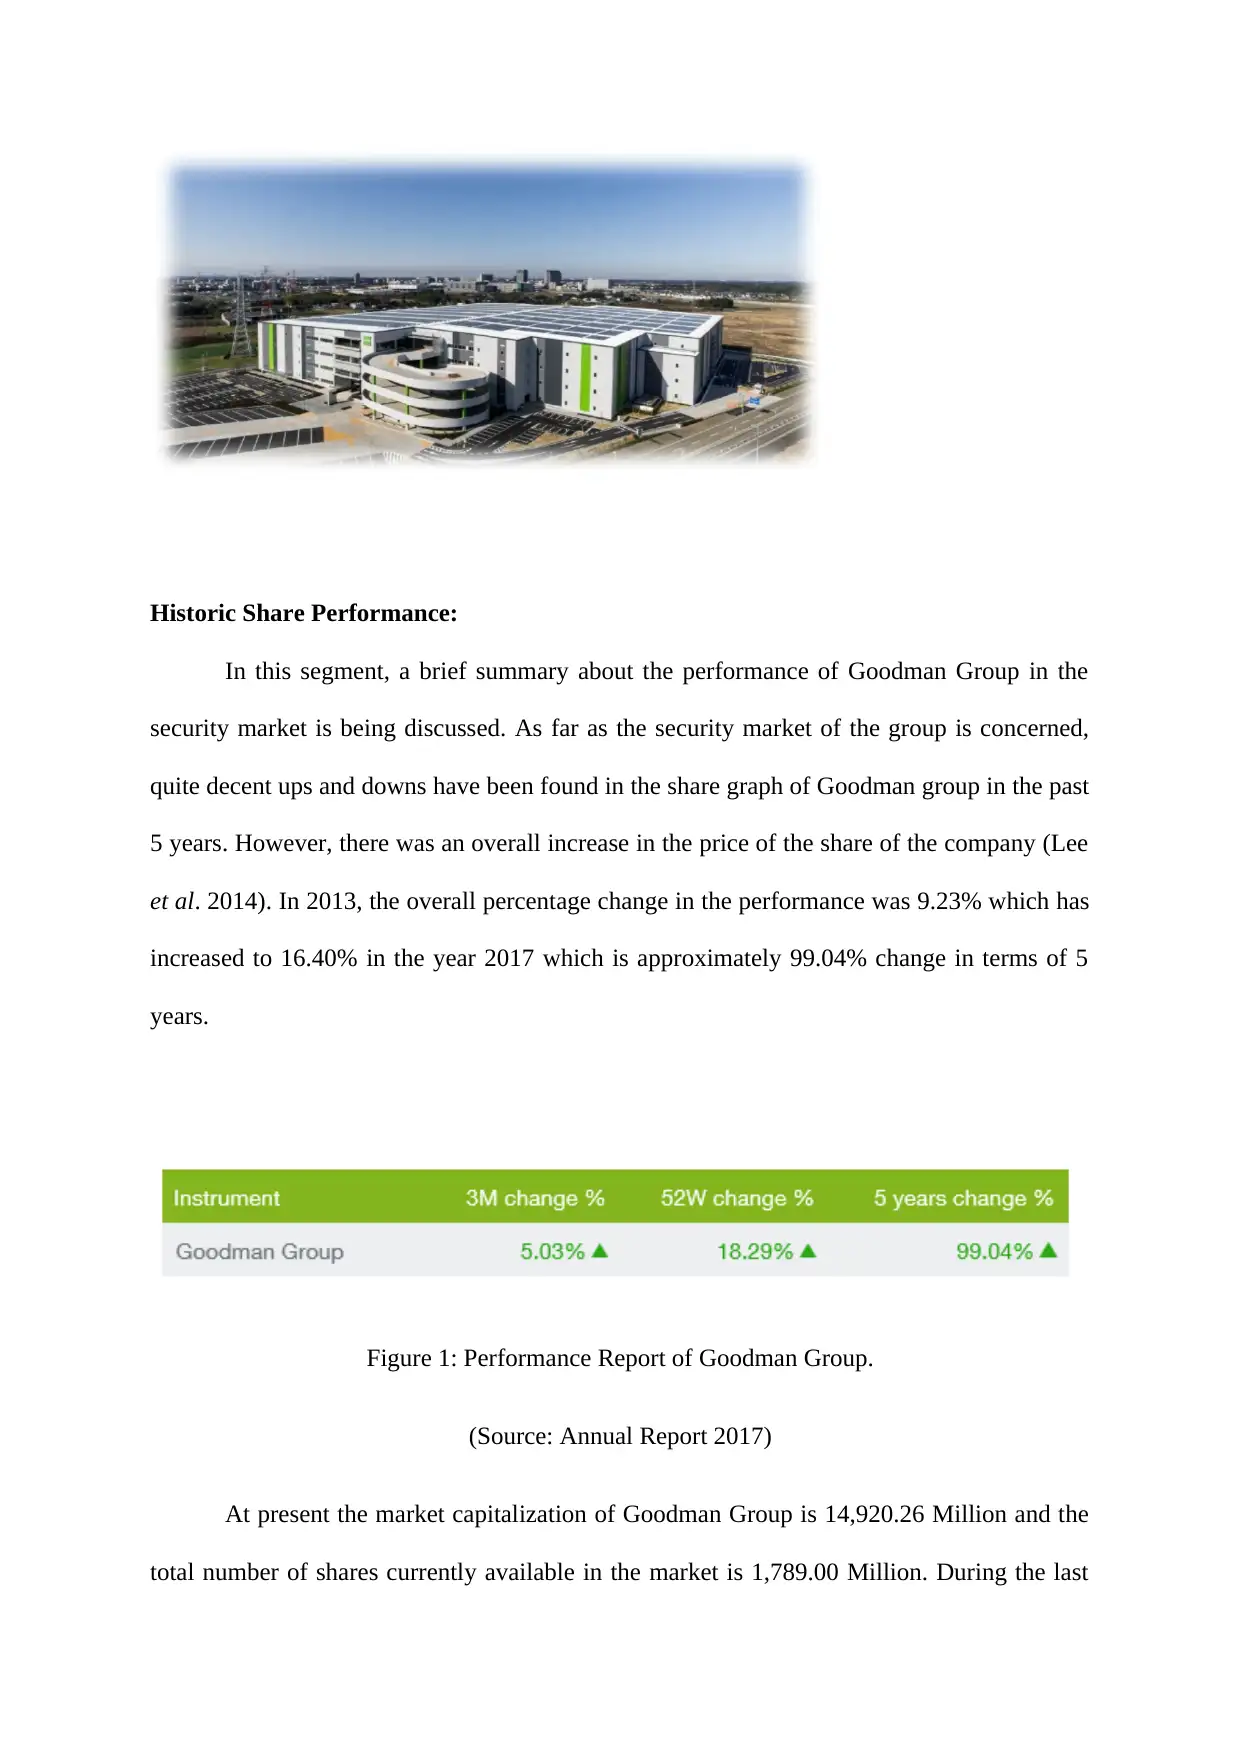
Historic Share Performance:
In this segment, a brief summary about the performance of Goodman Group in the
security market is being discussed. As far as the security market of the group is concerned,
quite decent ups and downs have been found in the share graph of Goodman group in the past
5 years. However, there was an overall increase in the price of the share of the company (Lee
et al. 2014). In 2013, the overall percentage change in the performance was 9.23% which has
increased to 16.40% in the year 2017 which is approximately 99.04% change in terms of 5
years.
Figure 1: Performance Report of Goodman Group.
(Source: Annual Report 2017)
At present the market capitalization of Goodman Group is 14,920.26 Million and the
total number of shares currently available in the market is 1,789.00 Million. During the last
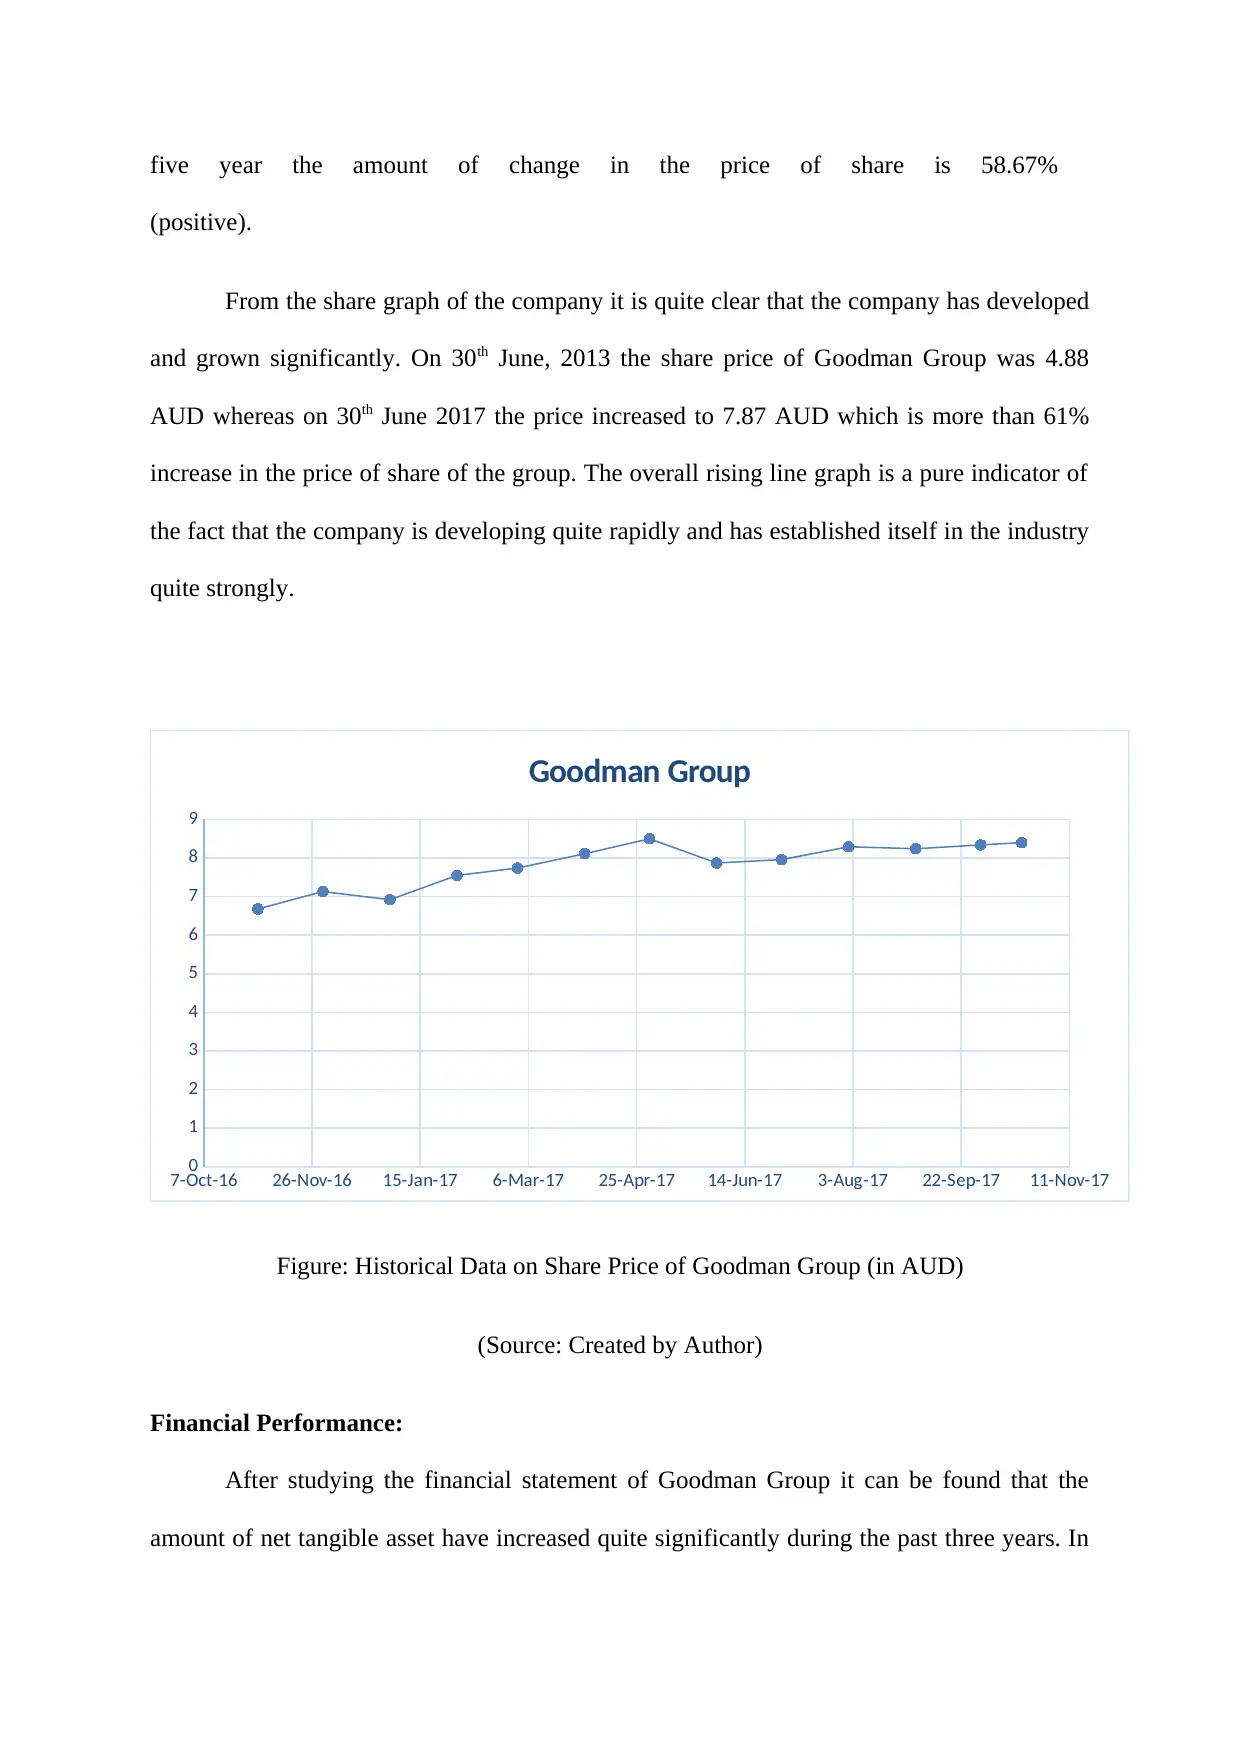
five year the amount of change in the price of share is 58.67%
(positive).
From the share graph of the company it is quite clear that the company has developed
and grown significantly. On 30th June, 2013 the share price of Goodman Group was 4.88
AUD whereas on 30th June 2017 the price increased to 7.87 AUD which is more than 61%
increase in the price of share of the group. The overall rising line graph is a pure indicator of
the fact that the company is developing quite rapidly and has established itself in the industry
quite strongly.
7-Oct-16 26-Nov-16 15-Jan-17 6-Mar-17 25-Apr-17 14-Jun-17 3-Aug-17 22-Sep-17 11-Nov-17
0
1
2
3
4
5
6
7
8
9
Goodman Group
Figure: Historical Data on Share Price of Goodman Group (in AUD)
(Source: Created by Author)
Financial Performance:
After studying the financial statement of Goodman Group it can be found that the
amount of net tangible asset have increased quite significantly during the past three years. In
⊘ This is a preview!⊘
Do you want full access?
Subscribe today to unlock all pages.
Trusted by 1+ million students worldwide
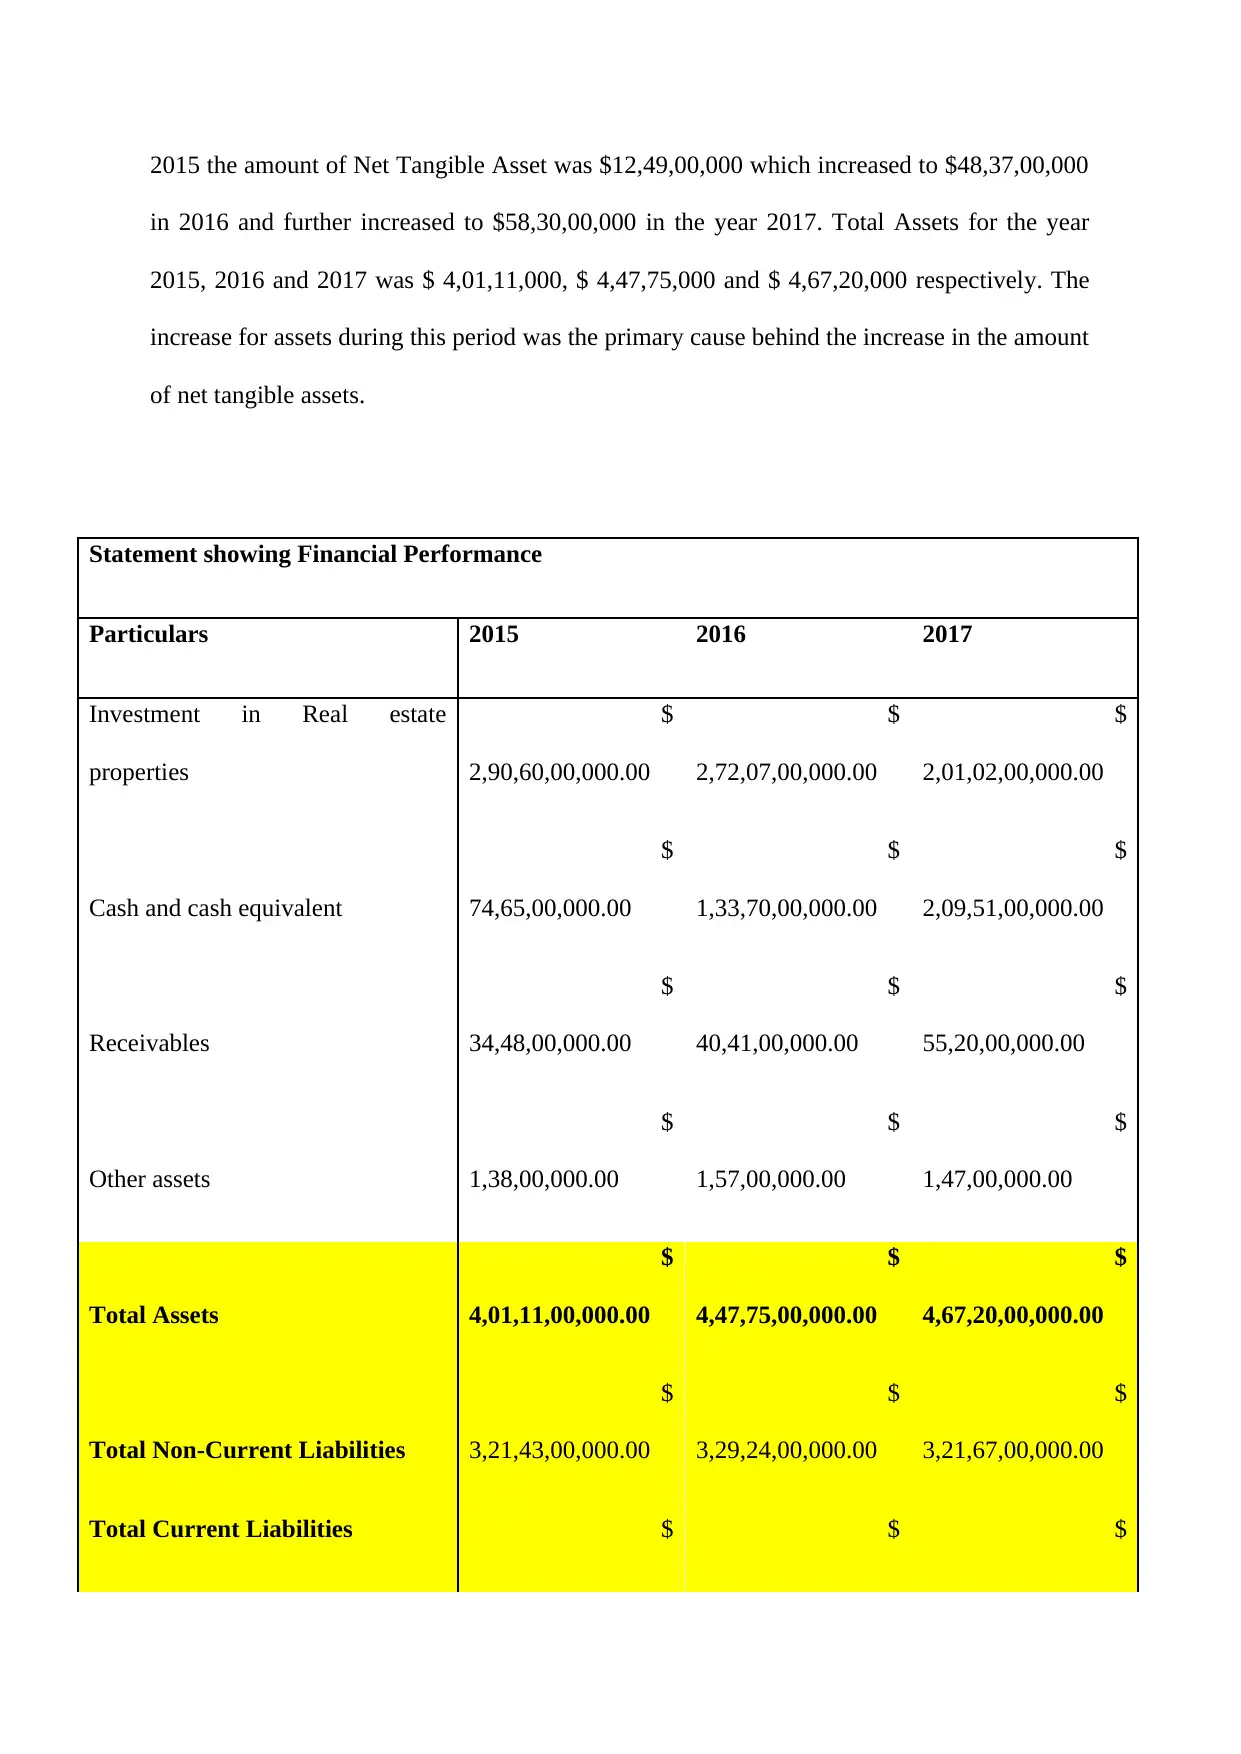
2015 the amount of Net Tangible Asset was $12,49,00,000 which increased to $48,37,00,000
in 2016 and further increased to $58,30,00,000 in the year 2017. Total Assets for the year
2015, 2016 and 2017 was $ 4,01,11,000, $ 4,47,75,000 and $ 4,67,20,000 respectively. The
increase for assets during this period was the primary cause behind the increase in the amount
of net tangible assets.
Statement showing Financial Performance
Particulars 2015 2016 2017
Investment in Real estate
properties
$
2,90,60,00,000.00
$
2,72,07,00,000.00
$
2,01,02,00,000.00
Cash and cash equivalent
$
74,65,00,000.00
$
1,33,70,00,000.00
$
2,09,51,00,000.00
Receivables
$
34,48,00,000.00
$
40,41,00,000.00
$
55,20,00,000.00
Other assets
$
1,38,00,000.00
$
1,57,00,000.00
$
1,47,00,000.00
Total Assets
$
4,01,11,00,000.00
$
4,47,75,00,000.00
$
4,67,20,00,000.00
Total Non-Current Liabilities
$
3,21,43,00,000.00
$
3,29,24,00,000.00
$
3,21,67,00,000.00
Total Current Liabilities $ $ $
Paraphrase This Document
Need a fresh take? Get an instant paraphrase of this document with our AI Paraphraser
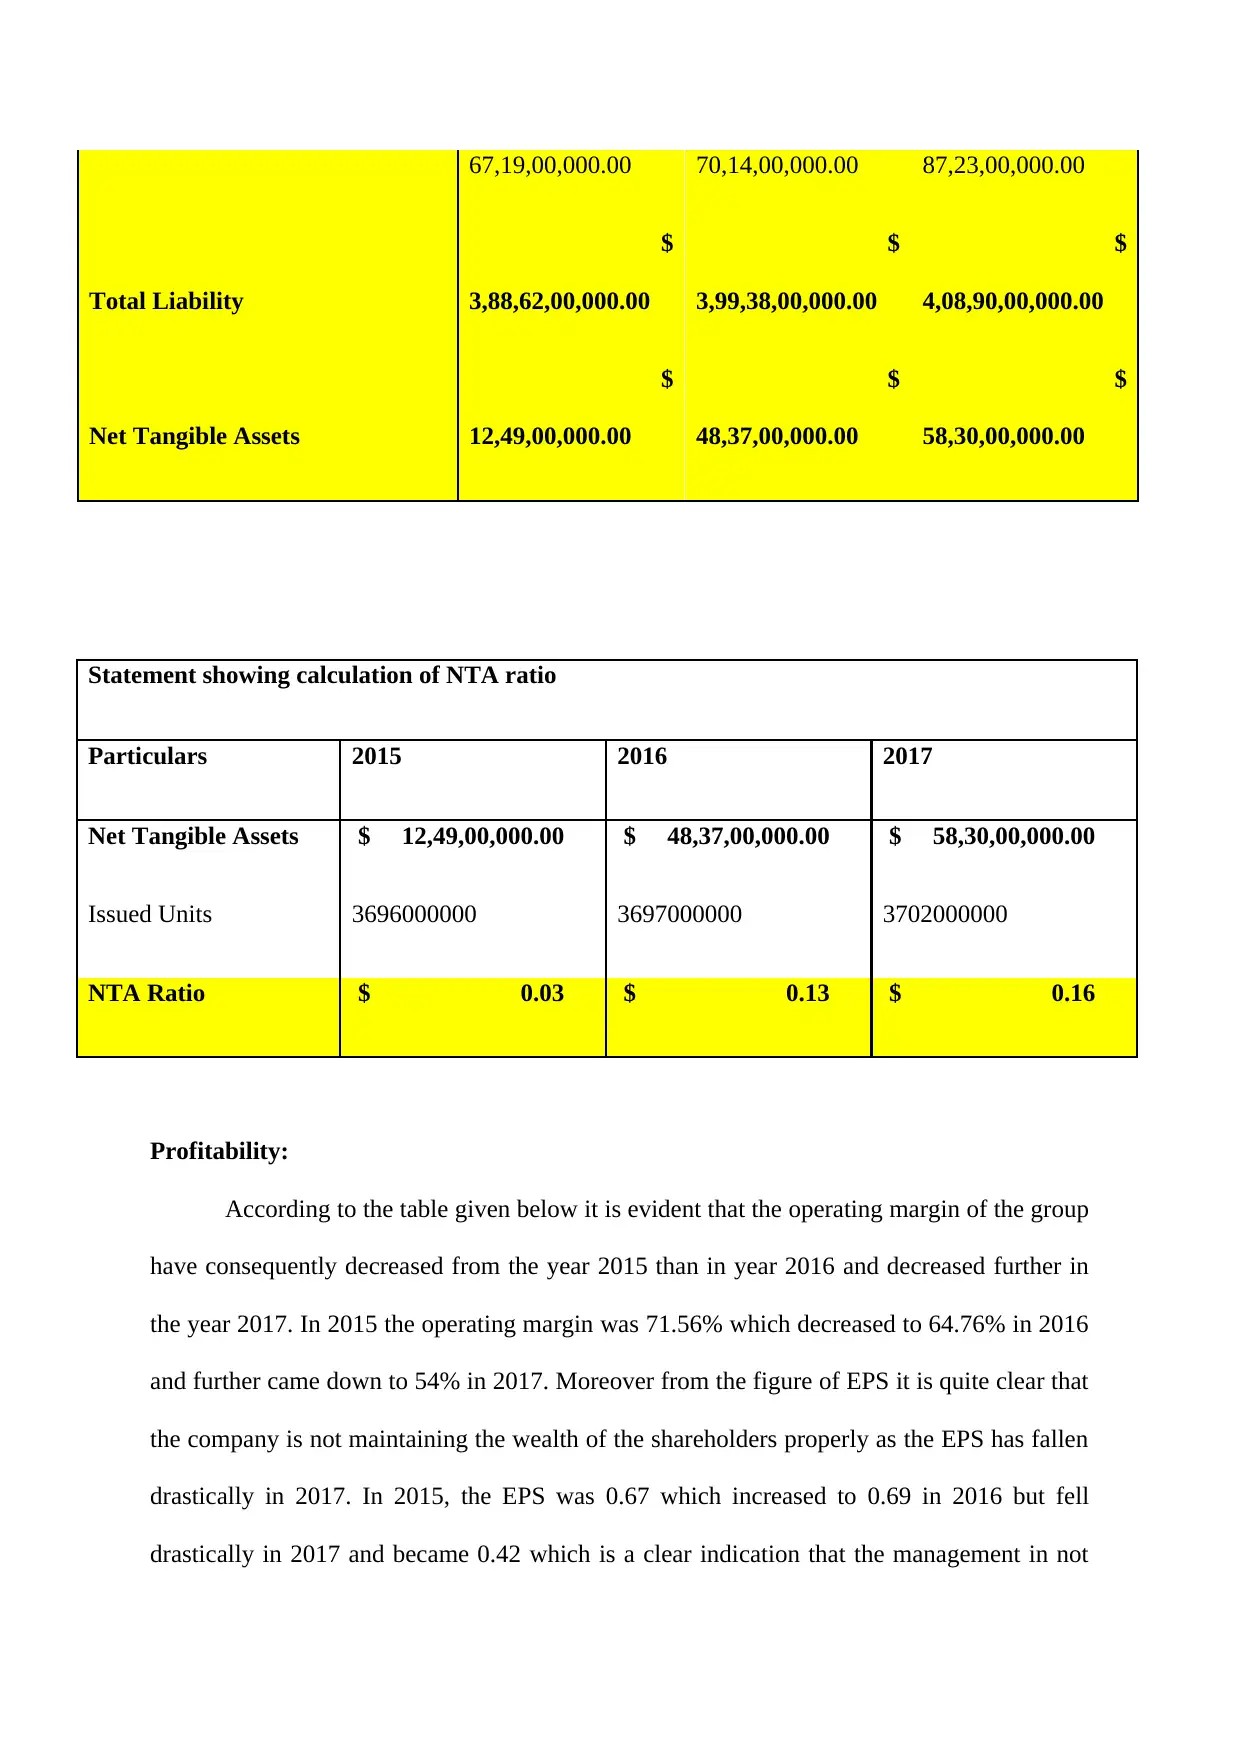
67,19,00,000.00 70,14,00,000.00 87,23,00,000.00
Total Liability
$
3,88,62,00,000.00
$
3,99,38,00,000.00
$
4,08,90,00,000.00
Net Tangible Assets
$
12,49,00,000.00
$
48,37,00,000.00
$
58,30,00,000.00
Statement showing calculation of NTA ratio
Particulars 2015 2016 2017
Net Tangible Assets $ 12,49,00,000.00 $ 48,37,00,000.00 $ 58,30,00,000.00
Issued Units 3696000000 3697000000 3702000000
NTA Ratio $ 0.03 $ 0.13 $ 0.16
Profitability:
According to the table given below it is evident that the operating margin of the group
have consequently decreased from the year 2015 than in year 2016 and decreased further in
the year 2017. In 2015 the operating margin was 71.56% which decreased to 64.76% in 2016
and further came down to 54% in 2017. Moreover from the figure of EPS it is quite clear that
the company is not maintaining the wealth of the shareholders properly as the EPS has fallen
drastically in 2017. In 2015, the EPS was 0.67 which increased to 0.69 in 2016 but fell
drastically in 2017 and became 0.42 which is a clear indication that the management in not
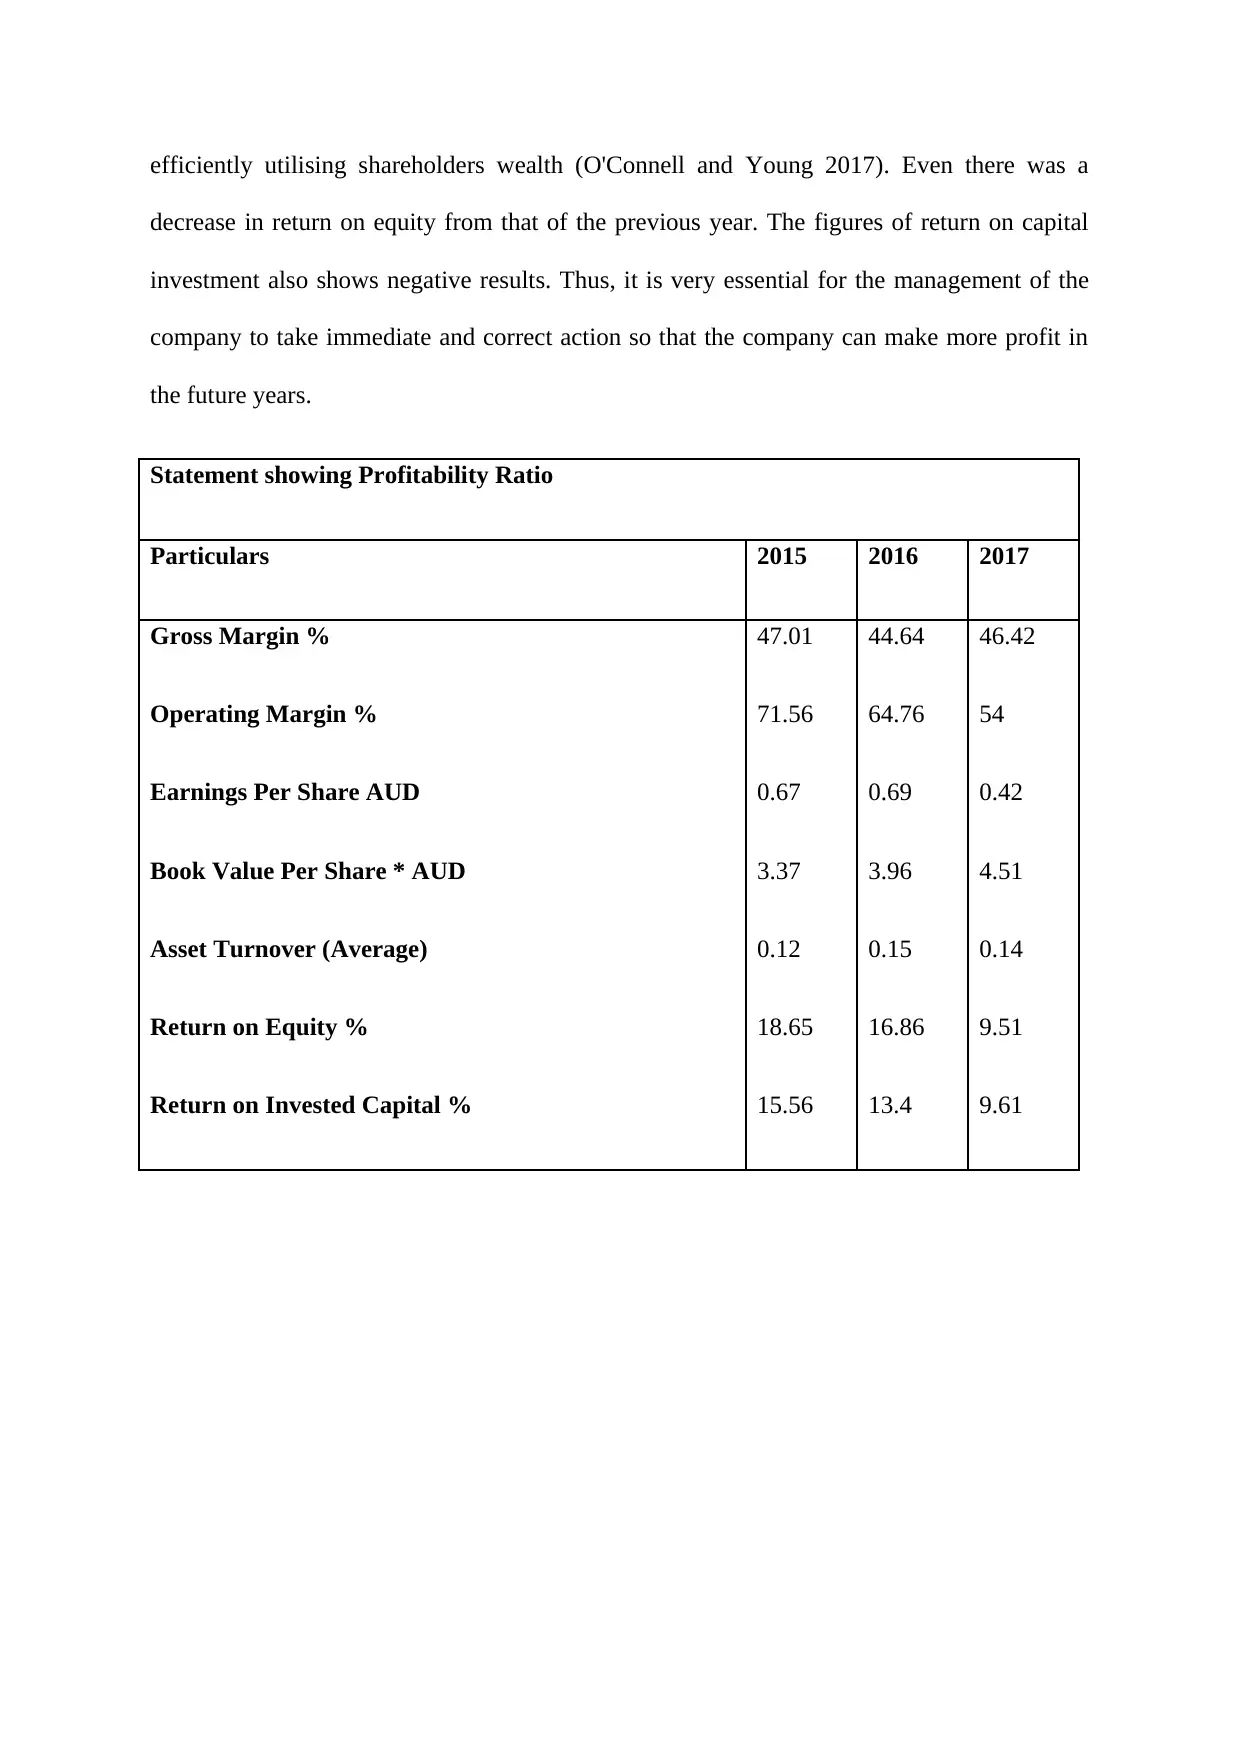
efficiently utilising shareholders wealth (O'Connell and Young 2017). Even there was a
decrease in return on equity from that of the previous year. The figures of return on capital
investment also shows negative results. Thus, it is very essential for the management of the
company to take immediate and correct action so that the company can make more profit in
the future years.
Statement showing Profitability Ratio
Particulars 2015 2016 2017
Gross Margin % 47.01 44.64 46.42
Operating Margin % 71.56 64.76 54
Earnings Per Share AUD 0.67 0.69 0.42
Book Value Per Share * AUD 3.37 3.96 4.51
Asset Turnover (Average) 0.12 0.15 0.14
Return on Equity % 18.65 16.86 9.51
Return on Invested Capital % 15.56 13.4 9.61
⊘ This is a preview!⊘
Do you want full access?
Subscribe today to unlock all pages.
Trusted by 1+ million students worldwide
MIRVAC Group
Business summary:
MIRVAC Group is a real estate investment trust (REIT) that as per the recent analysis
done by several organizations has stated that this is a sophisticated real estate investment,
improvement and investment administration group. This is one of the best and diversified
group that is engaged in the business if property of Australia. This group has its own
integrated asset administration capacity and expansion. This is traded in the name of ASX:
MGR as this is public form company. This is listed in Australian Stock Exchange (ASX) with
works in the sector of property development and investment field, as well as in the services
found in retail form (Dimovski 2016). This has its headquarters in Sydney in Australia as this
was established on 1972. This is one of the top groups in real estate business that has an
experience is more than forty years in this sector of business. MIRVAC group has a stapled
security system that composed of MIRVAC Limited and MIRVAC Property Trust (MPT).
The MIRVAC Limited composed of vital two sectors like development (MGR) and
investment (MPT) that involves both commercial and residential enhancements. MIRVAC
group functions in almost all over the region of Australia with the few overseas investments.
The improvement of the field of MIRVAC group (MGR) is composed of housing
Paraphrase This Document
Need a fresh take? Get an instant paraphrase of this document with our AI Paraphraser
merchandises. The main businesses that this group operate are on retail property, property
and investments.
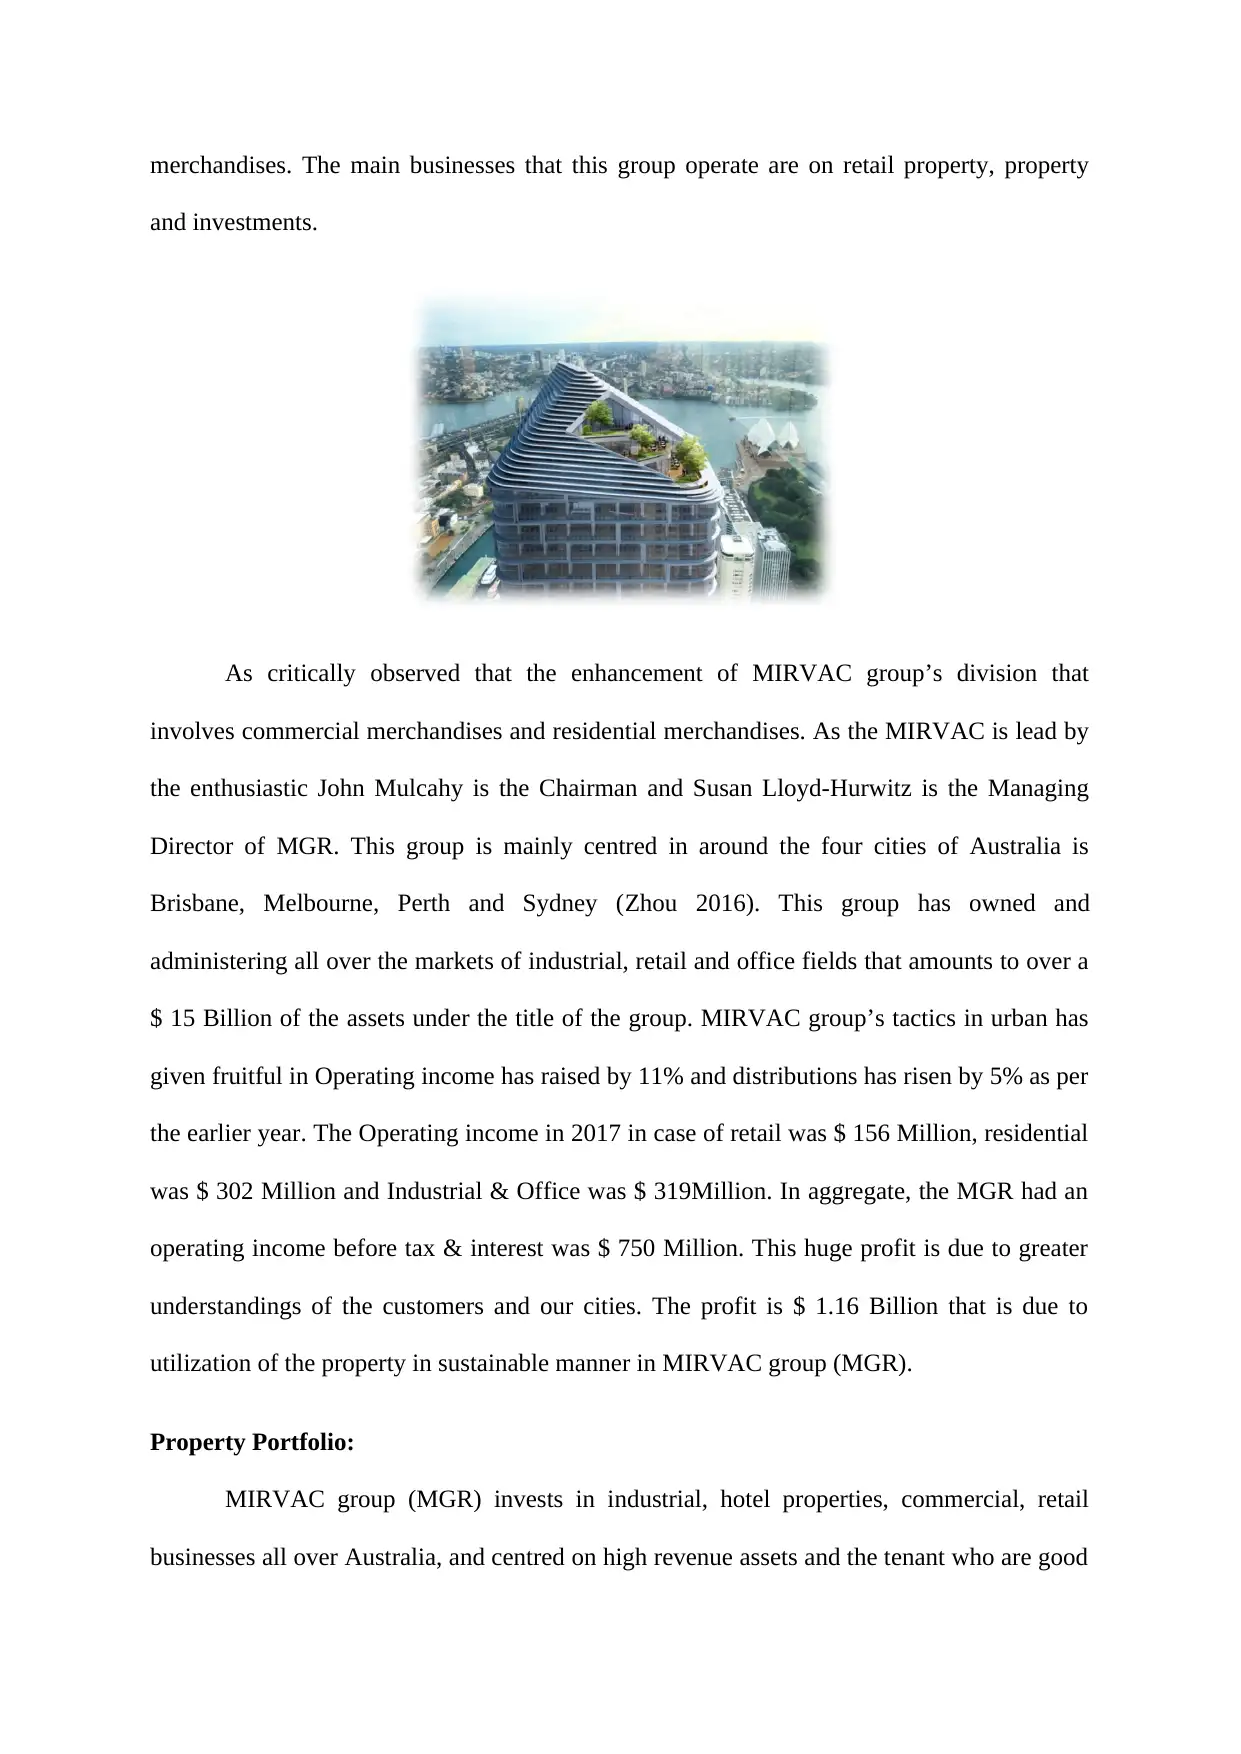
As critically observed that the enhancement of MIRVAC group’s division that
involves commercial merchandises and residential merchandises. As the MIRVAC is lead by
the enthusiastic John Mulcahy is the Chairman and Susan Lloyd-Hurwitz is the Managing
Director of MGR. This group is mainly centred in around the four cities of Australia is
Brisbane, Melbourne, Perth and Sydney (Zhou 2016). This group has owned and
administering all over the markets of industrial, retail and office fields that amounts to over a
$ 15 Billion of the assets under the title of the group. MIRVAC group’s tactics in urban has
given fruitful in Operating income has raised by 11% and distributions has risen by 5% as per
the earlier year. The Operating income in 2017 in case of retail was $ 156 Million, residential
was $ 302 Million and Industrial & Office was $ 319Million. In aggregate, the MGR had an
operating income before tax & interest was $ 750 Million. This huge profit is due to greater
understandings of the customers and our cities. The profit is $ 1.16 Billion that is due to
utilization of the property in sustainable manner in MIRVAC group (MGR).
Property Portfolio:
MIRVAC group (MGR) invests in industrial, hotel properties, commercial, retail
businesses all over Australia, and centred on high revenue assets and the tenant who are good
and investments.
As critically observed that the enhancement of MIRVAC group’s division that
involves commercial merchandises and residential merchandises. As the MIRVAC is lead by
the enthusiastic John Mulcahy is the Chairman and Susan Lloyd-Hurwitz is the Managing
Director of MGR. This group is mainly centred in around the four cities of Australia is
Brisbane, Melbourne, Perth and Sydney (Zhou 2016). This group has owned and
administering all over the markets of industrial, retail and office fields that amounts to over a
$ 15 Billion of the assets under the title of the group. MIRVAC group’s tactics in urban has
given fruitful in Operating income has raised by 11% and distributions has risen by 5% as per
the earlier year. The Operating income in 2017 in case of retail was $ 156 Million, residential
was $ 302 Million and Industrial & Office was $ 319Million. In aggregate, the MGR had an
operating income before tax & interest was $ 750 Million. This huge profit is due to greater
understandings of the customers and our cities. The profit is $ 1.16 Billion that is due to
utilization of the property in sustainable manner in MIRVAC group (MGR).
Property Portfolio:
MIRVAC group (MGR) invests in industrial, hotel properties, commercial, retail
businesses all over Australia, and centred on high revenue assets and the tenant who are good
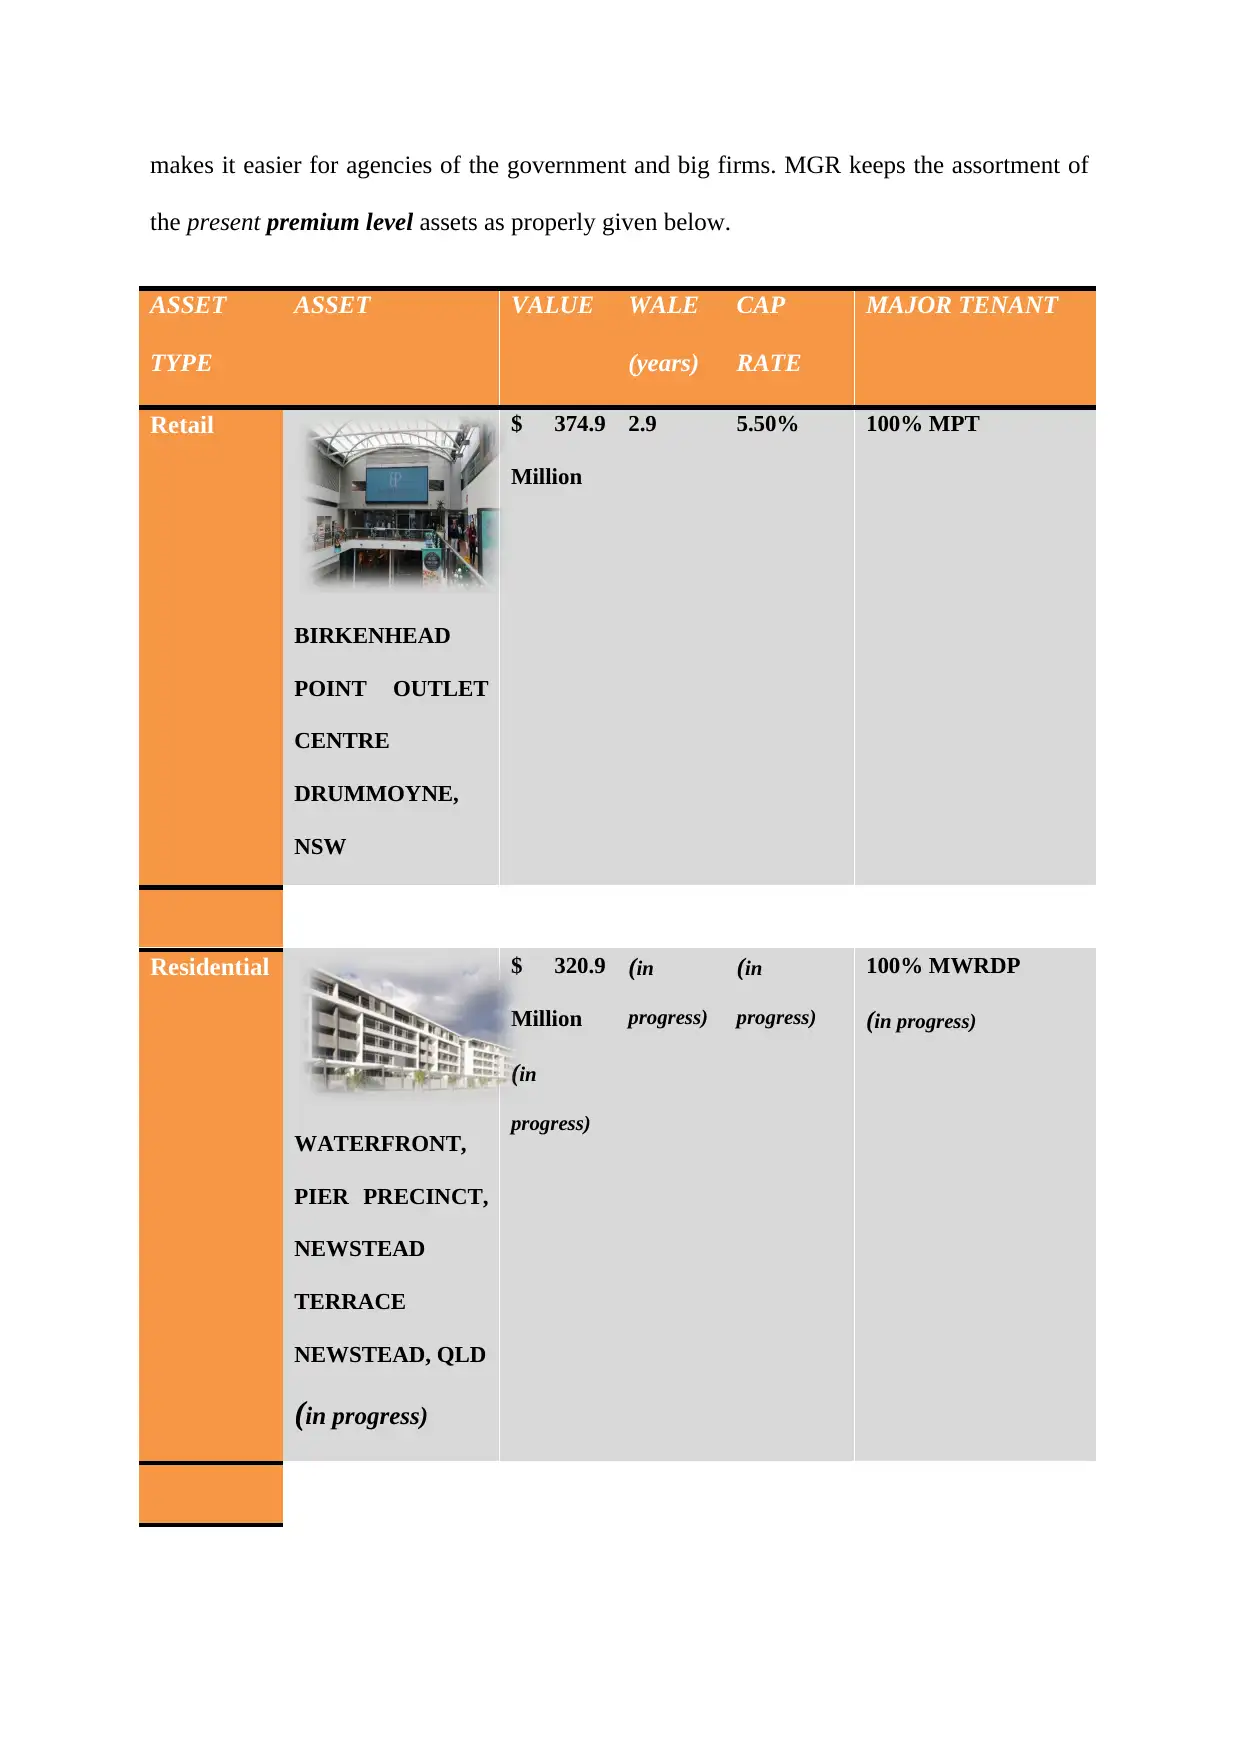
makes it easier for agencies of the government and big firms. MGR keeps the assortment of
the present premium level assets as properly given below.
ASSET
TYPE
ASSET VALUE WALE
(years)
CAP
RATE
MAJOR TENANT
Retail
BIRKENHEAD
POINT OUTLET
CENTRE
DRUMMOYNE,
NSW
$ 374.9
Million
2.9 5.50% 100% MPT
Residential
WATERFRONT,
PIER PRECINCT,
NEWSTEAD
TERRACE
NEWSTEAD, QLD
(in progress)
$ 320.9
Million
(in
progress)
(in
progress)
(in
progress)
100% MWRDP
(in progress)
⊘ This is a preview!⊘
Do you want full access?
Subscribe today to unlock all pages.
Trusted by 1+ million students worldwide
1 out of 24
Related Documents


Your All-in-One AI-Powered Toolkit for Academic Success.
+13062052269
info@desklib.com
Available 24*7 on WhatsApp / Email
![[object Object]](/_next/static/media/star-bottom.7253800d.svg)
Unlock your academic potential
Copyright © 2020–2026 A2Z Services. All Rights Reserved. Developed and managed by ZUCOL.