Financial Performance Analysis of The Reject Shop: 2016-2017

Verified

Added on  2023/06/10

|6
|2126
|212
Report
AI Summary
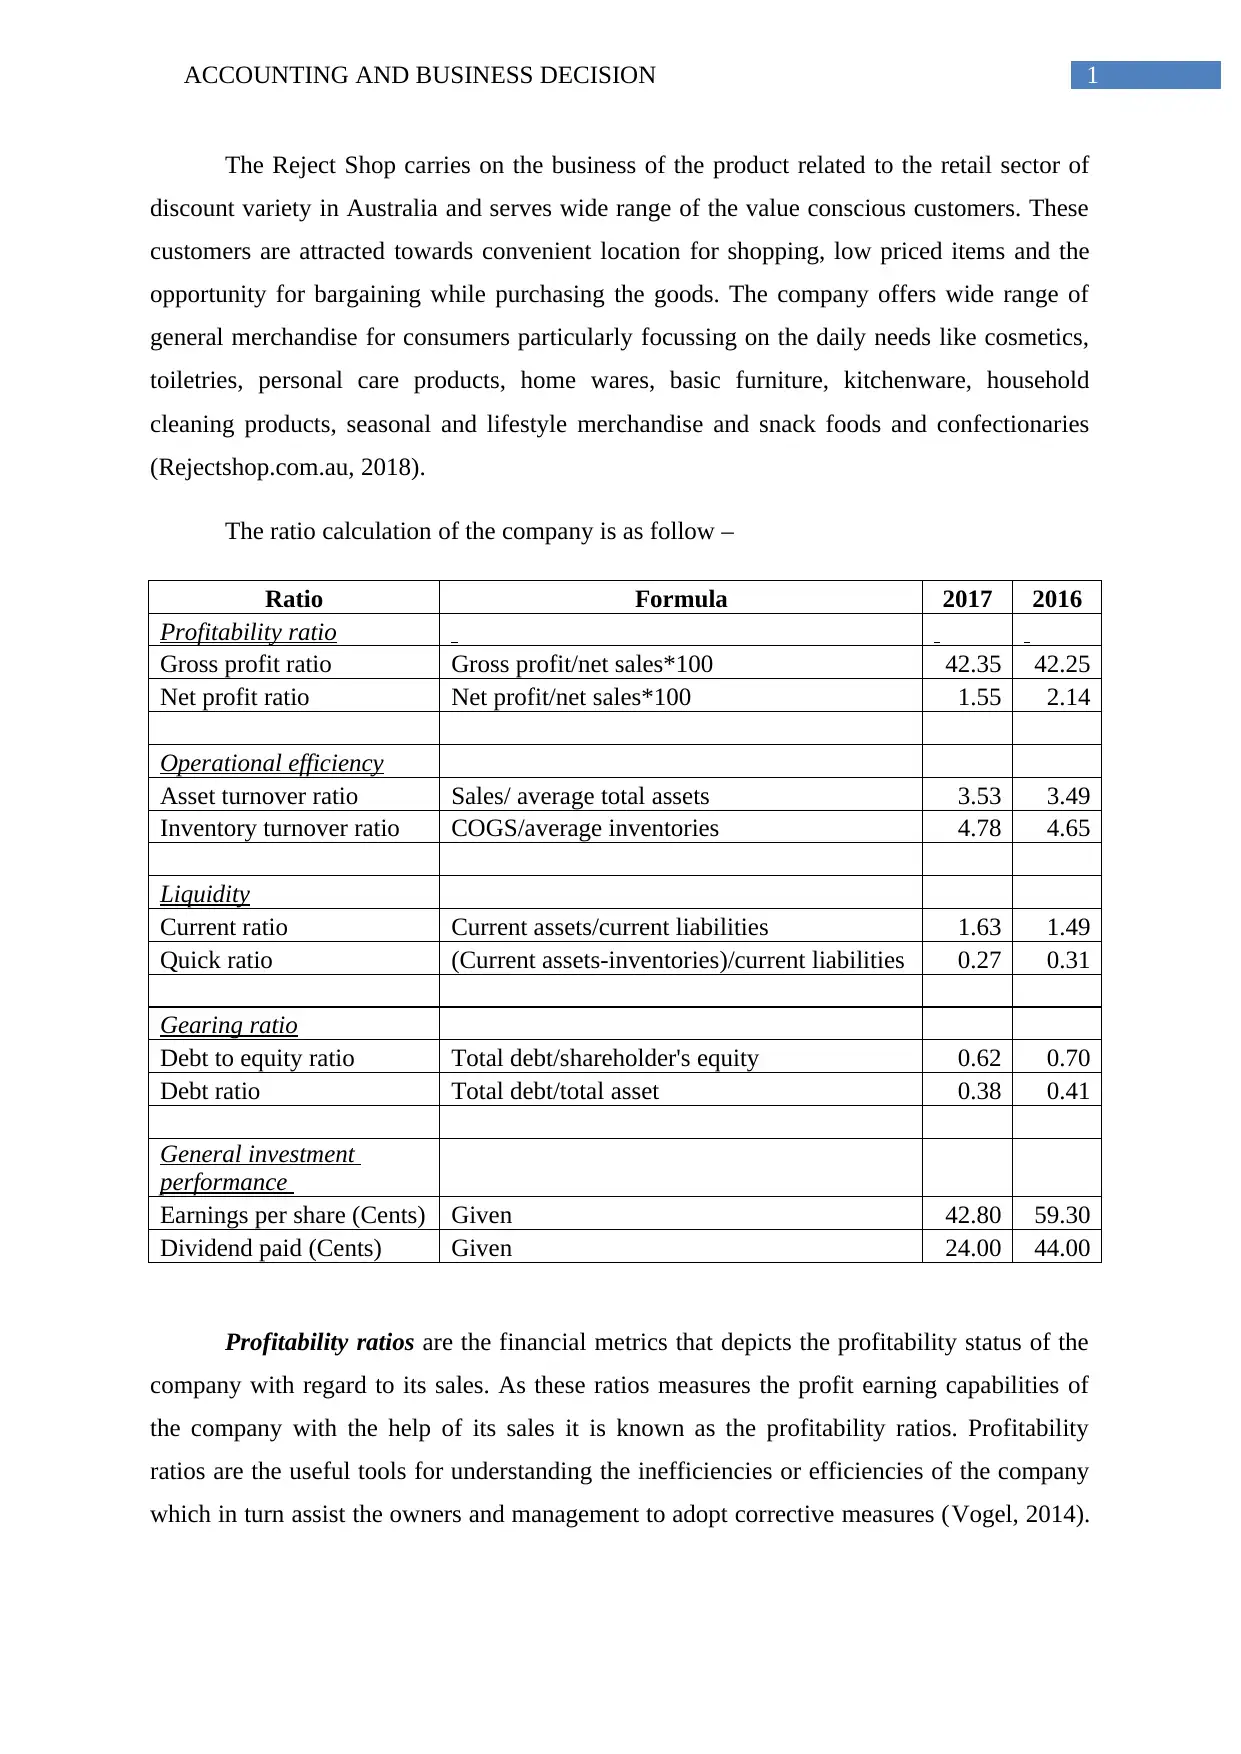
This report presents a financial analysis of The Reject Shop, a discount retail chain in Australia, based on its financial statements from 2016 and 2017. The analysis focuses on key financial ratios to assess the company's performance across various aspects, including profitability (gross profit margin, net profit margin), operational efficiency (asset turnover, inventory turnover), liquidity (current ratio, quick ratio), gearing (debt to equity, debt ratio), and general investment performance (earnings per share, dividends). The report calculates and interprets these ratios, highlighting trends and comparing the company's performance over the two-year period. The analysis reveals insights into The Reject Shop's strengths and weaknesses, such as its consistent gross profit margin but a decline in net profit margin, and improvements in operational efficiency and gearing ratios. The report concludes with an overall assessment of the company's financial health and suggests areas for improvement, such as controlling expenses to boost net profit and improve shareholder returns.
Document Page
Running head: ACCOUNTING AND BUSINESS DECISION
Accounting and business decision
Name of the student
Name of the university
Student ID
Author note
tabler-icon-diamond-filled.svg

Paraphrase This Document

Need a fresh take? Get an instant paraphrase of this document with our AI Paraphraser
Document Page
1ACCOUNTING AND BUSINESS DECISION
The Reject Shop carries on the business of the product related to the retail sector of
discount variety in Australia and serves wide range of the value conscious customers. These
customers are attracted towards convenient location for shopping, low priced items and the
opportunity for bargaining while purchasing the goods. The company offers wide range of
general merchandise for consumers particularly focussing on the daily needs like cosmetics,
toiletries, personal care products, home wares, basic furniture, kitchenware, household
cleaning products, seasonal and lifestyle merchandise and snack foods and confectionaries
(Rejectshop.com.au, 2018).
The ratio calculation of the company is as follow –
Ratio Formula 2017 2016
Profitability ratio
Gross profit ratio Gross profit/net sales*100 42.35 42.25
Net profit ratio Net profit/net sales*100 1.55 2.14
Operational efficiency
Asset turnover ratio Sales/ average total assets 3.53 3.49
Inventory turnover ratio COGS/average inventories 4.78 4.65
Liquidity
Current ratio Current assets/current liabilities 1.63 1.49
Quick ratio (Current assets-inventories)/current liabilities 0.27 0.31
Gearing ratio
Debt to equity ratio Total debt/shareholder's equity 0.62 0.70
Debt ratio Total debt/total asset 0.38 0.41
General investment
performance
Earnings per share (Cents) Given 42.80 59.30
Dividend paid (Cents) Given 24.00 44.00
Profitability ratios are the financial metrics that depicts the profitability status of the
company with regard to its sales. As these ratios measures the profit earning capabilities of
the company with the help of its sales it is known as the profitability ratios. Profitability
ratios are the useful tools for understanding the inefficiencies or efficiencies of the company
which in turn assist the owners and management to adopt corrective measures (Vogel, 2014).
Document Page
2ACCOUNTING AND BUSINESS DECISION
The investors and financial analysts compute these ratios to analyse the profit earning
capabilities of the entity.
Gross profit margin is the ratio that is used for analysing how much cost is incurred
for manufacturing of the product and and the amount left from the sales revenue after the
payment of manufacturing cost. It assists in evaluating the company’s efficiency and the way
in which the resources of the company are used to manufacture the product and generating
profit through passing the costs that is incurred for the product (Babalola & Abiola, 2013).
Looking into the gross profit margin of the company for the year ended 2016 and 2017 it can
be identified that the gross profit margin of the company has been increased from 42.25% to
42.35% over the years. Therefore, the company is maintaining its profitability at same level
over the past 2 years.
Net profit ratio is the most used profitability ratio for evaluating the company’s
profitability position. Net profit is the remained amount after deducting all the losses,
expenses, bad debts and provisions. It measures the capability of the company to earn out of
every dollar spend on the business operation (Nan & Wen, 2014). For instance, if the net
profit is 5% it states that on each dollar of investment the company is earning 5 cents.
Looking into the net profit margin of the company for the year ended 2016 and 2017 it can be
identified that the net profit margin of the company has been reduced from 2.14% to 1.55%
over the years. Therefore, the company’s profit earning capability has been reduced over the
past 2 years (Kahneman & Tversky, 2013).
One of the most useful and popular financial ratios is the operational efficiency ratios
as it concentrates on the core activities of the business of the company. It is also used to
evaluate the ability of the company to use its liabilities and assets. Further, these ratios are
used for analyzing and tracking the performance of the company to assess the efficiencies
with regard to the assets and inventories (Morellec, Nikolov & Zucchi, 2014).
Asset turnover ratio is used to measure the revenue or sales of the company that is
generated with regard to the assets value. It can be used as the indicator of efficiency with
which the company can deploy the assets for generating the revenues. If the company can
generate more amounts of sales with lower amount of assets it will have higher turnover ratio
that states that the company is good as it is deploying its assets efficiently (Pervan & Kuvek,
2013). On the contrary the lower ratio states that the company is able to deploy its assets
optimally. Looking into the asset turnover ratio of the company for the year ended 2016 and
Document Page
3ACCOUNTING AND BUSINESS DECISION
2017 it can be identified that the asset turnover ratio of the company has been increased from
3.49 to 3.53 over the years.
Inventory turnover ratio is used to measure the efficiency of the company with regard
to the time taken by the company to sell or replace the inventories of the company. Low
turnover states that the company has lower sales and excess level of inventories. On the
contrary, the higher ratio states that the company is efficient in generating sales. Looking into
the inventory turnover ratio of the company for the year ended 2016 and 2017 it can be
identified that the inventory turnover ratio of the company has been increased from 4.65 to
4.78 over the years. Therefore, both the efficiency ratios of the company are stating that the
company has improved its efficiency over the last 2 years (Chen, Cheng & Lo, 2013).
Liquidity ratio of the company states the ability of the company to pay off its short
term obligation with the available short term assets of the company. The term liquidity states
the company’s ability to meet the short term financial obligation after they become due.
Current ratio as well as quick ratio both the liquidity ratio measures the company’s ability to
pay off the short term liabilities. The major difference between the 2 is that the quick ratio
does not take into consideration the current asset those take considerable time to convert into
cash like inventories. The liquidity ratio of 1 or more than that states that the company’s
liquidity position is good and it is efficient in meeting its short term obligations (Brigham et
al., 2016) Looking into the liquidity ratio of the company for the year ended 2016 and 2017 it
can be identified that the current ratio of the company has been increased from 1.49 to 1.63
over the years. However, the quick ratio has been reduced from 0.31 to 0.27.
Gearing ratio is the fundamental analysis of the long term debt of the company as
compared to the capital employed. It compares the level of debt of the company as compared
to its equity. The debt to equity ratio of the company reveals the liabilities of the company as
compared to the equity. Generally, the ratio of 40% or 0.4 is considered healthy for the
company. Through the debt to equity ratio of the company for the year 2016 was 0.70 the
company was able to improve the position and reduced the ratio to 0.60 in 2017. Further, the
debt ratio states the proportion of asset obtained through borrowing and the proportion
obtained through equity (Delen, Kuzey & Uyar, 2013). For both the years the debt ratio of the
company stating that higher proportion of the asset is obtained through equities as compared
to debt.
tabler-icon-diamond-filled.svg

Paraphrase This Document

Need a fresh take? Get an instant paraphrase of this document with our AI Paraphraser
Document Page
4ACCOUNTING AND BUSINESS DECISION
General investment performance ratios are used for measuring the performance of
the company with regard to the ability of the company to provide returns to the investors and
stakeholders. The earnings per share indicate the ability of the company to generate the net
profits for the common stakeholders. Looking into the earning per share of the company for
the year ended 2016 and 2017 it can be identified that the EPS of the company has been
reduced from 59.30 cents to 42.80 cents over the years. Further, looking into the dividend
payment by the company for the year ended 2016 was 44.00 cents and for the year ended
2017 it was 24.00 cents (Omar et al., 2014). Therefore, even if the return provided to
shareholders has been reduced over the past 2 years, the company is regular in providing
return to its shareholders through dividend and through generating profit for them.
From the above analysis it can be concluded that the financial performance of The
Reject Shop over the last 2 years that is 2016 and 2017 is good with regard to its profits,
operational efficiency, liquidity and leverage position. It has been found that the company has
improved its profitability position as the net profit as well as gross profit of the company
increased in 2017 as compared to 2016. Further, the efficiency ratios and gearing ratios have
been improved in 2017 as compared to 2016. However, as the EPS and dividend per share of
the company has been reduced in 2017 as compared to 2016 the company shall take
corrective actions to minimize the expenses wherever possible which in turn will improve the
net profit of the company. It will further improve the EPS and dividend payment of the
company.
Document Page
5ACCOUNTING AND BUSINESS DECISION
Reference
Babalola, Y. A., & Abiola, F. R. (2013). Financial ratio analysis of firms: A tool for decision
making. International journal of management sciences, 1(4), 132-137.
Brigham, E. F., Ehrhardt, M. C., Nason, R. R., & Gessaroli, J. (2016). Financial Managment:
Theory And Practice, Canadian Edition. Nelson Education.
Chen, X., Cheng, Q., & Lo, A. K. (2013). Accounting restatements and external financing
choices. Contemporary Accounting Research, 30(2), 750-779.
Delen, D., Kuzey, C., & Uyar, A. (2013). Measuring firm performance using financial ratios:
A decision tree approach. Expert Systems with Applications, 40(10), 3970-3983.
Kahneman, D., & Tversky, A. (2013). Prospect theory: An analysis of decision under risk.
In Handbook of the fundamentals of financial decision making: Part I (pp. 99-127).
Morellec, E., Nikolov, B., & Zucchi, F. (2014). Competition, cash holdings, and financing
decisions.
Nan, L., & Wen, X. (2014). Financing and investment efficiency, information quality, and
accounting biases. Management Science, 60(9), 2308-2323.
Omar, N., Koya, R. K., Sanusi, Z. M., & Shafie, N. A. (2014). Financial statement fraud: A
case examination using Beneish Model and ratio analysis. International Journal of
Trade, Economics and Finance, 5(2), 184.
Pervan, I., & Kuvek, T. (2013). The relative importance of financial ratios and nonfinancial
variables in predicting of insolvency. Croatian Operational research review, 4(1),
187-197.
Rejectshop.com.au. (2018). Company Information | The Reject Shop. [online] Available at:
https://www.rejectshop.com.au/aboutus/companyinformation [Accessed 8 Jun. 2018].
Uechi, L., Akutsu, T., Stanley, H. E., Marcus, A. J., & Kenett, D. Y. (2015). Sector
dominance ratio analysis of financial markets. Physica A: Statistical Mechanics and
its Applications, 421, 488-509.
Vogel, H. L. (2014). Entertainment industry economics: A guide for financial analysis.
Cambridge University Press.
chevron_up_icon
1 out of 6
circle_padding
hide_on_mobile
zoom_out_icon
[object Object]