Business Analytics and Financial Performance: The Reject Shop Analysis
VerifiedAdded on 2023/06/11
|17
|3594
|325
Report
AI Summary
This report provides a comprehensive financial analysis of The Reject Shop Company, examining its business analytics practices and overall financial performance. It delves into various financial ratios, including current ratio, quick ratio, profitability ratios (net profit margin, return on equity, return on assets), solvency ratio (debt to equity), and efficiency ratios (creditor's turnover, inventory turnover). The analysis identifies key problems such as declining profitability and high financial leverage, and suggests improvements through ABC costing models and strategic project selection using capital asset pricing models. The report concludes with recommendations for enhancing business efficiency and investment value, emphasizing the importance of lowering the cost of capital and increasing overall turnover. The data is sourced from annual reports and financial websites, offering insights for investors and management alike. Desklib provides access to similar reports and study resources for students.
the reject SHOP COMPANY
Business analytics practices of the Reject Shop Company
Business Financial analysis
Name of the Author
University Name-
Business analytics practices of the Reject Shop Company
Business Financial analysis
Name of the Author
University Name-
Paraphrase This Document
Need a fresh take? Get an instant paraphrase of this document with our AI Paraphraser
Table of Contents
Executive Summary.....................................................................................................................................2
Introduction.................................................................................................................................................2
The Reject Shop Company.......................................................................................................................2
Mission................................................................................................................................................2
Vision...................................................................................................................................................2
Identify the problem....................................................................................................................................3
Literature review.........................................................................................................................................4
Data collection.............................................................................................................................................6
Current ratio................................................................................................................................................7
Quick ratio...........................................................................................................................................7
Profitability ratio......................................................................................................................................7
Net profit margin.................................................................................................................................7
Return on equity..................................................................................................................................8
Return on assets-.................................................................................................................................8
Solvency ratio......................................................................................................................................8
Debt to equity......................................................................................................................................8
Efficiency ratio.........................................................................................................................................8
Creditor’s turnover ratio......................................................................................................................9
Inventory Turnover ratio.....................................................................................................................9
Market ratio (General investment proposal analysis).............................................................................9
Summary...................................................................................................................................................10
References.................................................................................................................................................12
Appendix...................................................................................................................................................14
Executive Summary
` In this report, problem analysis and research on the financial analysis of the Company has
been analyzed. With the changes in business and ramified economic condition, each and every
company is using the proper financial analysis tools and models to evaluate their future and
current financial business practice.
Introduction
In this report, The Reject Shop Company has been taken to evaluate whether the business
undertaken will add value to the effective business functioning or not. This report will reflect the
present and proposed busienss practices which will be undertaken by the Reject Shop Company.
The Reject Shop Company
This is an Australian discount stores accompanied with the various goods offered and
incorporated in 198. This company is running its business on international level. Company is
having 340 stores Australia-wide stores to sell its goods and services around the globe.
Mission
The main mission of company is to enhance its market share in Australian by providing the best
quality of goods and services.
Vision
The Vision of Company is to add value to the satisfaction level of clients by creating core
competency in the product differentiation and cost leadership strategy.
It is Australian discount variety stores chain which was incorporated in 1981 and operates its
busienss on international level.
This company is listed on the Australia Stock exchange and having around 149 billion market
capitalization which is 20% higher as compared to last year data.
⊘ This is a preview!⊘
Do you want full access?
Subscribe today to unlock all pages.
Trusted by 1+ million students worldwide
Benefit of analysis
This analysis will be useful for the key managerial persons of the Reject Shop and investors who
want to manage the Reject shop Company. Investors could also use this report to determine the
investment decisions to create value on the investment. Investors could use financial analysis
tools and model shown in this report to evaluate the financial performance of company to make
investment.
Identify the problem
The main problem in this analysis is to identify whether the financial business performance of
company and how well company has created value on its investment. All the data have been
collected from the annual report and yahoo finance. The main assumption is that the future
performance of company will be based on the last year data. There are several investors who
have faced the issue in determining the decision to invest capital in particular company. The
investment decision could be secured when investors make their investment decisions on the
basis of past financial performance of Company. Investors need to analysis whether investing in
particular company would add value to their investment capital or not. The main problem arises
when investors have zero knowledge about the finance and find issues to determine whether they
should invest their capital in particular company or not. It increases the complexity of the
investment decisions to determine whether the investment decisions should be made or not in the
particular company.
The main aim or focus area of this research is to evaluate the financial performance of the Reject
Shop Company. This financial analysis of company is required to determine the existing and
future financial performance of company. It will assist investors to take their financial
investment decisions.
In addition to this, another issue arises related to the complexity of the business which company
would face in the business due to failure of the busienss operations. The matrix operation project
could be undertaken by company to implement the strategic business decisions.
Paraphrase This Document
Need a fresh take? Get an instant paraphrase of this document with our AI Paraphraser
Literature review
With the changes in the economic changes and complex busienss structure, there are several
financial analysis tools and models which are used to evaluate the financial performance of
company. The ratio analysis, du point analysis, top down analysis, bottom up analysis and capital
budgeting tools have been taken into consideration. Ratio analysis is used to establish the
relation between the two financial factors of the business. This ratio is used to determine whether
the existing financial performance of company by using the liquidity ratio, debt to capital ratio,
efficiency ratio, profitability ratio and market ratio. As stated by Delen, Kuzey, and Uyar, 2013 it
is reflected that these all ratios assist in evaluating the financial performance of company and
determine the future trend of the business. The business models are also adjusted by evaluating
the financial performance of company. For instance, if company is having the particular project
which could be used in the business to create value on the investment then it will add value to the
business functioning. As per the views of Bahreini, and Adaoglu\ (2018) there are several
business models such as matrix business model, project management business models and top
down business model which could be used by the Reject Shop company to add value to its
business functioning. However, financial analysis of the reject Shop Company has been selected
as analysis topic to evaluate the current financial performance and predicting the future
performance of company. It is analyzed that the current status of company is showing the good
amount of growth in its business since last five year. The liquidity position, debt to capital ratio
and other parts of the company has been showing the positive results. Company has increased its
return on earning but the return on equity of company has decreased to 8.89% in 2017 which is 4
% lower as compared to last year data (The Reject Shop, 2016). The return on assets of company
has also increased to 5.47% which is 1.1% higher since last one year. The solvency ratio of
company also reflects the company’s ability to manage its debt funding in its business. It is
analyzed that company has higher debt portion in its business which may result to increased
financial leverage if company lower down its profitability. The efficiency ratio of company also
reflects how well company has managed its capital in its business to create value on the
investment. As stated by Edwards, (2014) it is considered that if company had lower down the
debtor turnover ratio by 12% since last one year which would lower down the cost of capital of
business. Inventory turnover ratio of company has also increased by 20% as compared to last
five year data. It divulges that company could lower down the cost of business by reducing the
inventory blockage in its business. This analysis reflects that company has been facing high
decrease in its profitability earning capacity since last three years. It has been observed that
company should focuses on increasing the overall turnover. As compared to last year data,
company needs to strengthen its business performance and efficiency of the business. It is
analyzed that as current business practice of The Reject Shop has been reflecting the positive
amount of increment in the business output. However, high financial leverage may reduce
company’s long term sustainability. Nonetheless, the future performance of The Reject Shop is
based on the invested capital which would easily add value to the performance of company. It is
analyzed that company needs to undertake the future business performance. This increased
solvency ratio and lower profitability are required to be managed by company to increase the
overall efficiency of business.
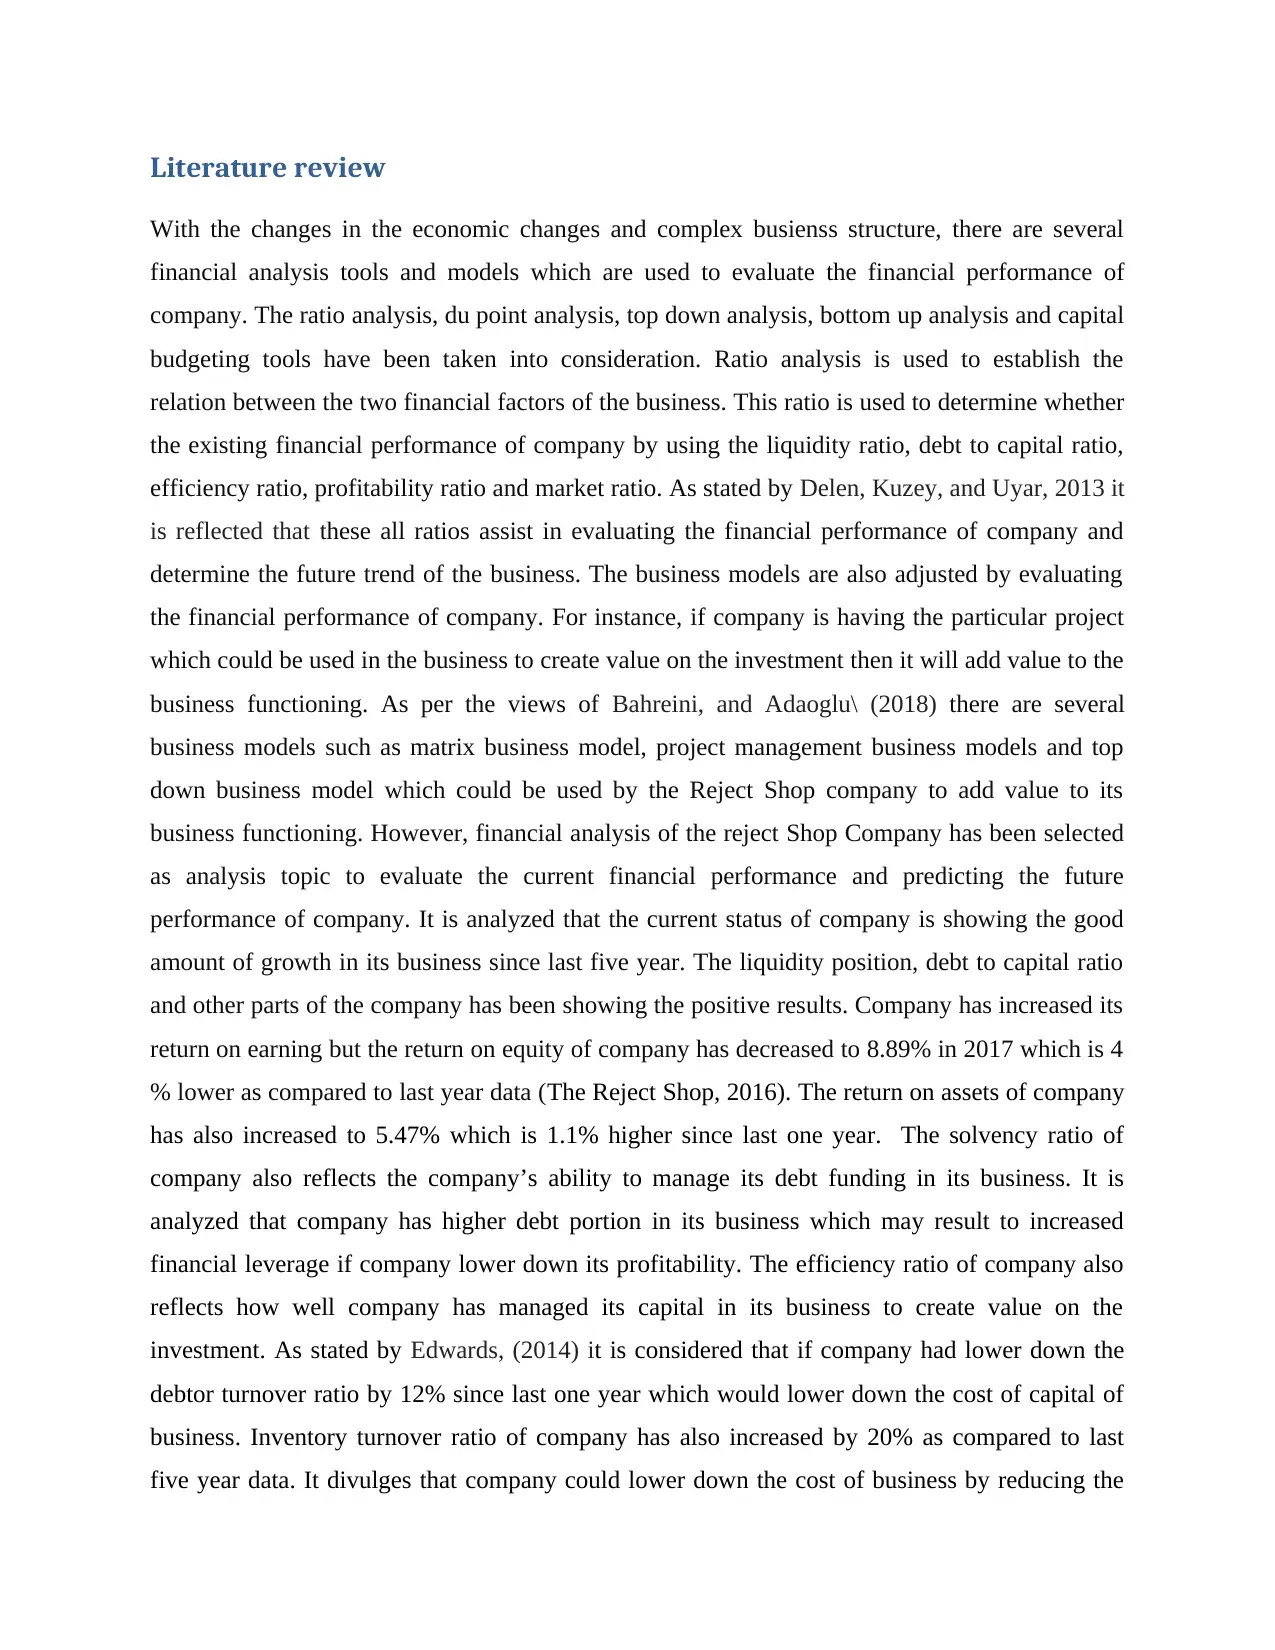
Business flow chart of The Reject Shop
decrease in its profitability earning capacity since last three years. It has been observed that
company should focuses on increasing the overall turnover. As compared to last year data,
company needs to strengthen its business performance and efficiency of the business. It is
analyzed that as current business practice of The Reject Shop has been reflecting the positive
amount of increment in the business output. However, high financial leverage may reduce
company’s long term sustainability. Nonetheless, the future performance of The Reject Shop is
based on the invested capital which would easily add value to the performance of company. It is
analyzed that company needs to undertake the future business performance. This increased
solvency ratio and lower profitability are required to be managed by company to increase the
overall efficiency of business.
Business flow chart of The Reject Shop
⊘ This is a preview!⊘
Do you want full access?
Subscribe today to unlock all pages.
Trusted by 1+ million students worldwide
ABC model could also be used by The Reject Shop to bifurcate costing of the business in the
different work department also add value to clients need and demand. As per the views of Box,
et al, 2015 it is divulged that it is analyzed that company needs to focuses on creating value on
the investment. However, the main source of increasing the current business practice output is
based on the using the ABC costing model and life costing methods in its value chain activities.
In addition to this, the future business performance could also be increased by undertaking more
profitable project in the business. The capital assets pricing model is used to determine which of
the project will offer higher benefits to organization. These projects will be assessed on the basis
of the net present value, pay-back period and other benefits program to company from the given
projects. The capital assets pricing model du Pont analysis assists in evaluating whether the
accepted project would create value of the investment made by the Reject Capital The net
present value is the amount of benefit which arise after deducting the cash outflow from the
available cash inflow of the business. As stated by Athanasopoulos, 2017, it is revealed that the
top down analysis could also be used to analysis the current business practice and financial
performance of company. It is analyzed that the Reject Shop Company has increased its
investment in its research and development department and also expanded its business by adding
more value to its business. As There are several other business models which could be used by
the manager and accountants to strengthen the business functioning. However, the Reject Shop
Company should adopt the matrix flow chart model in which key managerial persons will take
strategic decisions and operational decisions will be taken by the line managerial to increase the
value on the investment. Therefore, after analyzing all the details and financial information of
company, it could be inferred that company has good future outlook in its business which shows
that company could easily add value of its investment. It is considered that company should
increase the overall turnover if it wants to create value on the investment. Nonetheless, the main
focus of company should be to lower down the cost of capital to create value on the investment
(The Reject Shop, 2016).
Data collection
There are several methods and process system which could be used to collect the data from the
several sources. It is analyzed that annual report is used to evaluate the financial performance
Paraphrase This Document
Need a fresh take? Get an instant paraphrase of this document with our AI Paraphraser
and business practice of company (Box, et al. 2015). In addition to this, data regarding the
financial performance of company could also be collected by using the yahoo finance, morning
star and other online websites. After collecting data from various sources, following information
has been drawn from the various sources. These data collection methods provide the qualitative
and quantitative data which could be further used to increase the value of the business
(Athanasopoulos, 2017).
Current ratio
The Reject Shop company has decreased is current ratio to 1.49 in 2016 after that the same
increased to 1.63 points with the increase in the current assets (Grant, 2016).
Descriptio
n
Formula THE REJECT SHOP LTD (TRS) Cash Flow
Flag Ratio Analysis
2015` 2016 2017
Current
ratio
Current assets/current
liabilities 1.82 1.49 1.63
Quick
Ratio
Current assets-
Inventory/current
liabilities
0.35 0.31 0.26
Quick ratio
The quick ratio of company has gone down by .09 points which shows that company has
decreased its investment in its inventories (The Reject Shop, 2017).
Profitability ratio
Net profit margin
Company has decreased its net profit margin by .85 %. It shows that company has increased its
operating expenses (Edwards, 2014)
Descriptio
n
Formula THE REJECT SHOP LTD (TRS) Cash Flow
Flag Ratio Analysis
2015` 2016 2017
Net Profit
margin
Net profit/revenues 1.85% 2.13% 1.51%
Return on Net profit/Equity 10.37% 12.59% 8.89%
equity
Return on
assets
Net profit/ Total assets 6.14% 7.36% 5.48%
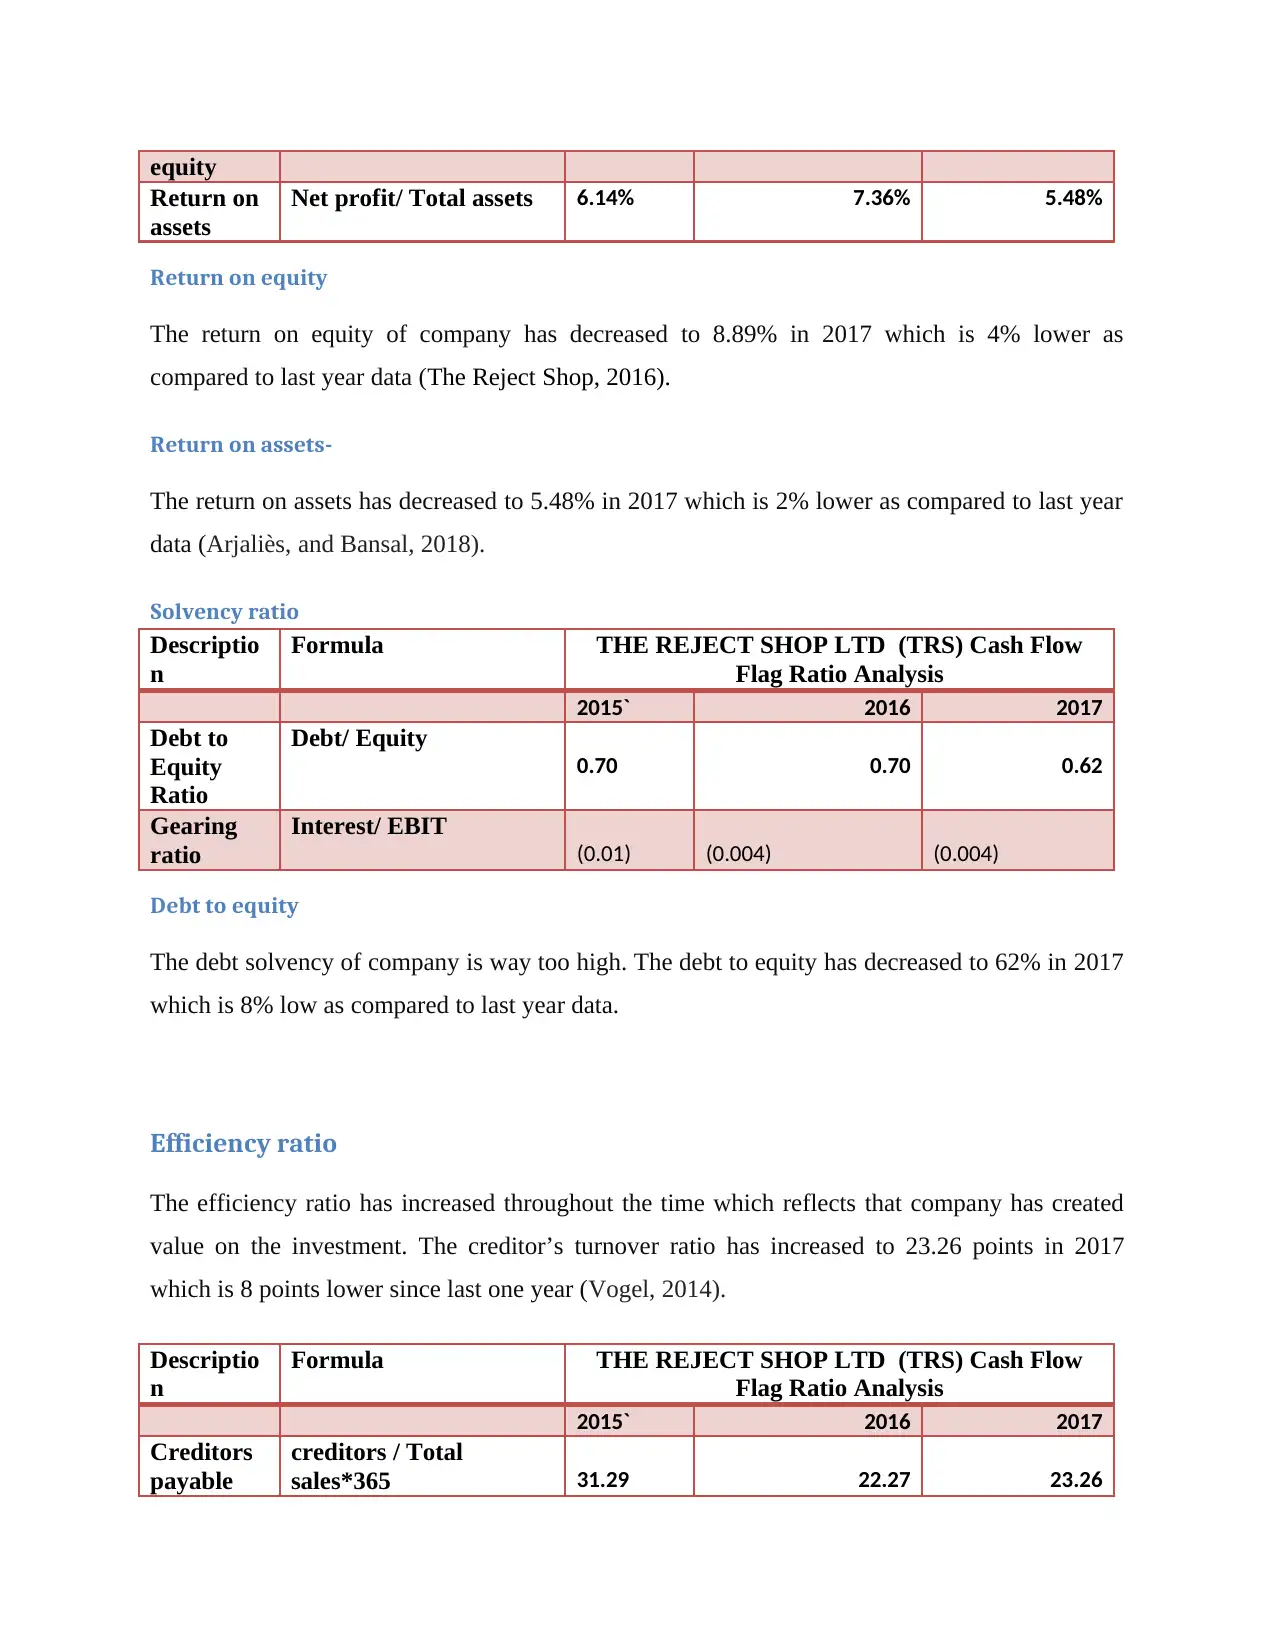
Return on equity
The return on equity of company has decreased to 8.89% in 2017 which is 4% lower as
compared to last year data (The Reject Shop, 2016).
Return on assets-
The return on assets has decreased to 5.48% in 2017 which is 2% lower as compared to last year
data (Arjaliès, and Bansal, 2018).
Solvency ratio
Descriptio
n
Formula THE REJECT SHOP LTD (TRS) Cash Flow
Flag Ratio Analysis
2015` 2016 2017
Debt to
Equity
Ratio
Debt/ Equity
0.70 0.70 0.62
Gearing
ratio
Interest/ EBIT
(0.01) (0.004) (0.004)
Debt to equity
The debt solvency of company is way too high. The debt to equity has decreased to 62% in 2017
which is 8% low as compared to last year data.
Efficiency ratio
The efficiency ratio has increased throughout the time which reflects that company has created
value on the investment. The creditor’s turnover ratio has increased to 23.26 points in 2017
which is 8 points lower since last one year (Vogel, 2014).
Descriptio
n
Formula THE REJECT SHOP LTD (TRS) Cash Flow
Flag Ratio Analysis
2015` 2016 2017
Creditors
payable
creditors / Total
sales*365 31.29 22.27 23.26
Return on
assets
Net profit/ Total assets 6.14% 7.36% 5.48%
Return on equity
The return on equity of company has decreased to 8.89% in 2017 which is 4% lower as
compared to last year data (The Reject Shop, 2016).
Return on assets-
The return on assets has decreased to 5.48% in 2017 which is 2% lower as compared to last year
data (Arjaliès, and Bansal, 2018).
Solvency ratio
Descriptio
n
Formula THE REJECT SHOP LTD (TRS) Cash Flow
Flag Ratio Analysis
2015` 2016 2017
Debt to
Equity
Ratio
Debt/ Equity
0.70 0.70 0.62
Gearing
ratio
Interest/ EBIT
(0.01) (0.004) (0.004)
Debt to equity
The debt solvency of company is way too high. The debt to equity has decreased to 62% in 2017
which is 8% low as compared to last year data.
Efficiency ratio
The efficiency ratio has increased throughout the time which reflects that company has created
value on the investment. The creditor’s turnover ratio has increased to 23.26 points in 2017
which is 8 points lower since last one year (Vogel, 2014).
Descriptio
n
Formula THE REJECT SHOP LTD (TRS) Cash Flow
Flag Ratio Analysis
2015` 2016 2017
Creditors
payable
creditors / Total
sales*365 31.29 22.27 23.26
⊘ This is a preview!⊘
Do you want full access?
Subscribe today to unlock all pages.
Trusted by 1+ million students worldwide
period
Inventory
Turnover
ratio
COGS/ Sales*365
202.51 209.42 209.16
Asset
turnover
ratio
Total sales/ Total assets
3.32 3.46 3.63
Creditor’s turnover ratio
This ratio has also gone down to 23.26 points in 2017 which add value to its business (The
Reject Shop, 2016). In future, company will save good amount of cost of capital (Hababou,
Amrouche, and Jedidi, 2016).
Inventory Turnover ratio
This ratio has increased by 6 times which will add value to the business functioning of clients.
Market ratio (General investment proposal analysis)
Currently, the Reject Shop has good value creation on the market share price of company and
also added good value on the investment.
Description Formula THE REJECT SHOP LTD (TRS) Cash Flow Flag
Ratio Analysis
2015` 2016 2017
PE Ratio MPS/EPS
53.04 52.41 73.13
Dividend
Payout
dividend payment/
Earning *100
5% 6.4% 10%
THE market price of shares is AUD $ 6 which has increased 20% higher as compared to last year
data in addition to this, it will add value in the future and provide good amount of return to
investor in future. The dividend payout has also increased to 10% in 2017 (Bahreini, and
Adaoglu, 2018).
Paraphrase This Document
Need a fresh take? Get an instant paraphrase of this document with our AI Paraphraser
This collected data reflects that company could easily add value to the client’s needs which
would add value to the return on investment of the company. However, the new busienss model
which The Reject Shop Company needs to undertake is related to matrix model which shows that
company could add value to its business if proper bifurcation in the work process system is
undertaken (Delen, Kuzey, and Uyar, 2013).
Qualitative and quantitative aspects of financial analysis of The Reject Shop Company.
Increased finance leverage of the Reject Shop Company adds value to the business and
lower down the cost of capital (Ehiedu, 2014).
Dividend payment of company has increased to 10% which will attract more investors to
invest in the business of the reject shop.
The decrease in the profitability may be negative indicator for the future growth of the
Reject shop company.
Cost of capital has increased due to the increased investment of company in the research
and development department.
The general investment proposal made by company is related to increased value creation
and investing capital in hiring more experts employees in the business.
The existing employee turnover of company is 12% which might destruct the business
functioning of the Reject Shop Company in long run.
The increased business output will add value to the client’s needs and future output in
determined approach (Mwangi, and Murigu, 2015).
Summary
After analyzing all the details and problem statement faced by company, it is assessed that the
Reject Shop Company has to increase the value of its investment by undertaking the more
beneficial projects in its busienss. By using the capital assets pricing model and du Pont analysis,
company could easily evaluate whether company should re-structure its business structure or not.
Now in the end, it could be inferred that company should adopt matrix busienss model and
financial analysis process to increase the overall value of the business. There are several
financial analysis tools which could assists investors to create value on the investment.

⊘ This is a preview!⊘
Do you want full access?
Subscribe today to unlock all pages.
Trusted by 1+ million students worldwide
1 out of 17
Related Documents


Your All-in-One AI-Powered Toolkit for Academic Success.
+13062052269
info@desklib.com
Available 24*7 on WhatsApp / Email
![[object Object]](/_next/static/media/star-bottom.7253800d.svg)
Unlock your academic potential
Copyright © 2020–2026 A2Z Services. All Rights Reserved. Developed and managed by ZUCOL.