University Report: Financial Analysis of The Reject Shop's Performance
VerifiedAdded on 2023/06/04
|19
|4030
|263
Report
AI Summary
This report offers a comprehensive financial analysis of The Reject Shop, an Australian discount retailer. It utilizes ratio analysis, including liquidity, profitability, solvency, and efficiency ratios, to assess the company's financial health. The analysis covers the current, quick, and debt-to-equity ratios, along with net profit, return on equity, and asset turnover. The report evaluates the company's competitive advantages, industry position, and market ratios, including dividend payout. The analysis also compares The Reject Shop's share price movement with the all-ordinary index, computes the stock value, and dividend growth rate, providing recommendations and conclusions about the company's financial performance and investment potential. The report highlights key findings, such as high financial leverage and decreasing profitability, and discusses their implications for the company's future growth and sustainability. The report is contributed by a student and is available on Desklib, a platform offering AI-based study tools.
COmpany Selected- The Reject Shop
Financial analysis of The Reject Shop
Financial analysis
Name of the Author
University Name-
Financial analysis of The Reject Shop
Financial analysis
Name of the Author
University Name-
Paraphrase This Document
Need a fresh take? Get an instant paraphrase of this document with our AI Paraphraser
Table of Contents
Introduction.................................................................................................................................................1
Description of the Reject Shop................................................................................................................1
Core activities of the Reject Shop............................................................................................................1
Competitive advantage............................................................................................................................1
Industry...................................................................................................................................................2
Financial analysis of The Reject Shop..........................................................................................................2
Liquidity ratio...........................................................................................................................................2
Current ratio........................................................................................................................................2
Quick ratio...........................................................................................................................................3
Profitability ratio......................................................................................................................................3
Net profit margin.................................................................................................................................3
Return on equity..................................................................................................................................4
Return on assets-.................................................................................................................................4
Gross profit margin..............................................................................................................................4
Solvency ratio......................................................................................................................................4
Debt to equity......................................................................................................................................5
Efficiency ratio.........................................................................................................................................5
Creditors turnover ratio.......................................................................................................................5
Inventory Turnover ratio.....................................................................................................................6
Assets turnover ratio...........................................................................................................................6
Market ratio (General investment proposal analysis).............................................................................6
Dividend payout ratio..........................................................................................................................7
Evaluation of the key points found in this financial analysis.......................................................................7
Analysis to compare the Share price movement of Reject Shop with all ordinary index.............................7
Computation of the value of the stock of the Reject Shop Company......................................................8
Computation of the dividend growth rate of Reject Shop...................................................................9
Recommendation......................................................................................................................................10
Conclusion.................................................................................................................................................10
References.................................................................................................................................................11
Appendix...................................................................................................................................................13
⊘ This is a preview!⊘
Do you want full access?
Subscribe today to unlock all pages.
Trusted by 1+ million students worldwide
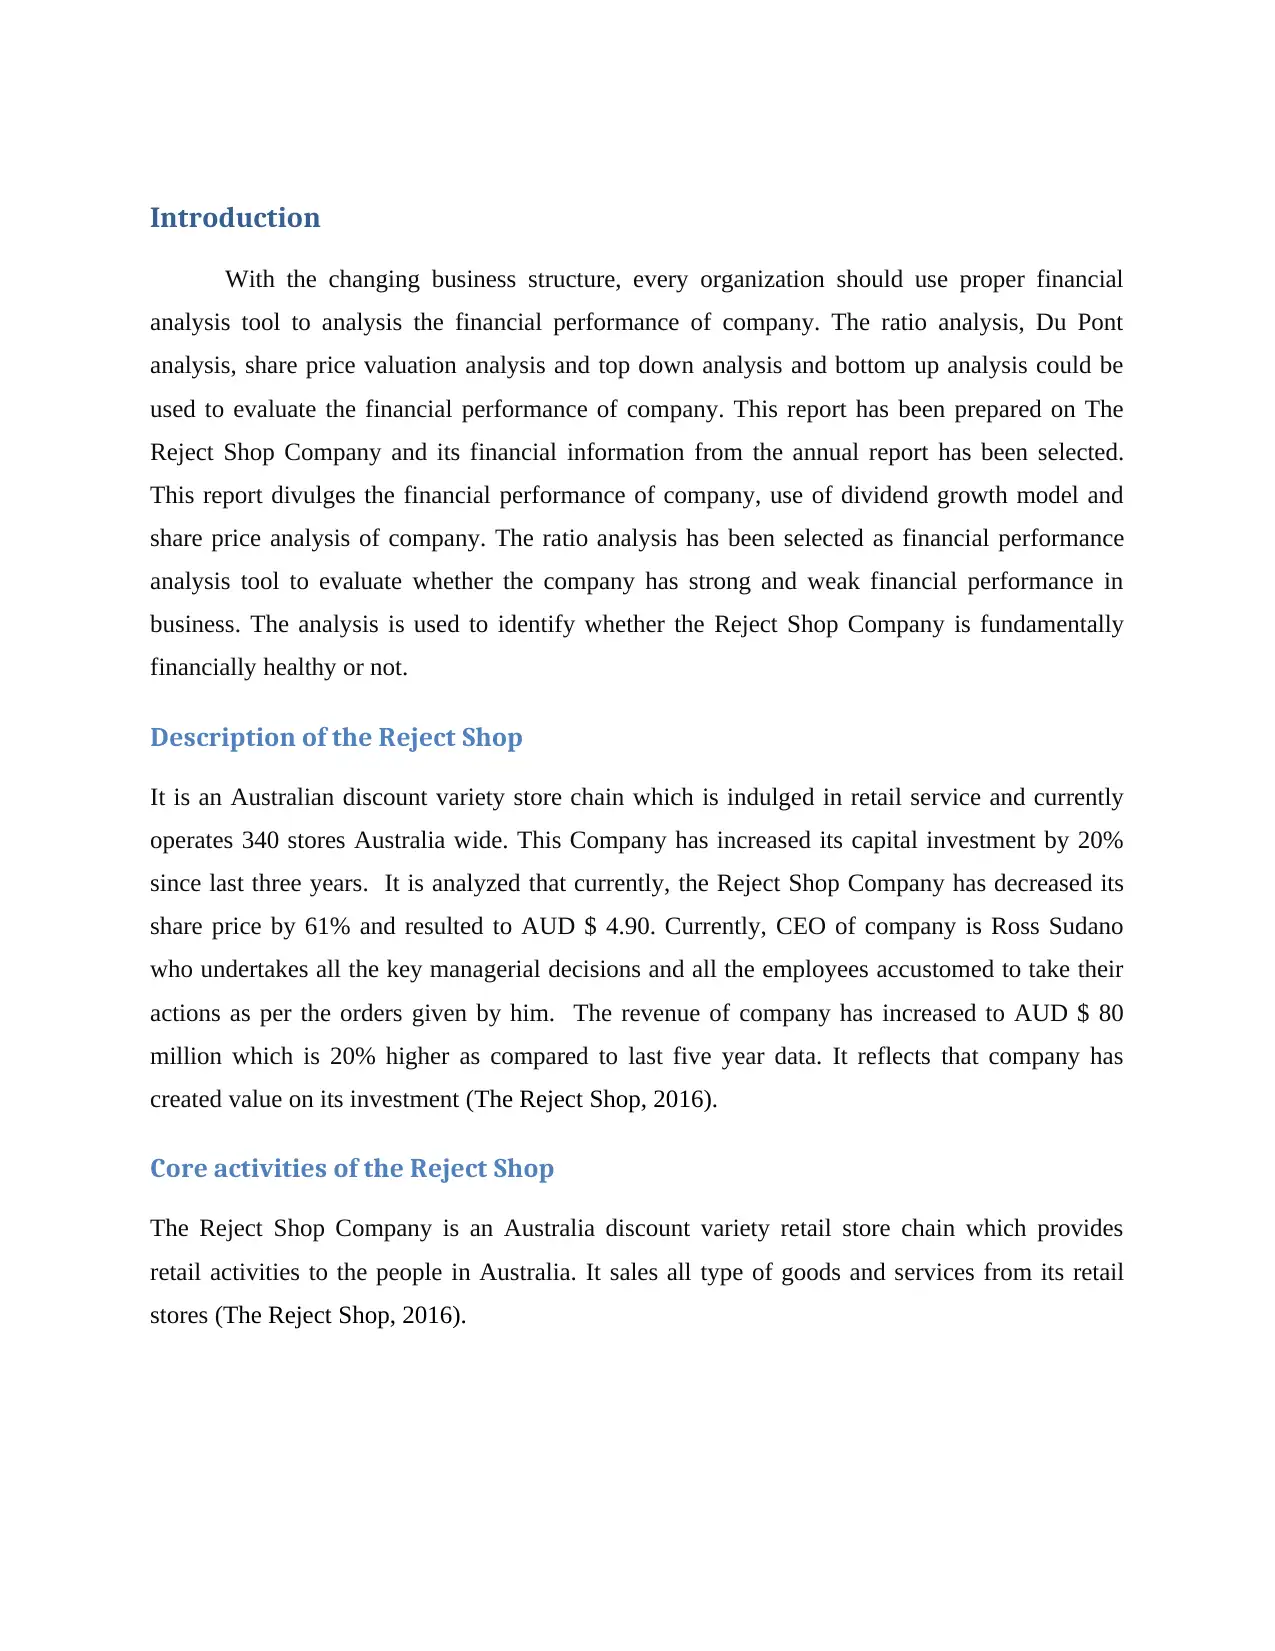
Introduction
With the changing business structure, every organization should use proper financial
analysis tool to analysis the financial performance of company. The ratio analysis, Du Pont
analysis, share price valuation analysis and top down analysis and bottom up analysis could be
used to evaluate the financial performance of company. This report has been prepared on The
Reject Shop Company and its financial information from the annual report has been selected.
This report divulges the financial performance of company, use of dividend growth model and
share price analysis of company. The ratio analysis has been selected as financial performance
analysis tool to evaluate whether the company has strong and weak financial performance in
business. The analysis is used to identify whether the Reject Shop Company is fundamentally
financially healthy or not.
Description of the Reject Shop
It is an Australian discount variety store chain which is indulged in retail service and currently
operates 340 stores Australia wide. This Company has increased its capital investment by 20%
since last three years. It is analyzed that currently, the Reject Shop Company has decreased its
share price by 61% and resulted to AUD $ 4.90. Currently, CEO of company is Ross Sudano
who undertakes all the key managerial decisions and all the employees accustomed to take their
actions as per the orders given by him. The revenue of company has increased to AUD $ 80
million which is 20% higher as compared to last five year data. It reflects that company has
created value on its investment (The Reject Shop, 2016).
Core activities of the Reject Shop
The Reject Shop Company is an Australia discount variety retail store chain which provides
retail activities to the people in Australia. It sales all type of goods and services from its retail
stores (The Reject Shop, 2016).
Paraphrase This Document
Need a fresh take? Get an instant paraphrase of this document with our AI Paraphraser
Competitive advantage
The competitive advantage of company is to offer all of its retail services at least cost. It
allows company to offer its retail services at very low price which resulted to creation of the cost
leadership strategy in market. This allows company to strengthen the overall outcomes by
grabbing more market share (The Reject Shop, 2016).
Industry
The Reject Shop is indulged in operating retail services and grabbed 12% retail market shares in
Australian retail industry. There are several other big rivals such as Wesfarmers, Woolworths
and Morrison plc who are indulged in providing the same retail services in market (The Reject
Shop, 2016).
Financial analysis of The Reject Shop
The financial analysis of company is done to identify whether the company is financially healthy
or facing high long term sustainability risk in its business. The ratio analysis as financial tool has
been used to evaluate how well the Reject Shop Company has performed throughout the time
(The Reject Shop, 2016).
Liquidity ratio
This ratio helps in analyzing the financial performance of the Reject Shop Company and its
ability to pay off its short term and long term liabilities out of the available current assets. It is
divided into two main parts which are given as below (The Reject Shop, 2016).
Current ratio
This current ratio of company has decreased by 10% in 2017 and resulted to 1.63 points in 2017.
This shows how well company has reduced its investment in its current assets. It has shown that
company has decreased its liquid assets which may result to endanger if company fails to meet
its current and long term demand of clients (The Reject Shop, 2016).
Descriptio
n
Formula THE REJECT SHOP LTD (TRS) Cash Flow
Flag Ratio Analysis
2015` 2016 2017
Current
ratio
Current assets/current
liabilities 1.82 1.49 1.63
Quick
Ratio
Current assets-
Inventory/current
liabilities
0.35 0.31 0.26
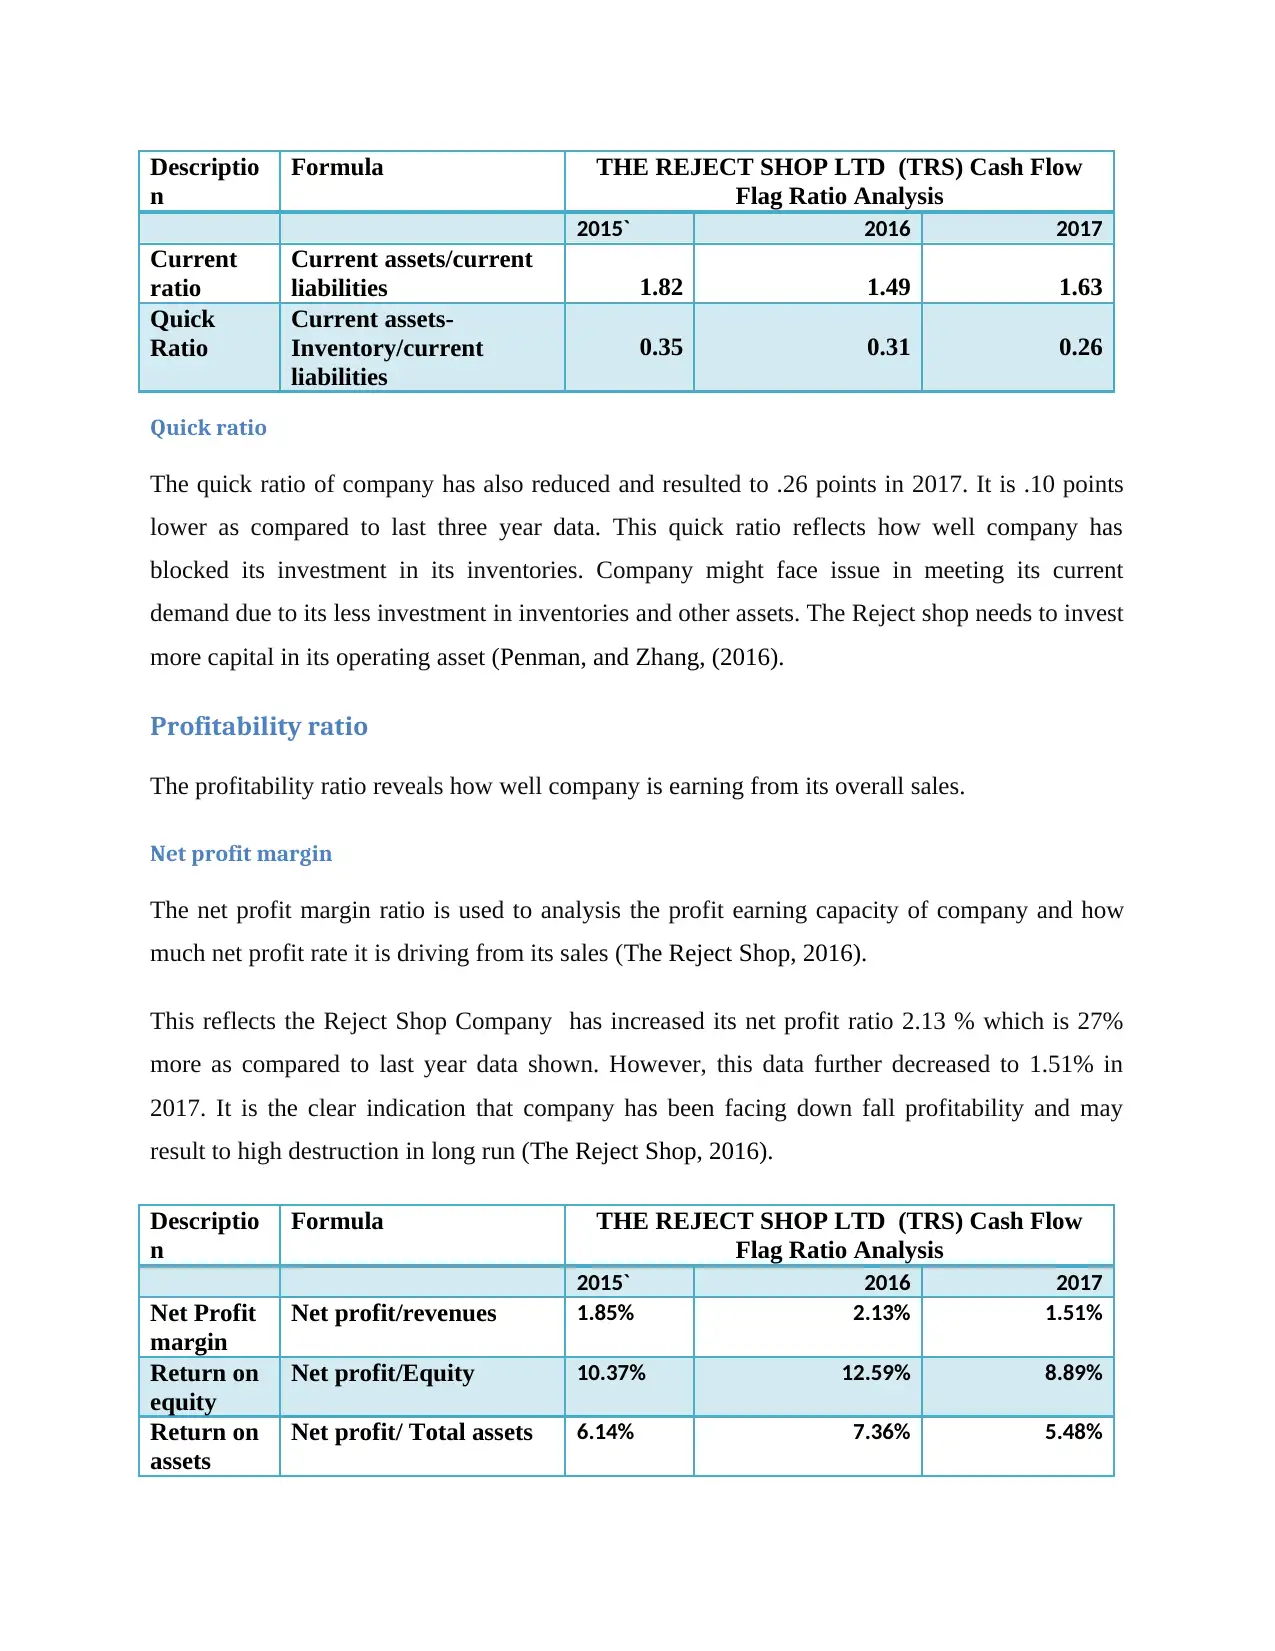
Quick ratio
The quick ratio of company has also reduced and resulted to .26 points in 2017. It is .10 points
lower as compared to last three year data. This quick ratio reflects how well company has
blocked its investment in its inventories. Company might face issue in meeting its current
demand due to its less investment in inventories and other assets. The Reject shop needs to invest
more capital in its operating asset (Penman, and Zhang, (2016).
Profitability ratio
The profitability ratio reveals how well company is earning from its overall sales.
Net profit margin
The net profit margin ratio is used to analysis the profit earning capacity of company and how
much net profit rate it is driving from its sales (The Reject Shop, 2016).
This reflects the Reject Shop Company has increased its net profit ratio 2.13 % which is 27%
more as compared to last year data shown. However, this data further decreased to 1.51% in
2017. It is the clear indication that company has been facing down fall profitability and may
result to high destruction in long run (The Reject Shop, 2016).
Descriptio
n
Formula THE REJECT SHOP LTD (TRS) Cash Flow
Flag Ratio Analysis
2015` 2016 2017
Net Profit
margin
Net profit/revenues 1.85% 2.13% 1.51%
Return on
equity
Net profit/Equity 10.37% 12.59% 8.89%
Return on
assets
Net profit/ Total assets 6.14% 7.36% 5.48%
n
Formula THE REJECT SHOP LTD (TRS) Cash Flow
Flag Ratio Analysis
2015` 2016 2017
Current
ratio
Current assets/current
liabilities 1.82 1.49 1.63
Quick
Ratio
Current assets-
Inventory/current
liabilities
0.35 0.31 0.26
Quick ratio
The quick ratio of company has also reduced and resulted to .26 points in 2017. It is .10 points
lower as compared to last three year data. This quick ratio reflects how well company has
blocked its investment in its inventories. Company might face issue in meeting its current
demand due to its less investment in inventories and other assets. The Reject shop needs to invest
more capital in its operating asset (Penman, and Zhang, (2016).
Profitability ratio
The profitability ratio reveals how well company is earning from its overall sales.
Net profit margin
The net profit margin ratio is used to analysis the profit earning capacity of company and how
much net profit rate it is driving from its sales (The Reject Shop, 2016).
This reflects the Reject Shop Company has increased its net profit ratio 2.13 % which is 27%
more as compared to last year data shown. However, this data further decreased to 1.51% in
2017. It is the clear indication that company has been facing down fall profitability and may
result to high destruction in long run (The Reject Shop, 2016).
Descriptio
n
Formula THE REJECT SHOP LTD (TRS) Cash Flow
Flag Ratio Analysis
2015` 2016 2017
Net Profit
margin
Net profit/revenues 1.85% 2.13% 1.51%
Return on
equity
Net profit/Equity 10.37% 12.59% 8.89%
Return on
assets
Net profit/ Total assets 6.14% 7.36% 5.48%
⊘ This is a preview!⊘
Do you want full access?
Subscribe today to unlock all pages.
Trusted by 1+ million students worldwide
Return on equity
This is the amount of profit offered to equity shareholders out of the available earning. It is
analyzed that the Reject Shop has decreased its return on equity to 8.89% in 2017 which is 2%
lower as compared to last two year data (Penman, and Zhang, (2016). However, the main reason
of decrease in its overall profitability is due to the negative market factors and sluggish market
condition. Company should focus on following the constant dividend policies otherwise the
reduced profitability will negatively impact the capital investment decisions of the investors (The
Reject Shop, 2016).
Return on assets-
The return on assets of company has decreased 5, 49% which is 1% low if it is compared with
last year data. The main reason of decrease return on assets is based on the low business
efficiency and net profit (The Reject Shop, 2016).
Gross profit margin
The gross profit margin ratio reflects the relation between the net profits earning capacity of
company and how it has increased its profitability throughout the time. It is analyzed that the
Reject shop has decrease its operating profit which has also resulted to decrease in its gross profit
margin to 2.1%. It has decreased by 12% since last three years.
9358617178
Solvency ratio
This ratio is the key indicator to showcase whether company has managed its capital structure in
effective manner. The debt to equity structure of company has been very much high which
reflect that the Reject Shop Company will have high financial leverage (Talebnia, Jaberzadeh,
and Salehi, 2015).
Descriptio
n
Formula THE REJECT SHOP LTD (TRS) Cash Flow
Flag Ratio Analysis
2015` 2016 2017
Paraphrase This Document
Need a fresh take? Get an instant paraphrase of this document with our AI Paraphraser
Debt to
Equity
Ratio
Debt/ Equity
0.70 0.70 0.62
Gearing
ratio
Interest/ EBIT
(0.01) (0.004) (0.004)
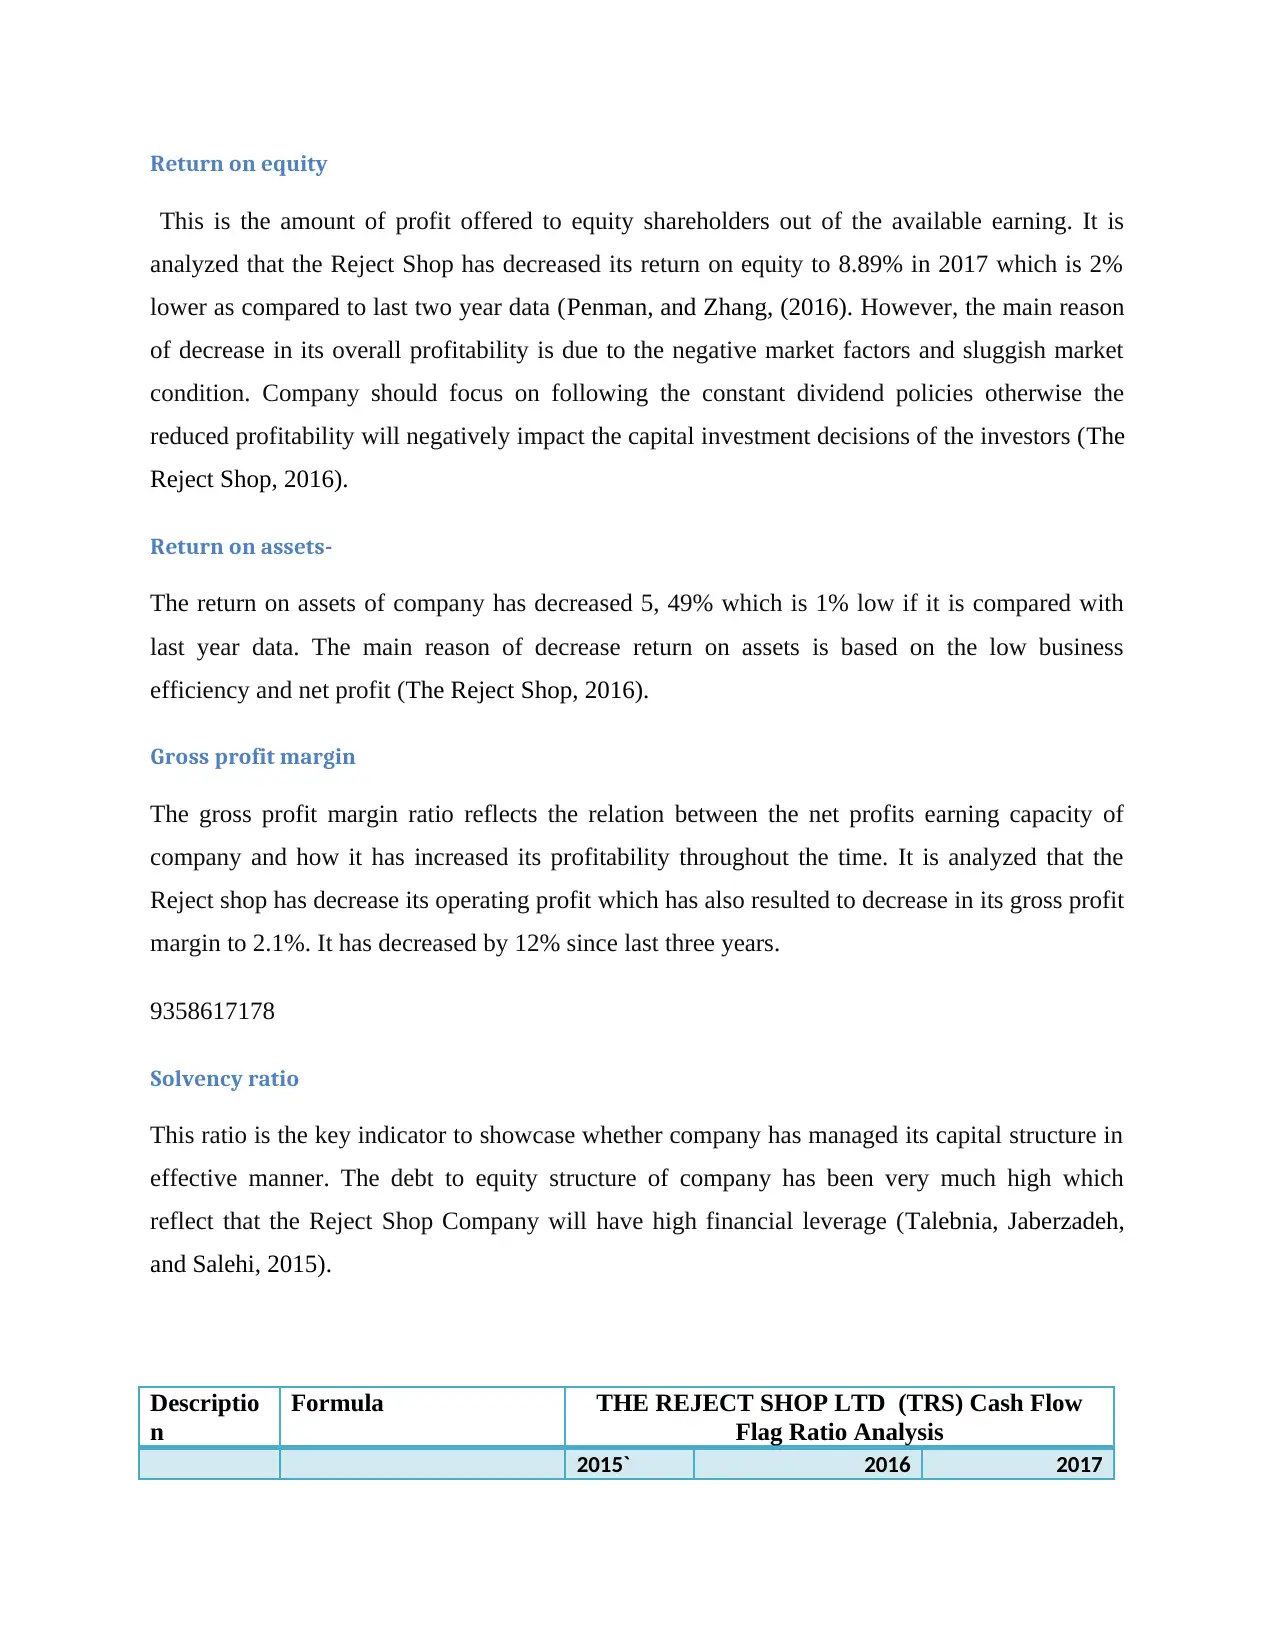
Debt to equity
The solvency ratio has shown that company has kept high debt to equity structures which will
not only increase the overall financial leverage but also lower down the cost of capital of
organization. It is analyzed that company should lower down its debt to equity ratio if it wants to
keep its business sustainable in long run (Penman, and Zhang, (2016).
Gearing ratio
The gearing ratio of company has been showing the negative results which reflect that if
company does not lower down its interest payment then it could face high sustainability risk in
long run. The Reject Shop has been facing high financial risk which may negatively impact its
business (Suzuki, 2015).
Efficiency ratio
The efficiency ratio shows how well company has deployed its assets or investment in its
business functioning.
Creditors turnover ratio
It is analyzed that the creditor’s payable turnover of Reject shop has decreased which has also
resulted to increase in its cash blockage. It has decreased to 23.26 times in 2017 which is 7 times
lower since last three years (Phillips, Pincus, and Rego, 2013).
Descriptio
n
Formula THE REJECT SHOP LTD (TRS) Cash Flow
Flag Ratio Analysis
2015` 2016 2017
Creditors
payable
period
creditors / Total
sales*365 31.29 22.27 23.26
Inventory
Turnover
ratio
COGS/ Sales*365
202.51 209.42 209.16
Equity
Ratio
Debt/ Equity
0.70 0.70 0.62
Gearing
ratio
Interest/ EBIT
(0.01) (0.004) (0.004)
Debt to equity
The solvency ratio has shown that company has kept high debt to equity structures which will
not only increase the overall financial leverage but also lower down the cost of capital of
organization. It is analyzed that company should lower down its debt to equity ratio if it wants to
keep its business sustainable in long run (Penman, and Zhang, (2016).
Gearing ratio
The gearing ratio of company has been showing the negative results which reflect that if
company does not lower down its interest payment then it could face high sustainability risk in
long run. The Reject Shop has been facing high financial risk which may negatively impact its
business (Suzuki, 2015).
Efficiency ratio
The efficiency ratio shows how well company has deployed its assets or investment in its
business functioning.
Creditors turnover ratio
It is analyzed that the creditor’s payable turnover of Reject shop has decreased which has also
resulted to increase in its cash blockage. It has decreased to 23.26 times in 2017 which is 7 times
lower since last three years (Phillips, Pincus, and Rego, 2013).
Descriptio
n
Formula THE REJECT SHOP LTD (TRS) Cash Flow
Flag Ratio Analysis
2015` 2016 2017
Creditors
payable
period
creditors / Total
sales*365 31.29 22.27 23.26
Inventory
Turnover
ratio
COGS/ Sales*365
202.51 209.42 209.16
Asset
turnover
ratio
Total sales/ Total assets
3.32 3.46 3.63
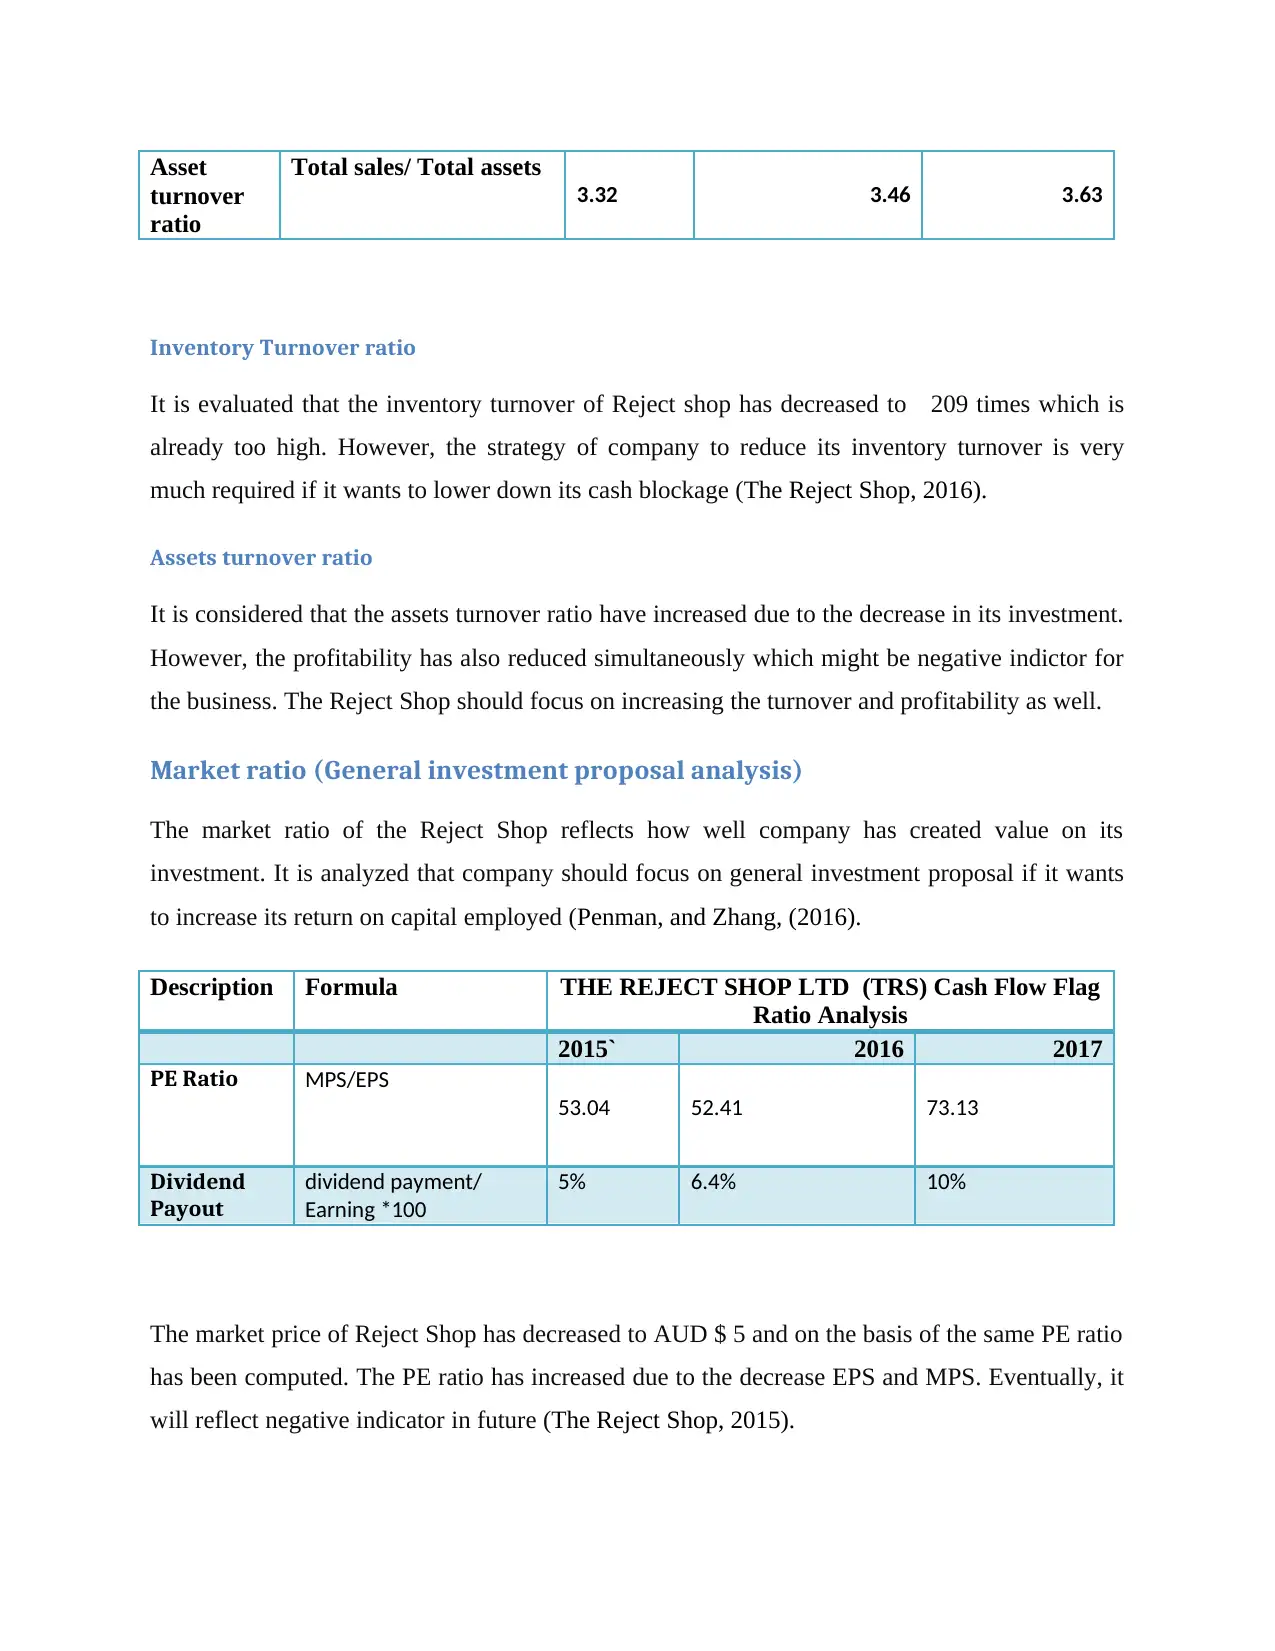
Inventory Turnover ratio
It is evaluated that the inventory turnover of Reject shop has decreased to 209 times which is
already too high. However, the strategy of company to reduce its inventory turnover is very
much required if it wants to lower down its cash blockage (The Reject Shop, 2016).
Assets turnover ratio
It is considered that the assets turnover ratio have increased due to the decrease in its investment.
However, the profitability has also reduced simultaneously which might be negative indictor for
the business. The Reject Shop should focus on increasing the turnover and profitability as well.
Market ratio (General investment proposal analysis)
The market ratio of the Reject Shop reflects how well company has created value on its
investment. It is analyzed that company should focus on general investment proposal if it wants
to increase its return on capital employed (Penman, and Zhang, (2016).
Description Formula THE REJECT SHOP LTD (TRS) Cash Flow Flag
Ratio Analysis
2015` 2016 2017
PE Ratio MPS/EPS
53.04 52.41 73.13
Dividend
Payout
dividend payment/
Earning *100
5% 6.4% 10%
The market price of Reject Shop has decreased to AUD $ 5 and on the basis of the same PE ratio
has been computed. The PE ratio has increased due to the decrease EPS and MPS. Eventually, it
will reflect negative indicator in future (The Reject Shop, 2015).
turnover
ratio
Total sales/ Total assets
3.32 3.46 3.63
Inventory Turnover ratio
It is evaluated that the inventory turnover of Reject shop has decreased to 209 times which is
already too high. However, the strategy of company to reduce its inventory turnover is very
much required if it wants to lower down its cash blockage (The Reject Shop, 2016).
Assets turnover ratio
It is considered that the assets turnover ratio have increased due to the decrease in its investment.
However, the profitability has also reduced simultaneously which might be negative indictor for
the business. The Reject Shop should focus on increasing the turnover and profitability as well.
Market ratio (General investment proposal analysis)
The market ratio of the Reject Shop reflects how well company has created value on its
investment. It is analyzed that company should focus on general investment proposal if it wants
to increase its return on capital employed (Penman, and Zhang, (2016).
Description Formula THE REJECT SHOP LTD (TRS) Cash Flow Flag
Ratio Analysis
2015` 2016 2017
PE Ratio MPS/EPS
53.04 52.41 73.13
Dividend
Payout
dividend payment/
Earning *100
5% 6.4% 10%
The market price of Reject Shop has decreased to AUD $ 5 and on the basis of the same PE ratio
has been computed. The PE ratio has increased due to the decrease EPS and MPS. Eventually, it
will reflect negative indicator in future (The Reject Shop, 2015).
⊘ This is a preview!⊘
Do you want full access?
Subscribe today to unlock all pages.
Trusted by 1+ million students worldwide
Dividend payout ratio
The dividend payment to its equity shareholders have increased to 10% as company wants to
attract other investors who could invest their capital in its business. However, with the decrease
in its profit, company still offering high dividend which might result to destruction of the
business if it happens on consistent basis (Di Tella, 2017).
Evaluation of the key points found in this financial analysis
Following key information is found.
The Reject Shop has high financial leverage.
The profitability of company has drastically decreased.
Company might face issue in its capital investment due to its high dividend offered to
shareholders.
It might negatively impact the business if company does not change in efficiency ratio.
Share price (The Reject Shop, 2016).
If company does not take into account its profitability and business efficiency then it will
negatively impact the business growth and will also result to destruction of the organization.
THE share price analysis has also reflected that company will be having negative share price as it
will have downfall in the share price movement throughout the time (Marley, and Pedersen,
2015).
Analysis to compare the Share price movement of Reject Shop with all
ordinary index
The share price movement of The Reject shop is reflecting the negative indicator for the future
growth. The viability of the share price movement of company is negative and it will not only
destruct the investment made by shareholders but also showing the high sustainable risk of
company (Di Tella, 2017). On the other hand, the share price movement of all ordinary indexes
is positive and reflects that other companies which have listed their shares on all ordinary
indexes are having less fluctuation in their share price (Mudiyanselage, and Wijekoon, 2018).
Paraphrase This Document
Need a fresh take? Get an instant paraphrase of this document with our AI Paraphraser
1/1/2016
3/1/2016
5/1/2016
7/1/2016
9/1/2016
11/1/2016
1/1/2017
3/1/2017
5/1/2017
7/1/2017
9/1/2017
11/1/2017
(0.60)
(0.50)
(0.40)
(0.30)
(0.20)
(0.10)
-
0.10
0.20
0.30
The Reject Shop
Adj Close (All ordinary
share index)
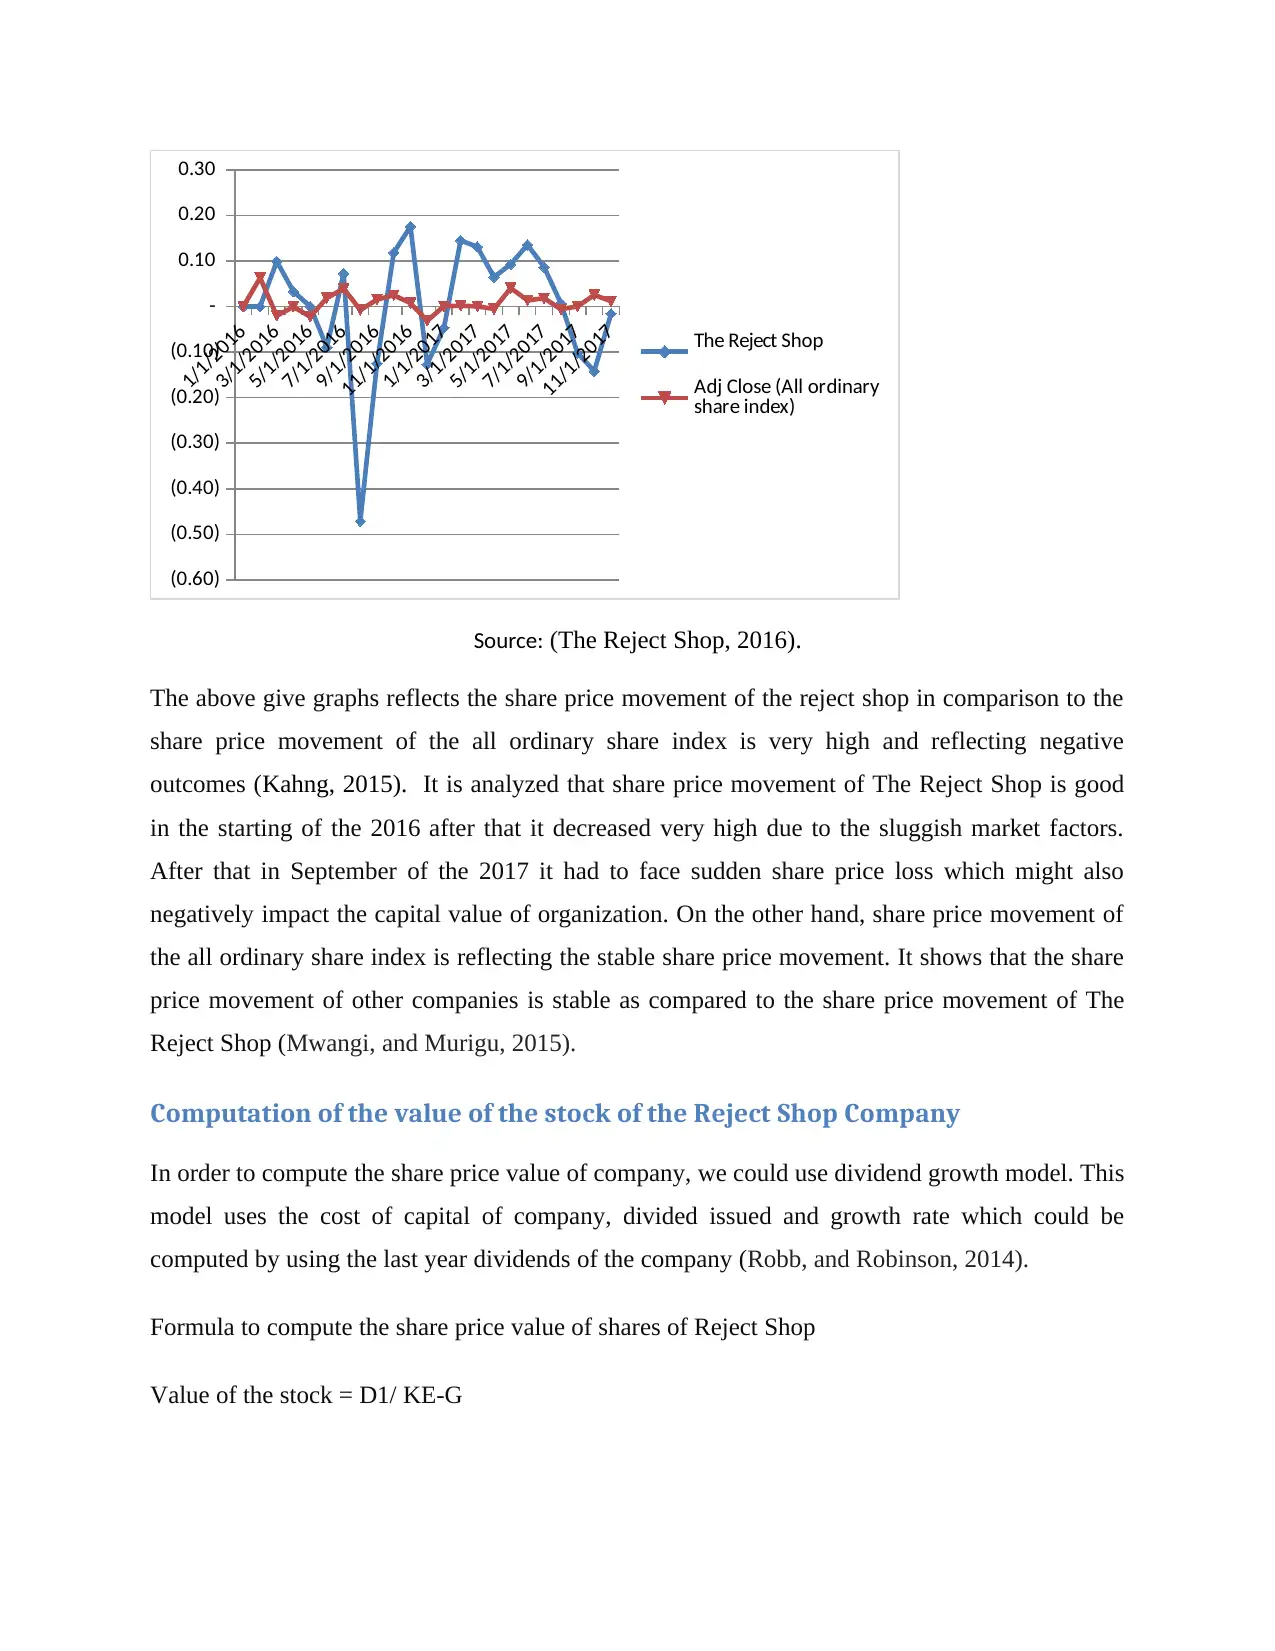
Source: (The Reject Shop, 2016).
The above give graphs reflects the share price movement of the reject shop in comparison to the
share price movement of the all ordinary share index is very high and reflecting negative
outcomes (Kahng, 2015). It is analyzed that share price movement of The Reject Shop is good
in the starting of the 2016 after that it decreased very high due to the sluggish market factors.
After that in September of the 2017 it had to face sudden share price loss which might also
negatively impact the capital value of organization. On the other hand, share price movement of
the all ordinary share index is reflecting the stable share price movement. It shows that the share
price movement of other companies is stable as compared to the share price movement of The
Reject Shop (Mwangi, and Murigu, 2015).
Computation of the value of the stock of the Reject Shop Company
In order to compute the share price value of company, we could use dividend growth model. This
model uses the cost of capital of company, divided issued and growth rate which could be
computed by using the last year dividends of the company (Robb, and Robinson, 2014).
Formula to compute the share price value of shares of Reject Shop
Value of the stock = D1/ KE-G
3/1/2016
5/1/2016
7/1/2016
9/1/2016
11/1/2016
1/1/2017
3/1/2017
5/1/2017
7/1/2017
9/1/2017
11/1/2017
(0.60)
(0.50)
(0.40)
(0.30)
(0.20)
(0.10)
-
0.10
0.20
0.30
The Reject Shop
Adj Close (All ordinary
share index)
Source: (The Reject Shop, 2016).
The above give graphs reflects the share price movement of the reject shop in comparison to the
share price movement of the all ordinary share index is very high and reflecting negative
outcomes (Kahng, 2015). It is analyzed that share price movement of The Reject Shop is good
in the starting of the 2016 after that it decreased very high due to the sluggish market factors.
After that in September of the 2017 it had to face sudden share price loss which might also
negatively impact the capital value of organization. On the other hand, share price movement of
the all ordinary share index is reflecting the stable share price movement. It shows that the share
price movement of other companies is stable as compared to the share price movement of The
Reject Shop (Mwangi, and Murigu, 2015).
Computation of the value of the stock of the Reject Shop Company
In order to compute the share price value of company, we could use dividend growth model. This
model uses the cost of capital of company, divided issued and growth rate which could be
computed by using the last year dividends of the company (Robb, and Robinson, 2014).
Formula to compute the share price value of shares of Reject Shop
Value of the stock = D1/ KE-G
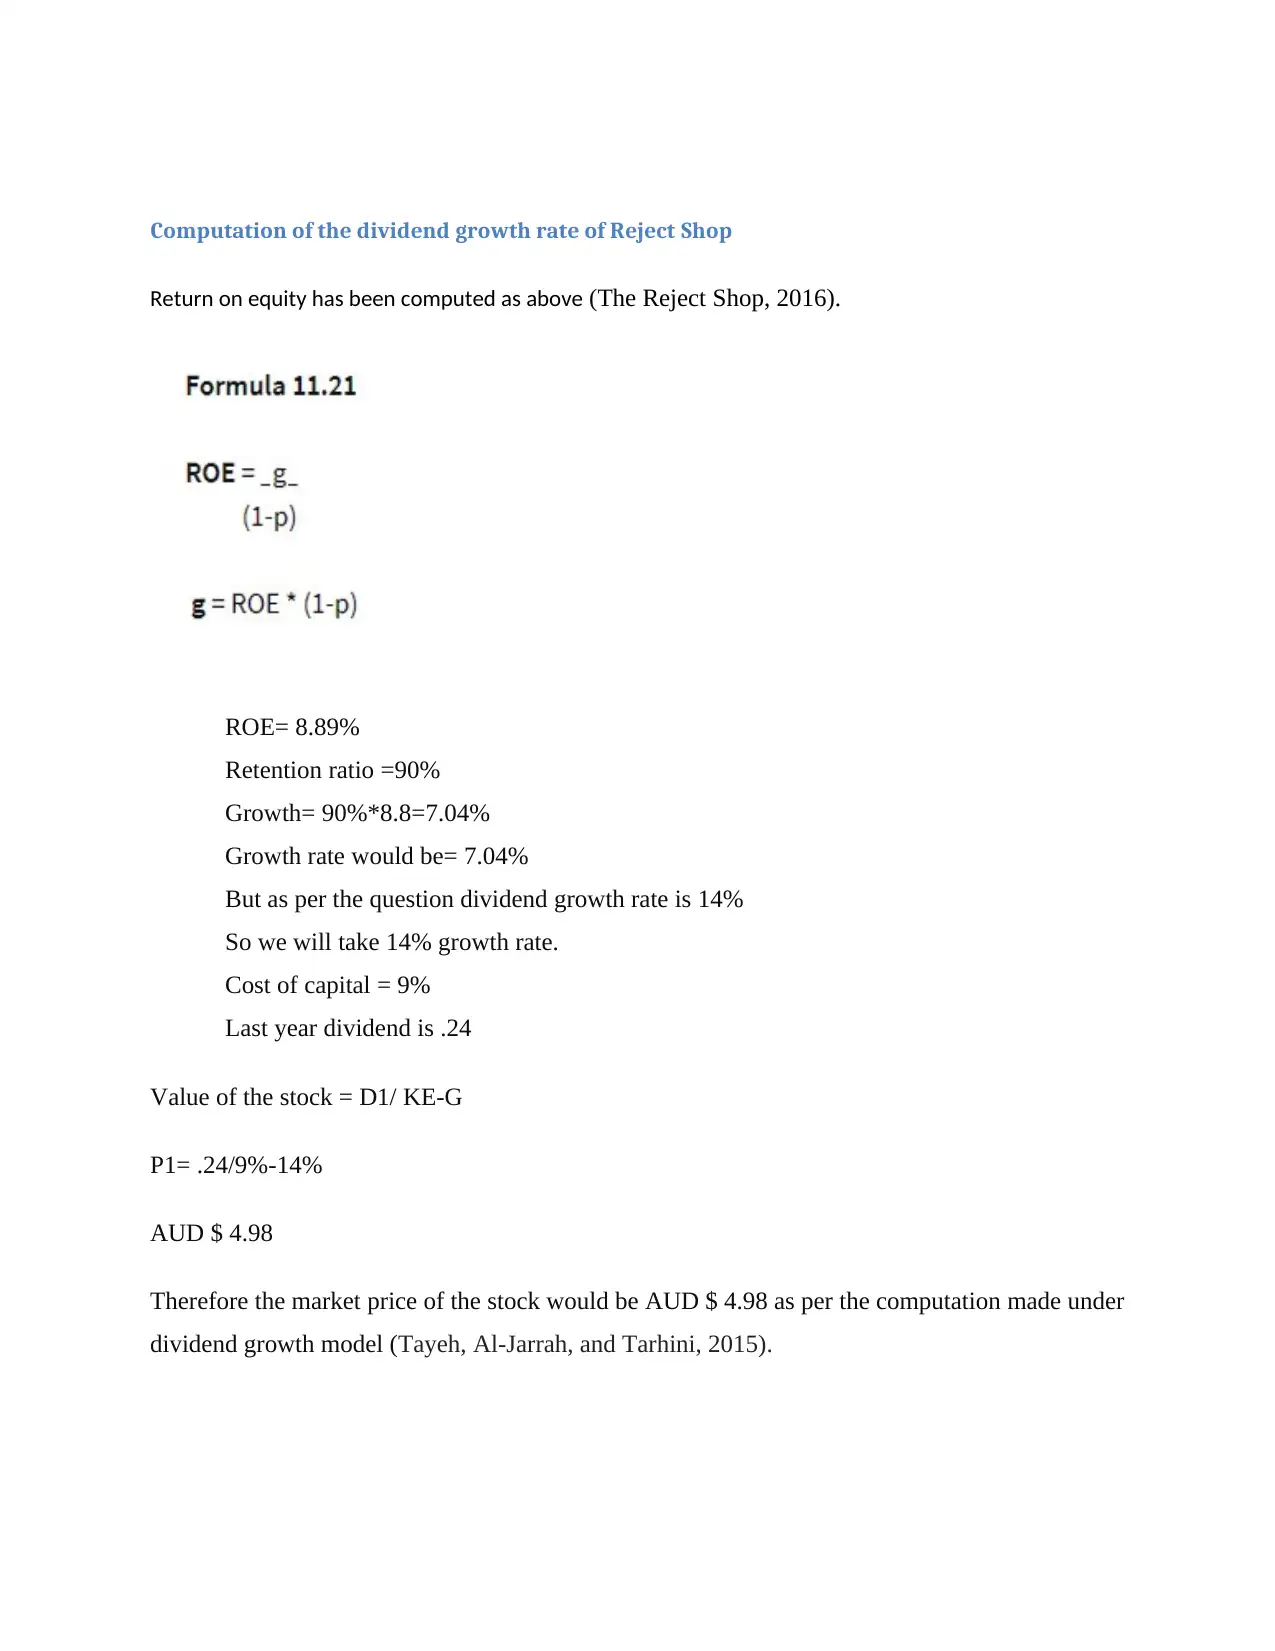
Computation of the dividend growth rate of Reject Shop
Return on equity has been computed as above (The Reject Shop, 2016).
ROE= 8.89%
Retention ratio =90%
Growth= 90%*8.8=7.04%
Growth rate would be= 7.04%
But as per the question dividend growth rate is 14%
So we will take 14% growth rate.
Cost of capital = 9%
Last year dividend is .24
Value of the stock = D1/ KE-G
P1= .24/9%-14%
AUD $ 4.98
Therefore the market price of the stock would be AUD $ 4.98 as per the computation made under
dividend growth model (Tayeh, Al-Jarrah, and Tarhini, 2015).
⊘ This is a preview!⊘
Do you want full access?
Subscribe today to unlock all pages.
Trusted by 1+ million students worldwide
1 out of 19
Related Documents


Your All-in-One AI-Powered Toolkit for Academic Success.
+13062052269
info@desklib.com
Available 24*7 on WhatsApp / Email
![[object Object]](/_next/static/media/star-bottom.7253800d.svg)
Unlock your academic potential
Copyright © 2020–2026 A2Z Services. All Rights Reserved. Developed and managed by ZUCOL.