Report on the Relation Between Life Satisfaction and GDP (Economics)
VerifiedAdded on 2022/08/16
|12
|1767
|15
Report
AI Summary
This report examines the correlation between life satisfaction and Gross Domestic Product (GDP) using quantitative data analysis. Secondary data on average life satisfaction and annual per capita GDP from 35 OECD countries were collected and analyzed. Descriptive statistics, scatter diagrams, and regression analysis were employed to assess the relationship. The results indicate a positive association between per capita GDP and average life satisfaction, suggesting that higher GDP correlates with increased life satisfaction. The report discusses the findings, limitations, and policy implications, recommending measures to enhance per capita GDP to improve overall well-being. The study highlights the importance of considering factors beyond GDP that influence life satisfaction and emphasizes the value of innovation, population management, and comprehensive approaches to improve people's happiness.
Running head: ECONOMICS AND QUANTITATIVE ANALYSIS
Economics and Quantitative Analysis
Name of the Student
Name of the University
Student ID
Economics and Quantitative Analysis
Name of the Student
Name of the University
Student ID
Paraphrase This Document
Need a fresh take? Get an instant paraphrase of this document with our AI Paraphraser
1ECONOMICS AND QUANTITATIVE ANALYSIS
Table of Contents
Purpose............................................................................................................................................2
Background......................................................................................................................................2
Method.............................................................................................................................................2
Result...............................................................................................................................................3
Discussion........................................................................................................................................8
Recommendation.............................................................................................................................9
References......................................................................................................................................10
2ECONOMICS AND QUANTITATIVE ANALYSIS
Purpose
The primary purpose of the report is to examine the relation between life satisfaction and
Gross Domestic Product.
Background
There is a long standing debate on the relation between income and life satisfaction
among the economists. This issue is particularly important because of its implication on policy
formulation (Stevenson and Wolfers 2013, pp.598-604). One study made by Easterlin showed
that despite significant increase in per capita income of USA between 1974 and 2004, there was
no significant improvement in the average satisfaction level of people. This finding was further
supported by research papers developed by some political scientist and psychologists (Diener,
Inglehart and Tay 2013, pp.497-527). In contrast to these findings one cross sectional study
confirmed a steadily increasing relation between income and life satisfaction at a given point of
time. Some studies found that life satisfaction though increases with income but up to a certain
level of income (Diener, Oishi and Lucas 2015, p.234). Because of different views among the
economists regarding the direction of relation between average income and life satisfaction
research in this area has attracted significant attention.
Method
In order to examine the relationship between life satisfaction and GDP, quantitative data
analysis method has been used considering the secondary data collected on average life
satisfaction and annual per capita GDP (Antwi and Hamza 2015, pp.217-225). Data are collected
for 35 selected countries from the published official statistics of OECD. Before estimating the
statistical relation between the two variables descriptive measures are first computed for getting
⊘ This is a preview!⊘
Do you want full access?
Subscribe today to unlock all pages.
Trusted by 1+ million students worldwide
3ECONOMICS AND QUANTITATIVE ANALYSIS
overall summary of the data. Next, scatter diagram has been prepared to examine the relation
graphically. Finally, regression analysis has been conducted to evaluate impact of annual per
capita GDP on life satisfaction followed by analysis of statistical significance and goodness of
fit.
Result
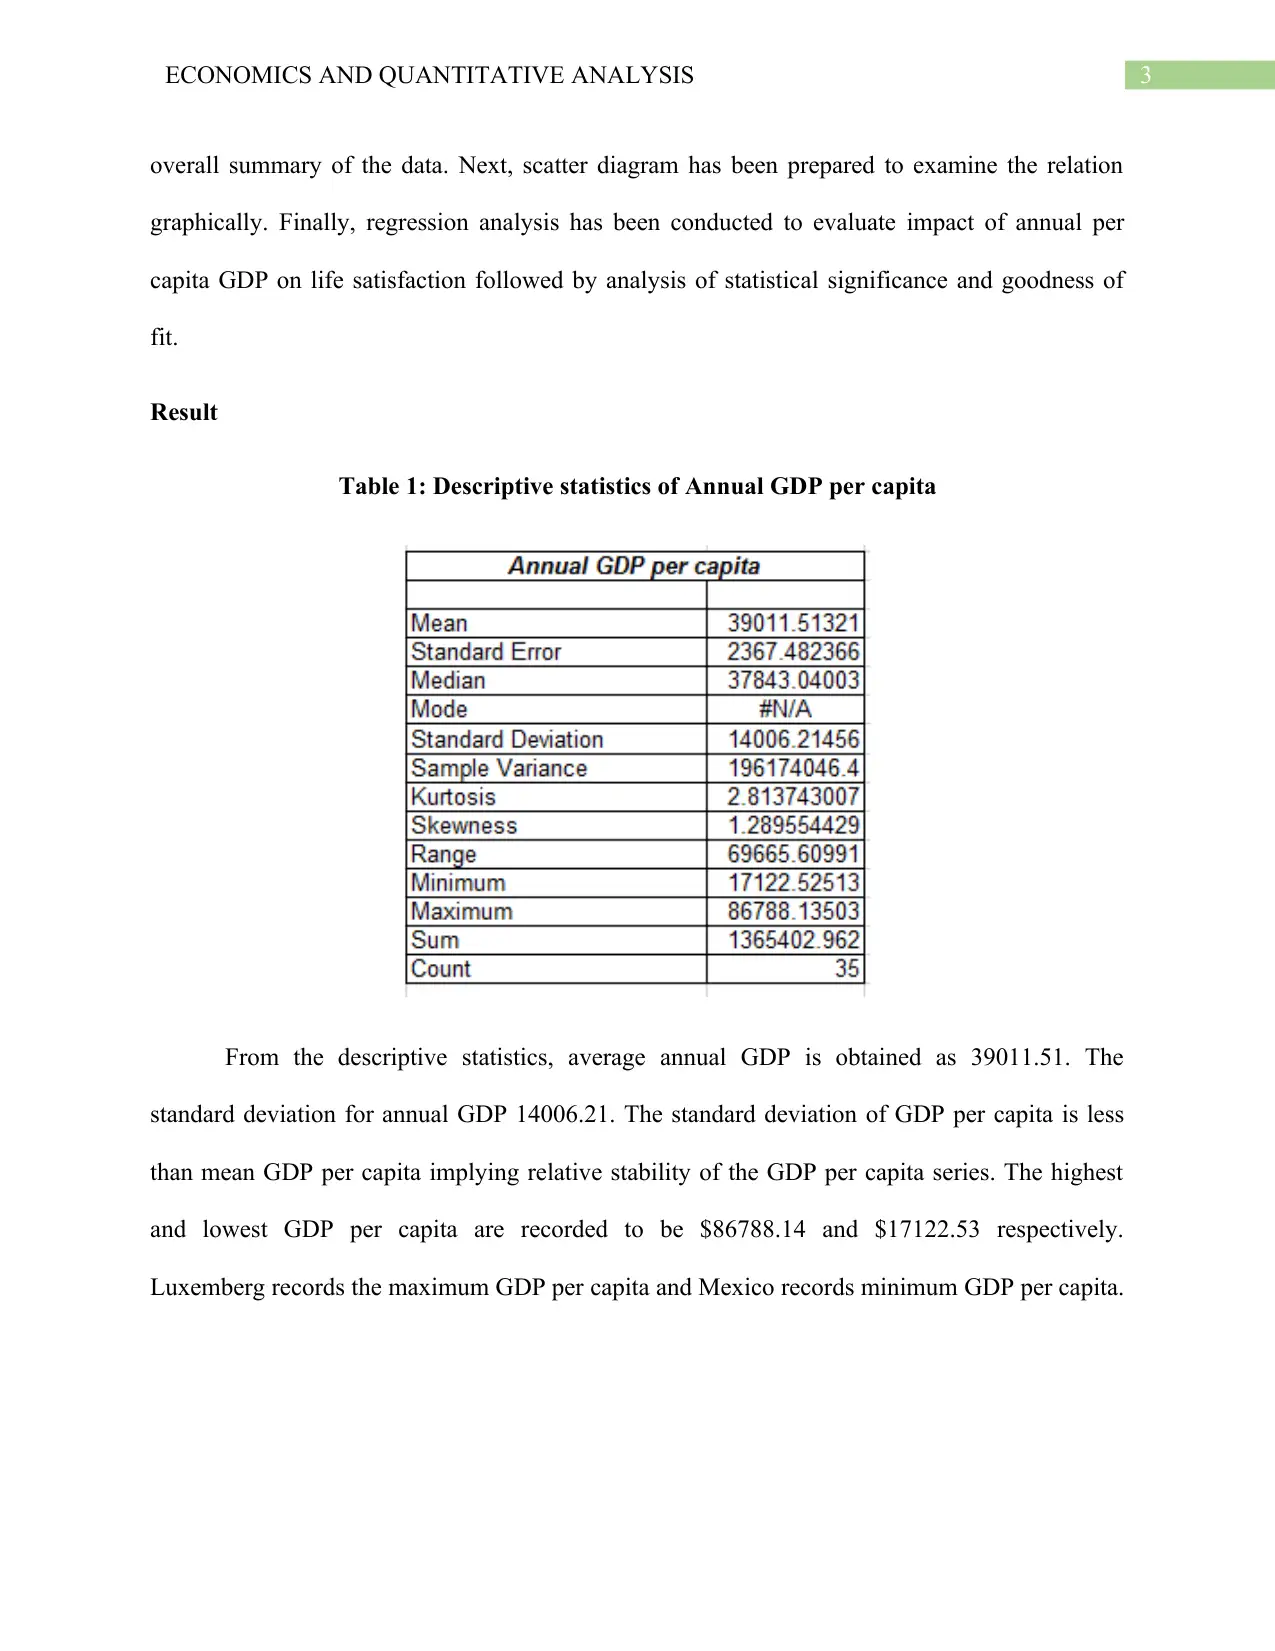
Table 1: Descriptive statistics of Annual GDP per capita
From the descriptive statistics, average annual GDP is obtained as 39011.51. The
standard deviation for annual GDP 14006.21. The standard deviation of GDP per capita is less
than mean GDP per capita implying relative stability of the GDP per capita series. The highest
and lowest GDP per capita are recorded to be $86788.14 and $17122.53 respectively.
Luxemberg records the maximum GDP per capita and Mexico records minimum GDP per capita.
overall summary of the data. Next, scatter diagram has been prepared to examine the relation
graphically. Finally, regression analysis has been conducted to evaluate impact of annual per
capita GDP on life satisfaction followed by analysis of statistical significance and goodness of
fit.
Result
Table 1: Descriptive statistics of Annual GDP per capita
From the descriptive statistics, average annual GDP is obtained as 39011.51. The
standard deviation for annual GDP 14006.21. The standard deviation of GDP per capita is less
than mean GDP per capita implying relative stability of the GDP per capita series. The highest
and lowest GDP per capita are recorded to be $86788.14 and $17122.53 respectively.
Luxemberg records the maximum GDP per capita and Mexico records minimum GDP per capita.
Paraphrase This Document
Need a fresh take? Get an instant paraphrase of this document with our AI Paraphraser
4ECONOMICS AND QUANTITATIVE ANALYSIS
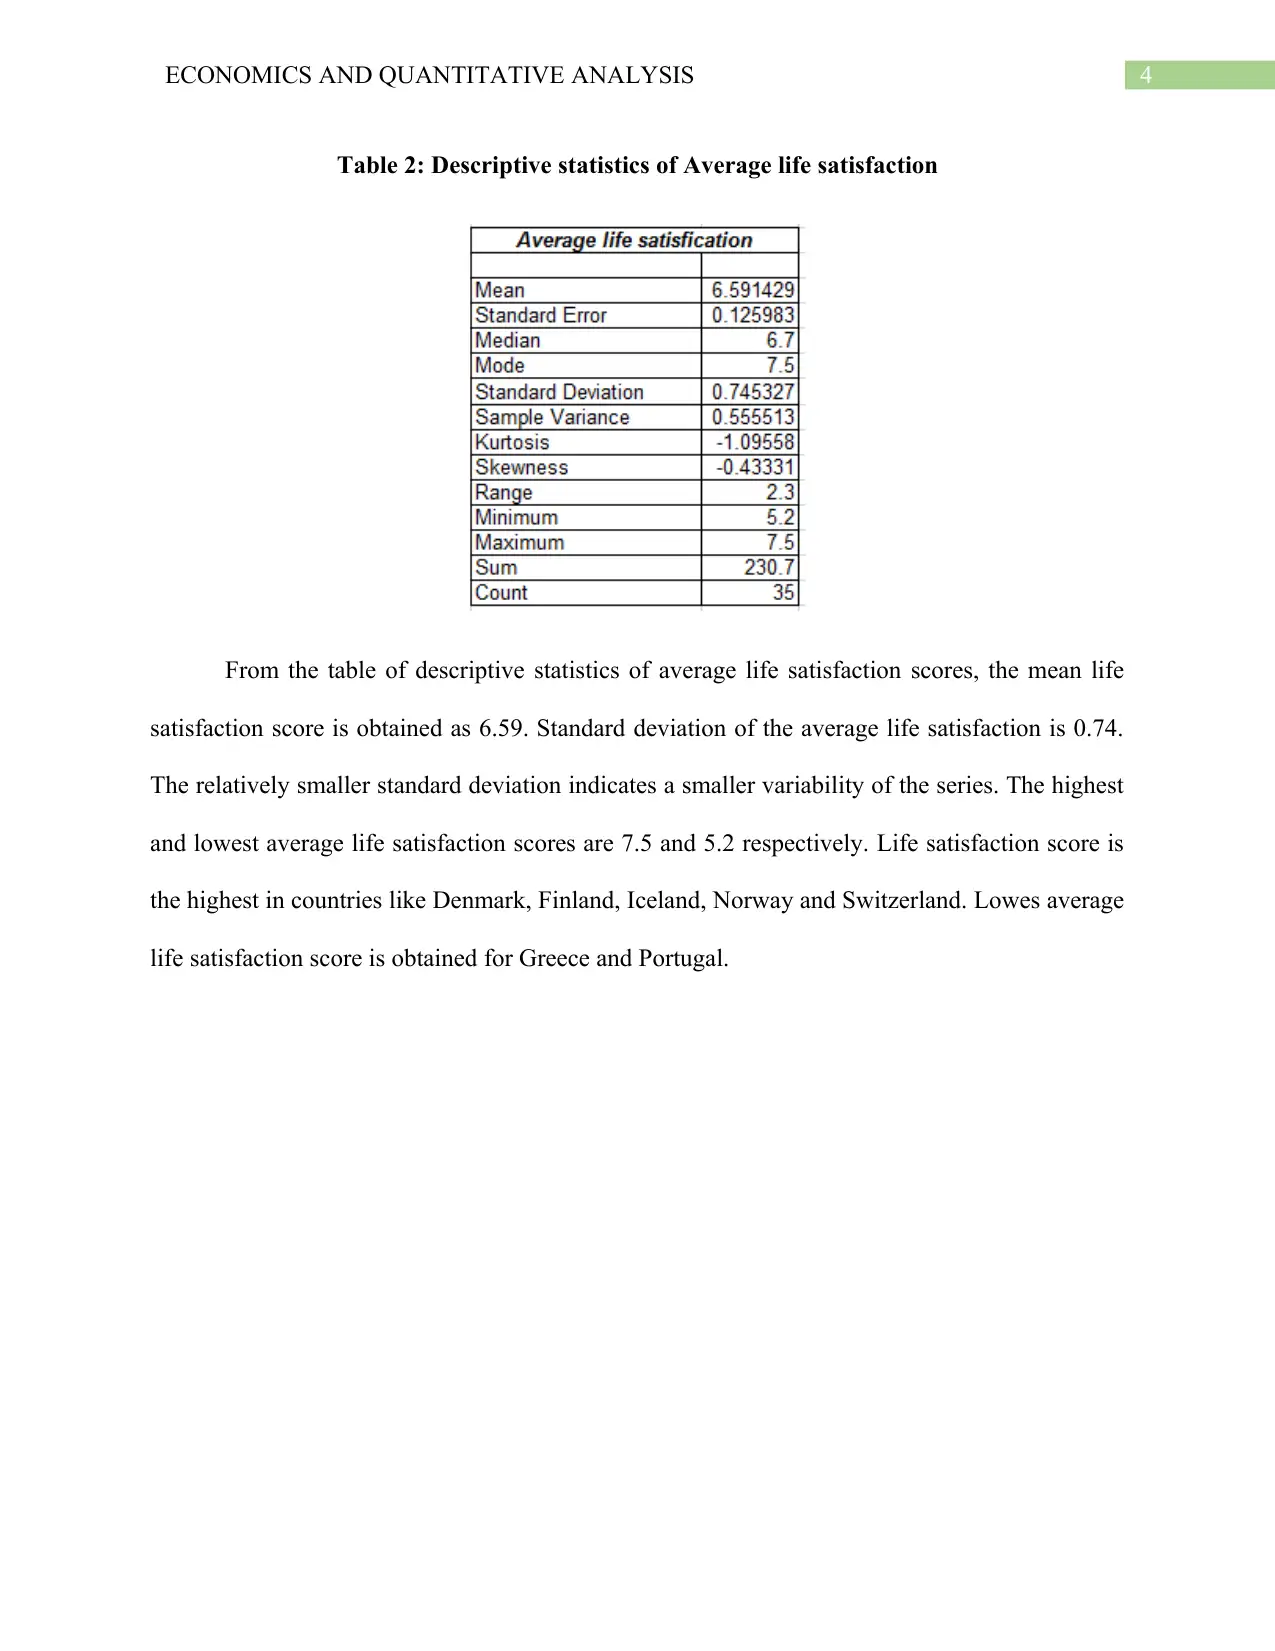
Table 2: Descriptive statistics of Average life satisfaction
From the table of descriptive statistics of average life satisfaction scores, the mean life
satisfaction score is obtained as 6.59. Standard deviation of the average life satisfaction is 0.74.
The relatively smaller standard deviation indicates a smaller variability of the series. The highest
and lowest average life satisfaction scores are 7.5 and 5.2 respectively. Life satisfaction score is
the highest in countries like Denmark, Finland, Iceland, Norway and Switzerland. Lowes average
life satisfaction score is obtained for Greece and Portugal.
5ECONOMICS AND QUANTITATIVE ANALYSIS
$0.00 $50,000.00 $100,000.00
0.0
1.0
2.0
3.0
4.0
5.0
6.0
7.0
8.0 f(x) = 3.14329537364211E-05 x + 5.36518148151715
erage life satisfi ationAv c
erage life satisfi ationAv c
inear erage lifeL (Av
satisfi ationc )
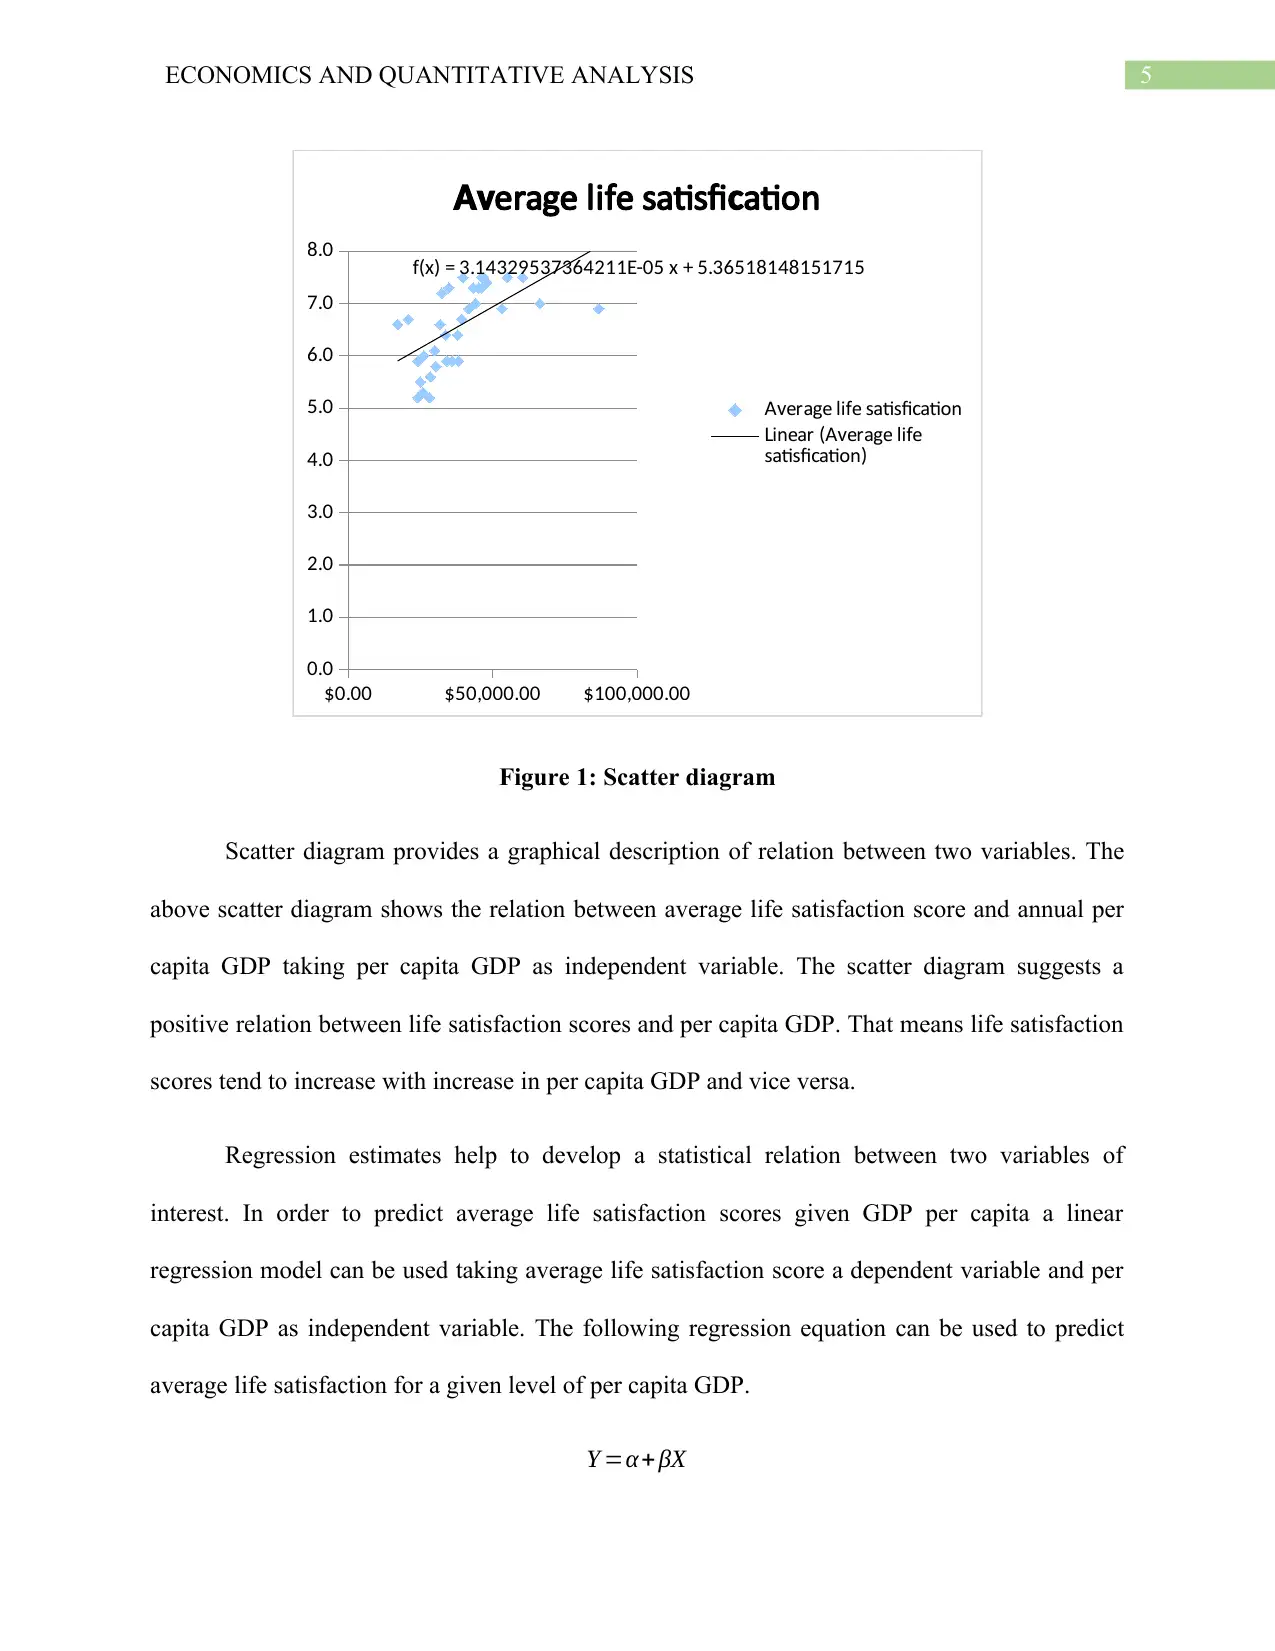
Figure 1: Scatter diagram
Scatter diagram provides a graphical description of relation between two variables. The
above scatter diagram shows the relation between average life satisfaction score and annual per
capita GDP taking per capita GDP as independent variable. The scatter diagram suggests a
positive relation between life satisfaction scores and per capita GDP. That means life satisfaction
scores tend to increase with increase in per capita GDP and vice versa.
Regression estimates help to develop a statistical relation between two variables of
interest. In order to predict average life satisfaction scores given GDP per capita a linear
regression model can be used taking average life satisfaction score a dependent variable and per
capita GDP as independent variable. The following regression equation can be used to predict
average life satisfaction for a given level of per capita GDP.
Y =α+ βX
$0.00 $50,000.00 $100,000.00
0.0
1.0
2.0
3.0
4.0
5.0
6.0
7.0
8.0 f(x) = 3.14329537364211E-05 x + 5.36518148151715
erage life satisfi ationAv c
erage life satisfi ationAv c
inear erage lifeL (Av
satisfi ationc )
Figure 1: Scatter diagram
Scatter diagram provides a graphical description of relation between two variables. The
above scatter diagram shows the relation between average life satisfaction score and annual per
capita GDP taking per capita GDP as independent variable. The scatter diagram suggests a
positive relation between life satisfaction scores and per capita GDP. That means life satisfaction
scores tend to increase with increase in per capita GDP and vice versa.
Regression estimates help to develop a statistical relation between two variables of
interest. In order to predict average life satisfaction scores given GDP per capita a linear
regression model can be used taking average life satisfaction score a dependent variable and per
capita GDP as independent variable. The following regression equation can be used to predict
average life satisfaction for a given level of per capita GDP.
Y =α+ βX
⊘ This is a preview!⊘
Do you want full access?
Subscribe today to unlock all pages.
Trusted by 1+ million students worldwide
6ECONOMICS AND QUANTITATIVE ANALYSIS
Y: Dependent variable: average life satisfaction score
X: Independent variable: GDP per capita
α: Intercept term
β: Slope coefficient
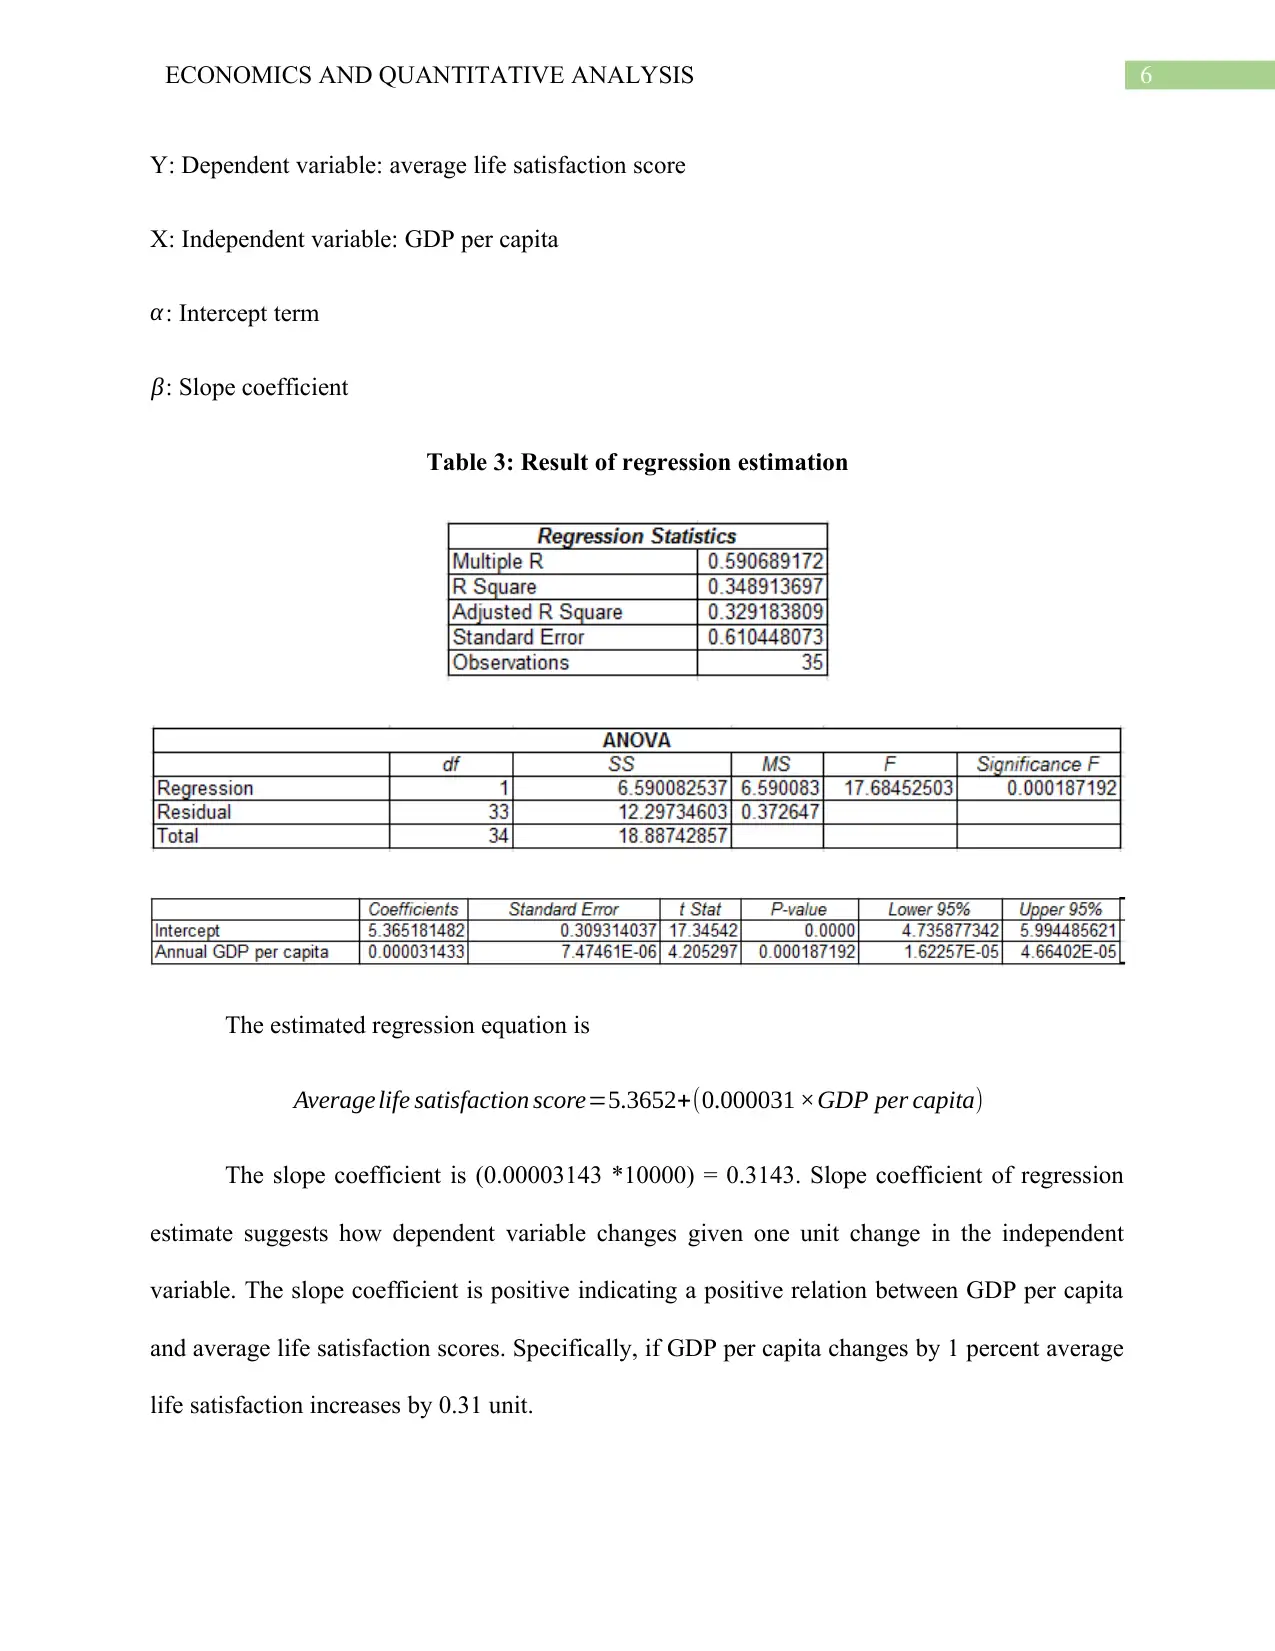
Table 3: Result of regression estimation
The estimated regression equation is
Average life satisfaction score=5.3652+(0.000031 ×GDP per capita)
The slope coefficient is (0.00003143 *10000) = 0.3143. Slope coefficient of regression
estimate suggests how dependent variable changes given one unit change in the independent
variable. The slope coefficient is positive indicating a positive relation between GDP per capita
and average life satisfaction scores. Specifically, if GDP per capita changes by 1 percent average
life satisfaction increases by 0.31 unit.
Y: Dependent variable: average life satisfaction score
X: Independent variable: GDP per capita
α: Intercept term
β: Slope coefficient
Table 3: Result of regression estimation
The estimated regression equation is
Average life satisfaction score=5.3652+(0.000031 ×GDP per capita)
The slope coefficient is (0.00003143 *10000) = 0.3143. Slope coefficient of regression
estimate suggests how dependent variable changes given one unit change in the independent
variable. The slope coefficient is positive indicating a positive relation between GDP per capita
and average life satisfaction scores. Specifically, if GDP per capita changes by 1 percent average
life satisfaction increases by 0.31 unit.
Paraphrase This Document
Need a fresh take? Get an instant paraphrase of this document with our AI Paraphraser
7ECONOMICS AND QUANTITATIVE ANALYSIS
The regression estimate suggests that average life satisfaction has a positive relation with
annual GDP per capita. The associated p value for per capita GDP is 0.0002. Since the p value is
smaller than chosen significance level at 5%, the null hypothesis of no significant relation
between per capita GDP and average life satisfaction has been rejected implying that there exists
a statistically significant association between GDP per capita and average life satisfaction.
Therefore, with increase in per capita GDP there will be a significant increase in average life
satisfaction.
The obtained R square value of the regression model is 0.35. This implies per capita GDP
explains only 35 percent variation in the recorded average life satisfaction scores. Since most of
the variation in life satisfaction score remains unexplained by the explanatory variable (per
capita GDP) the model fitness is not very good (Yang et al. 2016, pp.156-167).
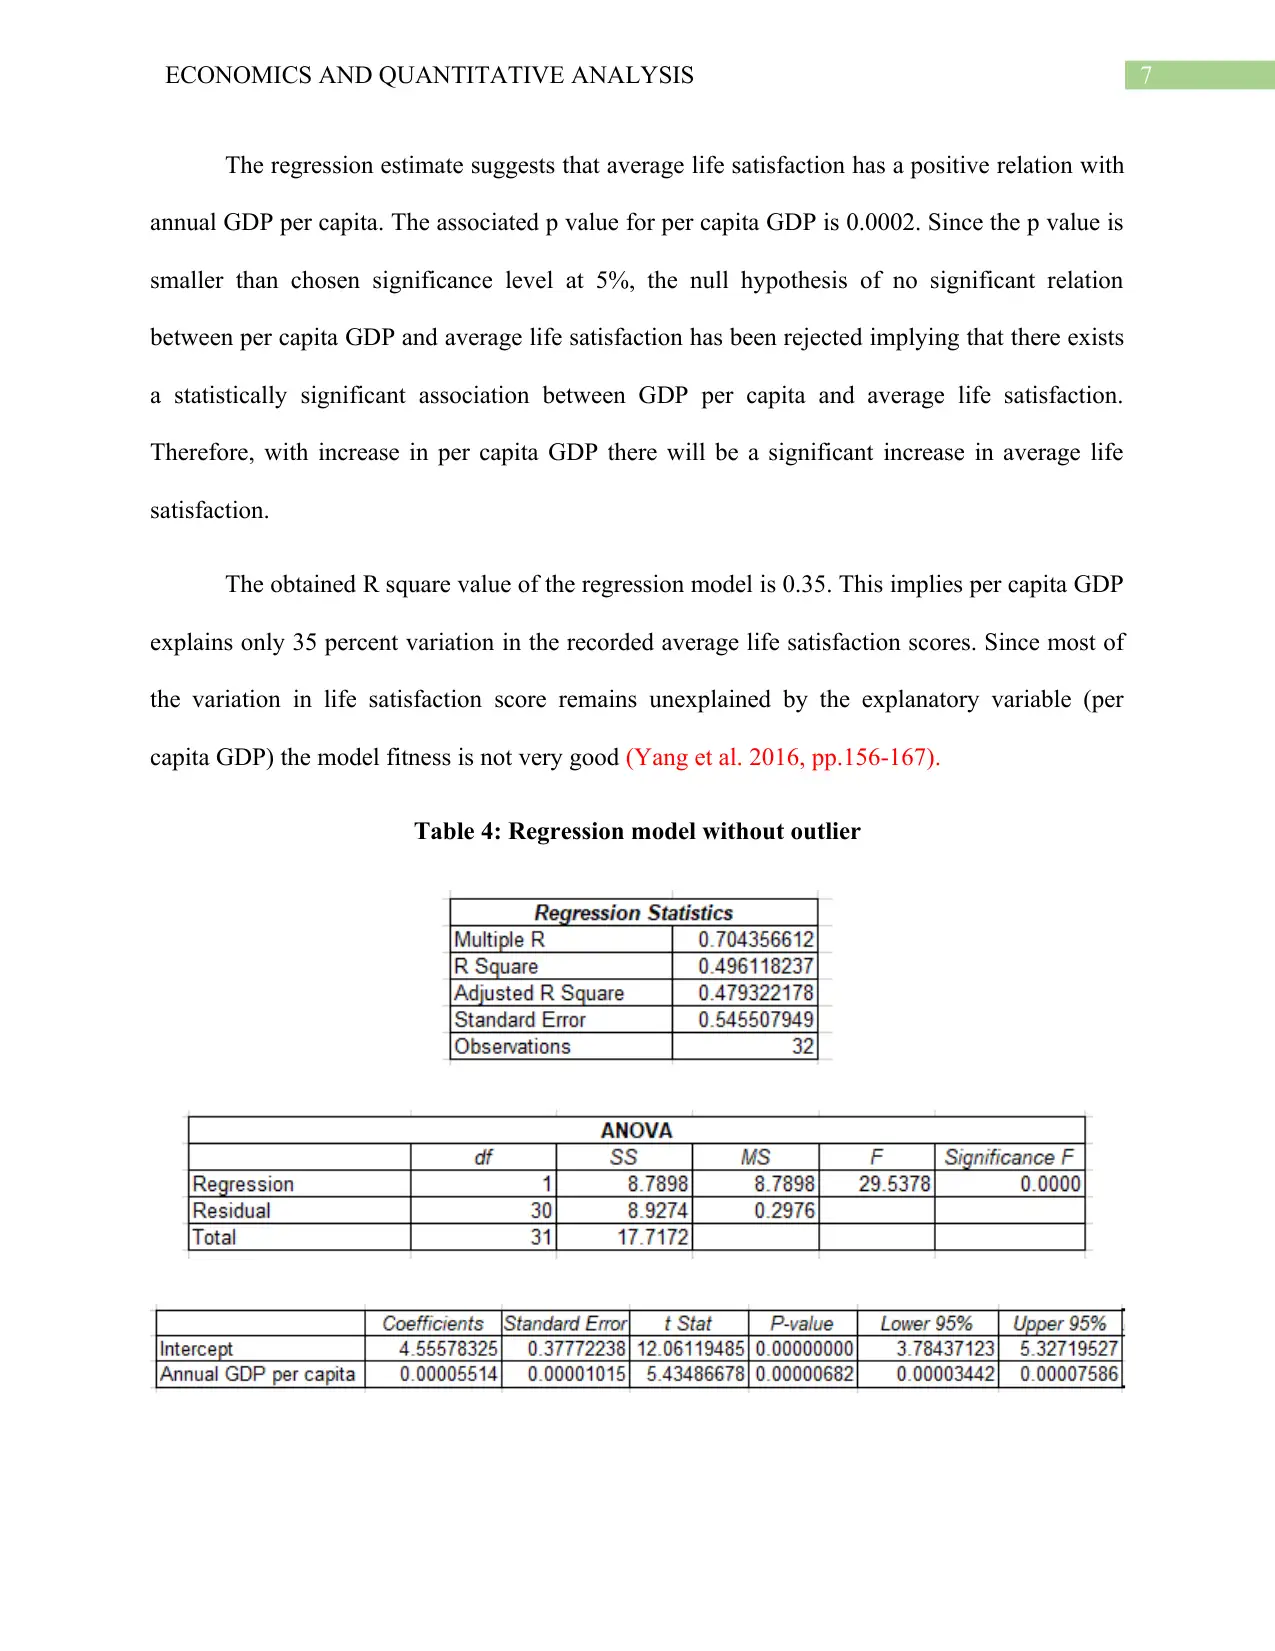
Table 4: Regression model without outlier
The regression estimate suggests that average life satisfaction has a positive relation with
annual GDP per capita. The associated p value for per capita GDP is 0.0002. Since the p value is
smaller than chosen significance level at 5%, the null hypothesis of no significant relation
between per capita GDP and average life satisfaction has been rejected implying that there exists
a statistically significant association between GDP per capita and average life satisfaction.
Therefore, with increase in per capita GDP there will be a significant increase in average life
satisfaction.
The obtained R square value of the regression model is 0.35. This implies per capita GDP
explains only 35 percent variation in the recorded average life satisfaction scores. Since most of
the variation in life satisfaction score remains unexplained by the explanatory variable (per
capita GDP) the model fitness is not very good (Yang et al. 2016, pp.156-167).
Table 4: Regression model without outlier
8ECONOMICS AND QUANTITATIVE ANALYSIS
After dropping the outliers in terms of GDP per capita the value of slope coefficient
increases to 0.5514 from the earlier value of 0.3143. This indicates the relatively stronger impact
of GDP per capita on average life satisfaction. The slope coefficient is statistically significant
similar to the previous model. The R square value of the new model is 0.50 which is higher than
the first model. Per capita GDP now accounts for 50 percent variation in life satisfaction scores
suggesting a better fit model (Papageorgiou, Bouboulis and Theodoridis 2015, pp.3872-3887).
Discussion
The analysis of average life satisfaction score and per capita GDP shows that average life
satisfaction gets positively influenced by the per capita GDP. That means countries with higher
per capita GDP tends to have higher average life satisfaction and vice versa.
The paper adapts quantitative data analysis technique which enables generalization of the
result obtained from sample data for the study group of population. The obtained positive
association between income and average life satisfaction score thus suggests people living in
countries with a higher income are more satisfied with their living (McCusker and Gunaydin
2015, pp.537-542). The study is limited in the sense that it takes per capita GDP as the only
determinant factor of life satisfaction. There are different other factors that have significant
influence on life satisfaction.
Finding from the analysis supports findings of previous research papers that expressed an
affirmative relation between income and life satisfaction and therefore has important policy
implication (Wolbring, Keuschnigg and Negele 2013, pp.86-104). It clearly indicates policies to
increase per capita GDP not only help to boost economic growth of a nation but also make
people happier.
⊘ This is a preview!⊘
Do you want full access?
Subscribe today to unlock all pages.
Trusted by 1+ million students worldwide
9ECONOMICS AND QUANTITATIVE ANALYSIS
Recommendation
Higher per capita GDP tends to increase average life satisfaction of people. Measures
therefore should be taken to enhance per capita GDP. Given below are some recommendation to
increase life satisfaction of average people living in a nation.
First, government should take policies that help will help to increase GDP of the nation. One way
to increase GDP is to encourage innovation. When countries employ more innovative techniques
of production productivity increases resulting in a high aggregate output or GDP.
Second, another way to increase per capita GDP is to reduce pressure of population growth.
Lower the population greater is the share of average people in the aggregate output. Measures
therefore should be taken to check population growth.
Third, life satisfaction does not only depend on average income but also depends on factors such
as personality, self-esteem, seasonal effects, culture and others. These factors should not be
ignored while attempting to improve life satisfaction.
Paraphrase This Document
Need a fresh take? Get an instant paraphrase of this document with our AI Paraphraser
10ECONOMICS AND QUANTITATIVE ANALYSIS
References
Antwi, S.K. and Hamza, K., 2015. Qualitative and quantitative research paradigms in business
research: A philosophical reflection. European journal of business and management, 7(3),
pp.217-225.
https://www.researchgate.net/profile/Hamza_Kasim2/publication/
295087782_Qualitative_and_Quantitative_Research_Paradigms_in_Business_Research_A_Phil
osophical_Reflection/links/56c7587108ae5488f0d2cd62.pdf
Diener, E., Inglehart, R. and Tay, L., 2013. Theory and validity of life satisfaction scales. Social
Indicators Research, 112(3), pp.497-527.
http://www.miqols.org/howb/wp-content/uploads/2016/06/Ed-Diener-et-al.-2013-The-Theory-
and-Validity-of-Life-Satisfaction-Scales-SIR.pdf
Diener, E., Oishi, S. and Lucas, R.E., 2015. National accounts of subjective well-
being. American psychologist, 70(3), p.234.
https://www.researchgate.net/profile/Shigehiro_Oishi/publication/
274570810_National_Accounts_of_Subjective_Well-Being/links/
565c9d0808aefe619b2537de.pdf
McCusker, K. and Gunaydin, S., 2015. Research using qualitative, quantitative or mixed
methods and choice based on the research. Perfusion, 30(7), pp.537-542.
http://citeseerx.ist.psu.edu/viewdoc/download?doi=10.1.1.968.2338&rep=rep1&type=pdf
Papageorgiou, G., Bouboulis, P. and Theodoridis, S., 2015. Robust linear regression analysis—a
greedy approach. IEEE Transactions on Signal Processing, 63(15), pp.3872-3887.
11ECONOMICS AND QUANTITATIVE ANALYSIS
https://arxiv.org/pdf/1409.4279.pdf
Stevenson, B. and Wolfers, J., 2013. Subjective well-being and income: Is there any evidence of
satiation?. American Economic Review, 103(3), pp.598-604.
https://www.nber.org/papers/w18992.pdf
Wolbring, T., Keuschnigg, M. and Negele, E., 2013. Needs, comparisons, and adaptation: The
importance of relative income for life satisfaction. European Sociological Review, 29(1), pp.86-
104.
https://academic.oup.com/esr/article/29/1/86/530018?
casa_token=5YpLXkrLYoEAAAAA:uhtQkM9FsQPqjxYBX-
IIby6pJdSKmOuqQjV6ufKs8GYMeqkNTO409BKzkd8nUhOCpAEfBndCnUmTUCw
Yang, L., Liu, S., Tsoka, S. and Papageorgiou, L.G., 2016. Mathematical programming for
piecewise linear regression analysis. Expert systems with applications, 44, pp.156-167.
https://discovery.ucl.ac.uk/id/eprint/1491836/1/Papageorgiou_ESWA.pdf
⊘ This is a preview!⊘
Do you want full access?
Subscribe today to unlock all pages.
Trusted by 1+ million students worldwide
1 out of 12
Related Documents


Your All-in-One AI-Powered Toolkit for Academic Success.
+13062052269
info@desklib.com
Available 24*7 on WhatsApp / Email
![[object Object]](/_next/static/media/star-bottom.7253800d.svg)
Unlock your academic potential
Copyright © 2020–2026 A2Z Services. All Rights Reserved. Developed and managed by ZUCOL.