Statistical Report: Reliability, Regression, and Moderation Analysis
VerifiedAdded on 2022/08/24
|22
|5215
|17
Report
AI Summary
This report presents a statistical analysis of several psychological constructs. The analysis begins with reliability tests using Cronbach's alpha to assess the internal consistency of variables related to skills, emotions, participation, and academic performance. High alpha coefficients across the board indicate excellent internal consistency, suggesting that the questionnaire items measure the same underlying concepts consistently. The report then moves on to regression analyses, examining the relationships between various factors and outcomes such as academic performance and word of mouth. Several models are tested, incorporating variables like skills, participation, and emotions, and exploring moderation effects of age, gender, and network size. The findings reveal that participation consistently emerges as a significant predictor, while the influence of emotions and skills varies depending on the model and moderating variables. The report highlights the importance of considering moderating variables in understanding complex relationships between variables.
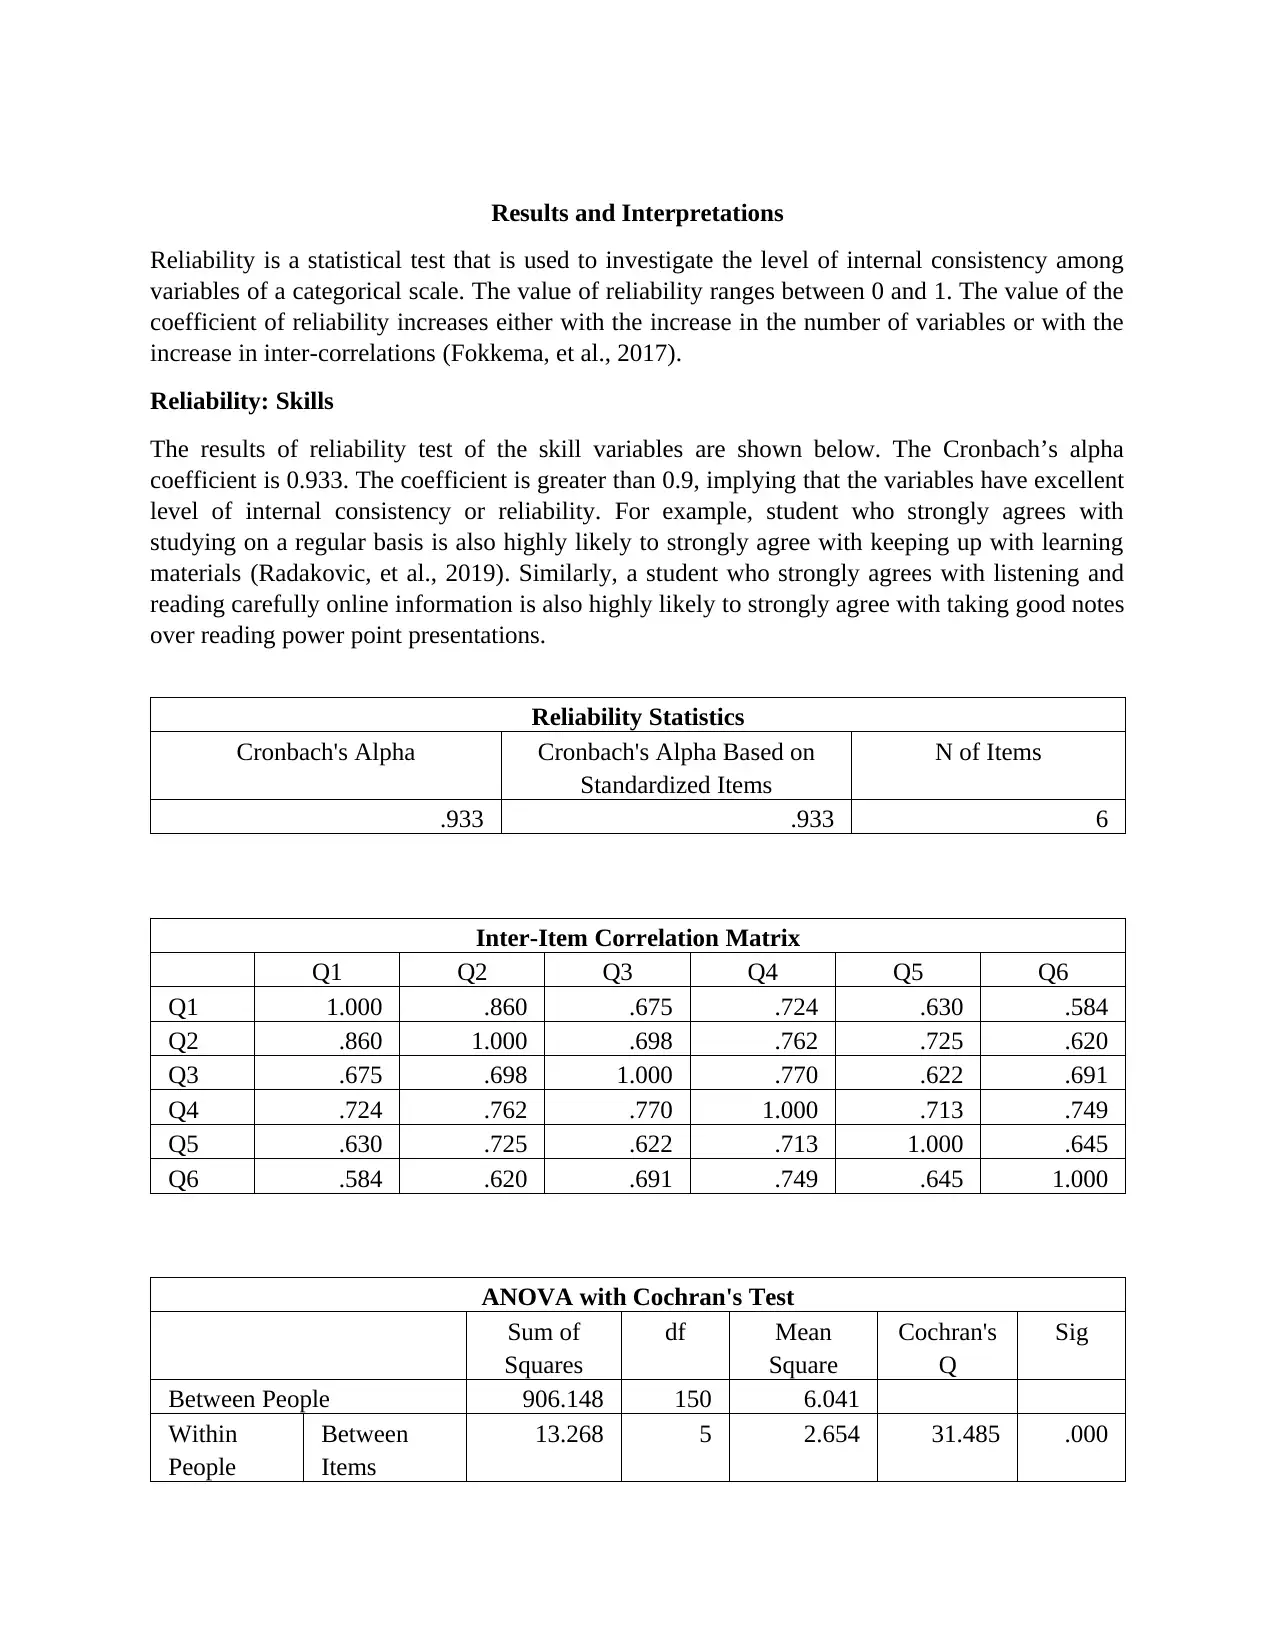
Results and Interpretations
Reliability is a statistical test that is used to investigate the level of internal consistency among
variables of a categorical scale. The value of reliability ranges between 0 and 1. The value of the
coefficient of reliability increases either with the increase in the number of variables or with the
increase in inter-correlations (Fokkema, et al., 2017).
Reliability: Skills
The results of reliability test of the skill variables are shown below. The Cronbach’s alpha
coefficient is 0.933. The coefficient is greater than 0.9, implying that the variables have excellent
level of internal consistency or reliability. For example, student who strongly agrees with
studying on a regular basis is also highly likely to strongly agree with keeping up with learning
materials (Radakovic, et al., 2019). Similarly, a student who strongly agrees with listening and
reading carefully online information is also highly likely to strongly agree with taking good notes
over reading power point presentations.
Reliability Statistics
Cronbach's Alpha Cronbach's Alpha Based on
Standardized Items
N of Items
.933 .933 6
Inter-Item Correlation Matrix
Q1 Q2 Q3 Q4 Q5 Q6
Q1 1.000 .860 .675 .724 .630 .584
Q2 .860 1.000 .698 .762 .725 .620
Q3 .675 .698 1.000 .770 .622 .691
Q4 .724 .762 .770 1.000 .713 .749
Q5 .630 .725 .622 .713 1.000 .645
Q6 .584 .620 .691 .749 .645 1.000
ANOVA with Cochran's Test
Sum of
Squares
df Mean
Square
Cochran's
Q
Sig
Between People 906.148 150 6.041
Within
People
Between
Items
13.268 5 2.654 31.485 .000
Paraphrase This Document
Need a fresh take? Get an instant paraphrase of this document with our AI Paraphraser
Residual 304.898 750 .407
Total 318.167 755 .421
Total 1224.315 905 1.353
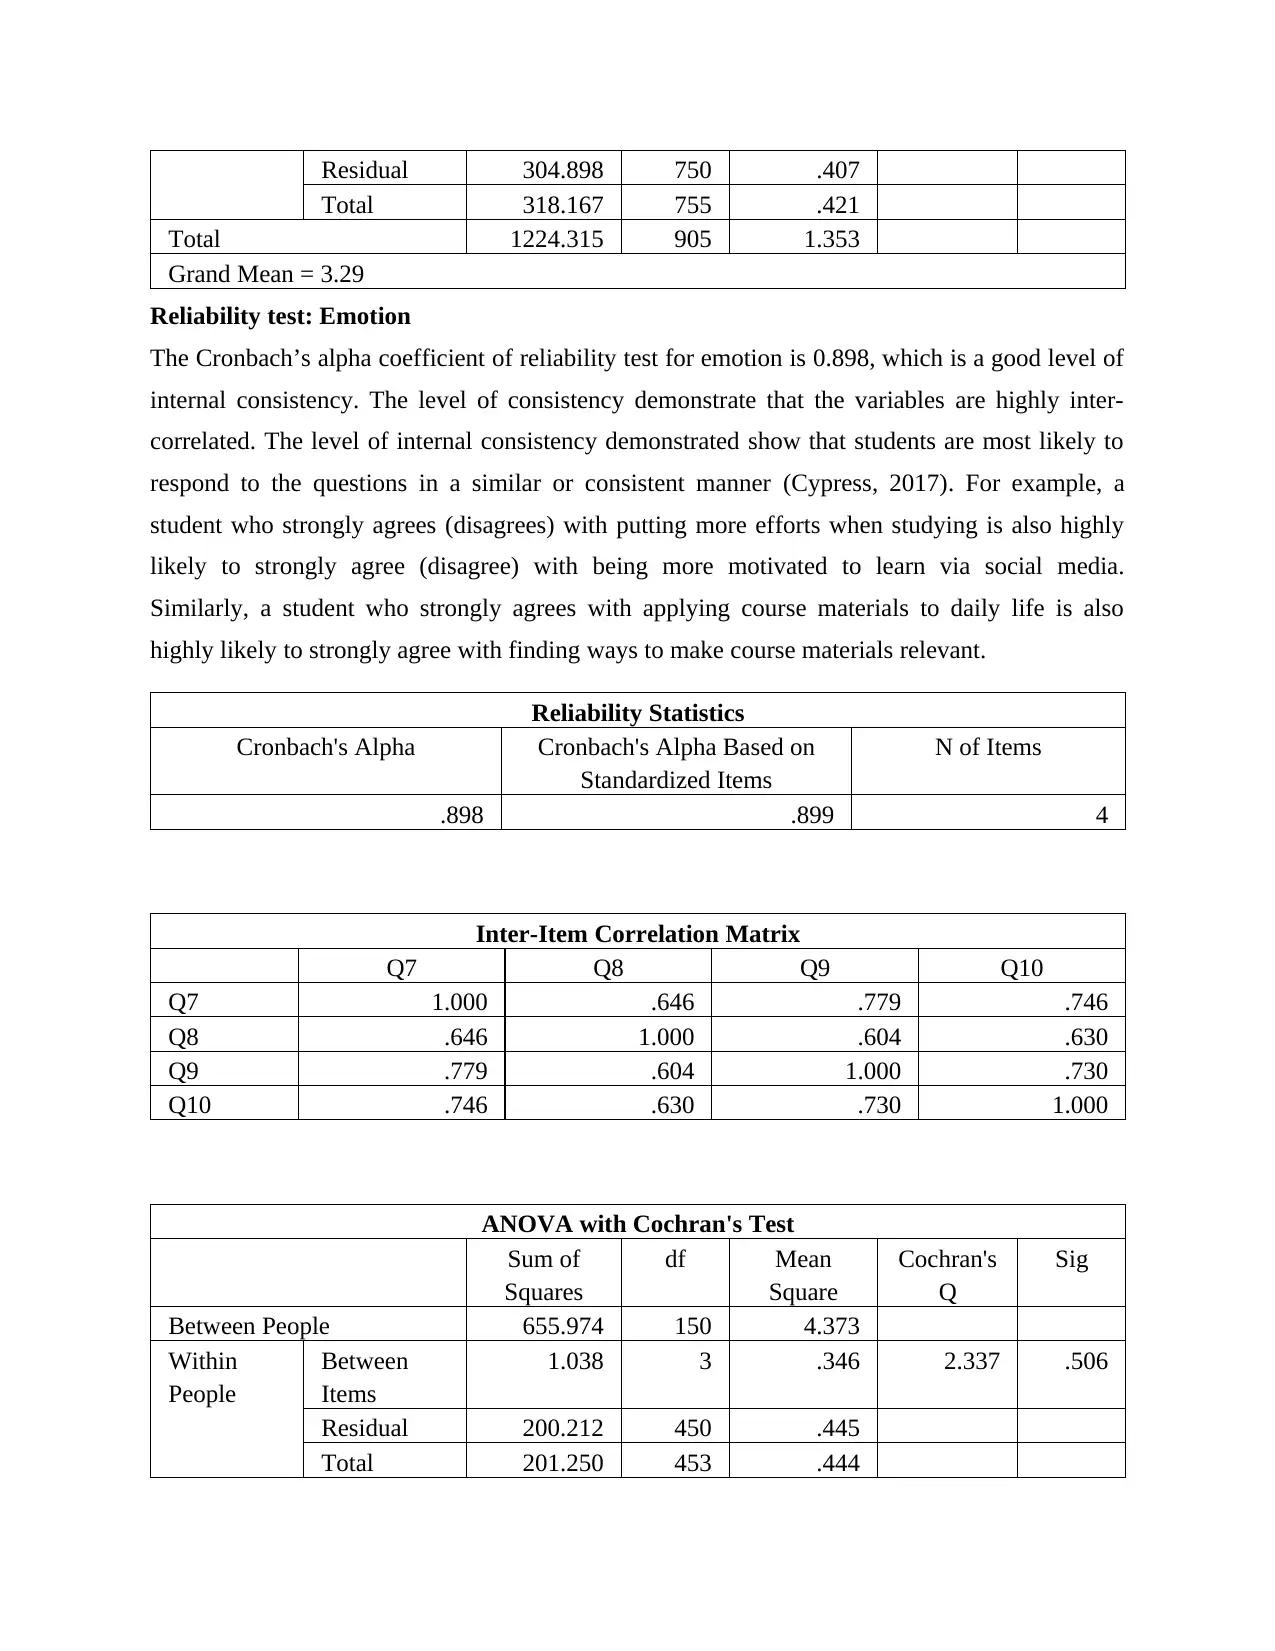
Grand Mean = 3.29
Reliability test: Emotion
The Cronbach’s alpha coefficient of reliability test for emotion is 0.898, which is a good level of
internal consistency. The level of consistency demonstrate that the variables are highly inter-
correlated. The level of internal consistency demonstrated show that students are most likely to
respond to the questions in a similar or consistent manner (Cypress, 2017). For example, a
student who strongly agrees (disagrees) with putting more efforts when studying is also highly
likely to strongly agree (disagree) with being more motivated to learn via social media.
Similarly, a student who strongly agrees with applying course materials to daily life is also
highly likely to strongly agree with finding ways to make course materials relevant.
Reliability Statistics
Cronbach's Alpha Cronbach's Alpha Based on
Standardized Items
N of Items
.898 .899 4
Inter-Item Correlation Matrix
Q7 Q8 Q9 Q10
Q7 1.000 .646 .779 .746
Q8 .646 1.000 .604 .630
Q9 .779 .604 1.000 .730
Q10 .746 .630 .730 1.000
ANOVA with Cochran's Test
Sum of
Squares
df Mean
Square
Cochran's
Q
Sig
Between People 655.974 150 4.373
Within
People
Between
Items
1.038 3 .346 2.337 .506
Residual 200.212 450 .445
Total 201.250 453 .444
Total 318.167 755 .421
Total 1224.315 905 1.353
Grand Mean = 3.29
Reliability test: Emotion
The Cronbach’s alpha coefficient of reliability test for emotion is 0.898, which is a good level of
internal consistency. The level of consistency demonstrate that the variables are highly inter-
correlated. The level of internal consistency demonstrated show that students are most likely to
respond to the questions in a similar or consistent manner (Cypress, 2017). For example, a
student who strongly agrees (disagrees) with putting more efforts when studying is also highly
likely to strongly agree (disagree) with being more motivated to learn via social media.
Similarly, a student who strongly agrees with applying course materials to daily life is also
highly likely to strongly agree with finding ways to make course materials relevant.
Reliability Statistics
Cronbach's Alpha Cronbach's Alpha Based on
Standardized Items
N of Items
.898 .899 4
Inter-Item Correlation Matrix
Q7 Q8 Q9 Q10
Q7 1.000 .646 .779 .746
Q8 .646 1.000 .604 .630
Q9 .779 .604 1.000 .730
Q10 .746 .630 .730 1.000
ANOVA with Cochran's Test
Sum of
Squares
df Mean
Square
Cochran's
Q
Sig
Between People 655.974 150 4.373
Within
People
Between
Items
1.038 3 .346 2.337 .506
Residual 200.212 450 .445
Total 201.250 453 .444
Total 857.224 603 1.422
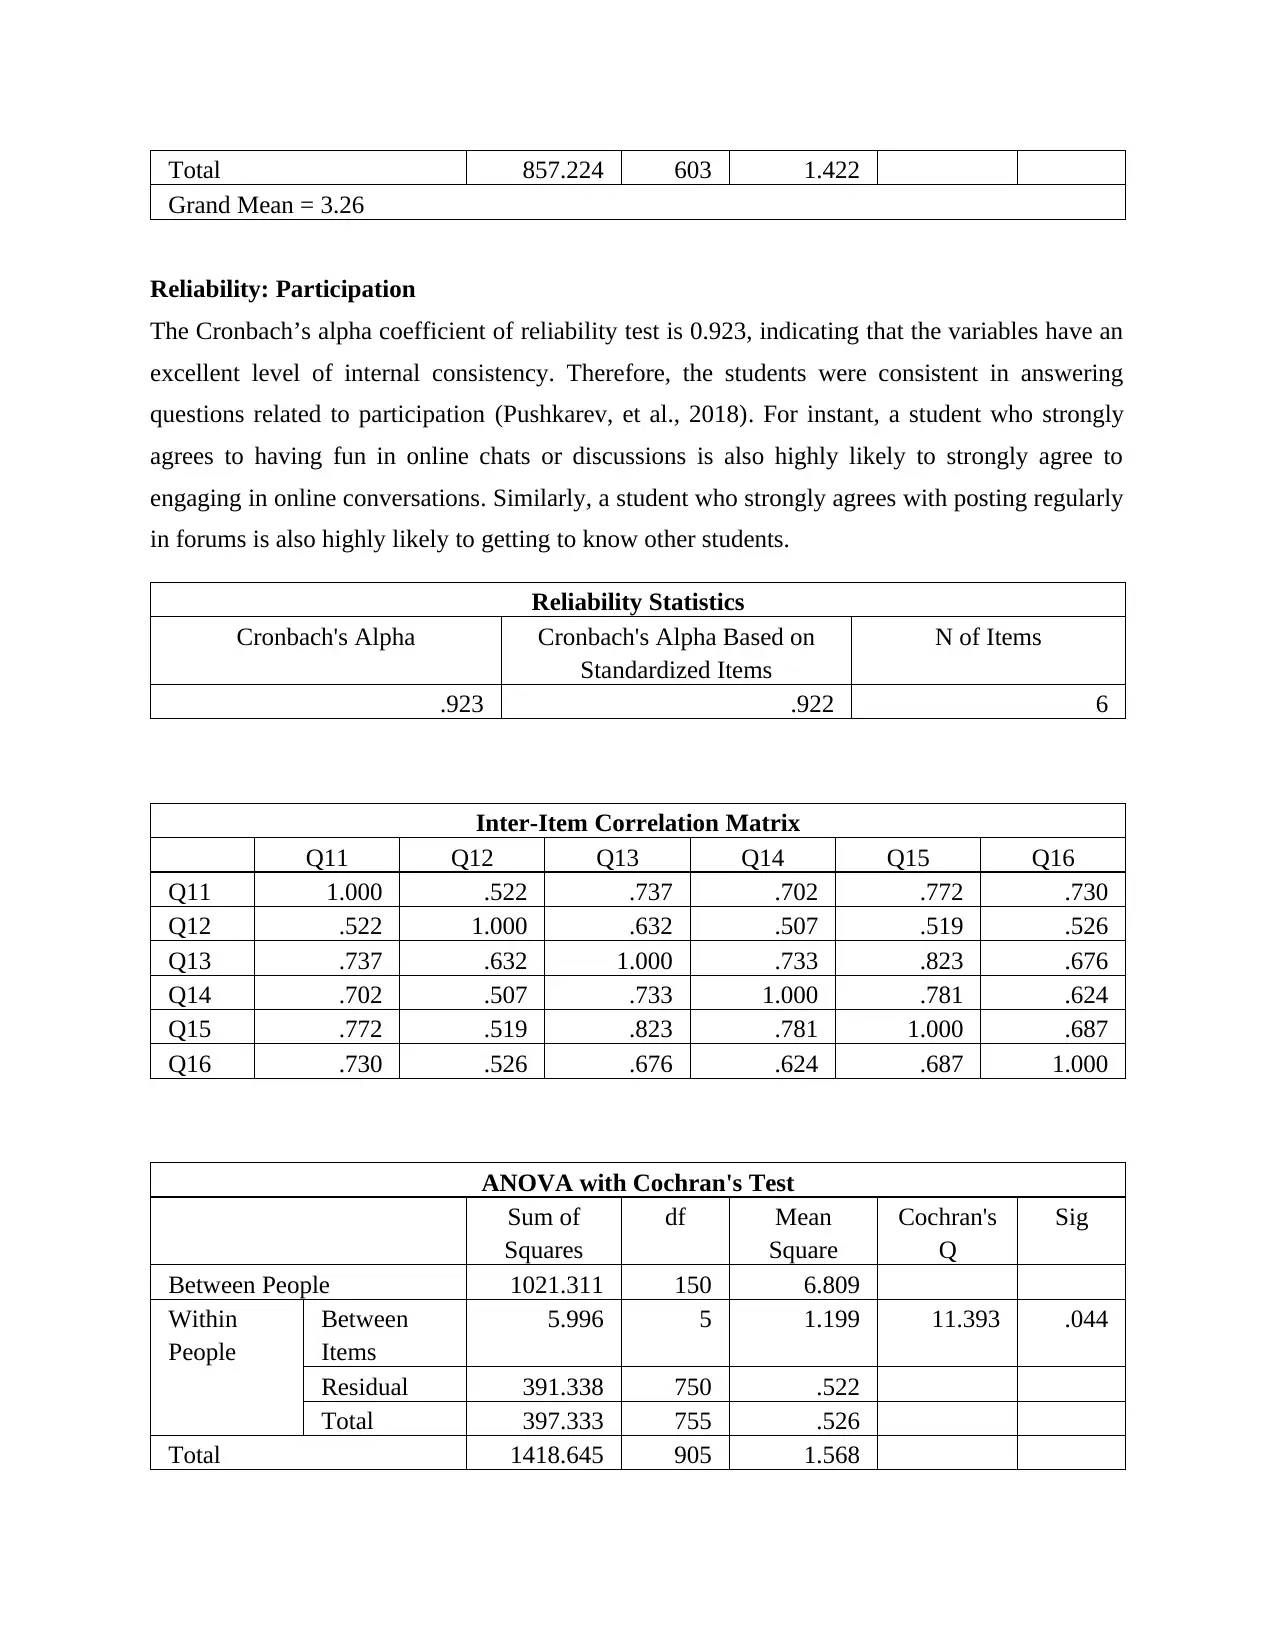
Grand Mean = 3.26
Reliability: Participation
The Cronbach’s alpha coefficient of reliability test is 0.923, indicating that the variables have an
excellent level of internal consistency. Therefore, the students were consistent in answering
questions related to participation (Pushkarev, et al., 2018). For instant, a student who strongly
agrees to having fun in online chats or discussions is also highly likely to strongly agree to
engaging in online conversations. Similarly, a student who strongly agrees with posting regularly
in forums is also highly likely to getting to know other students.
Reliability Statistics
Cronbach's Alpha Cronbach's Alpha Based on
Standardized Items
N of Items
.923 .922 6
Inter-Item Correlation Matrix
Q11 Q12 Q13 Q14 Q15 Q16
Q11 1.000 .522 .737 .702 .772 .730
Q12 .522 1.000 .632 .507 .519 .526
Q13 .737 .632 1.000 .733 .823 .676
Q14 .702 .507 .733 1.000 .781 .624
Q15 .772 .519 .823 .781 1.000 .687
Q16 .730 .526 .676 .624 .687 1.000
ANOVA with Cochran's Test
Sum of
Squares
df Mean
Square
Cochran's
Q
Sig
Between People 1021.311 150 6.809
Within
People
Between
Items
5.996 5 1.199 11.393 .044
Residual 391.338 750 .522
Total 397.333 755 .526
Total 1418.645 905 1.568
⊘ This is a preview!⊘
Do you want full access?
Subscribe today to unlock all pages.
Trusted by 1+ million students worldwide
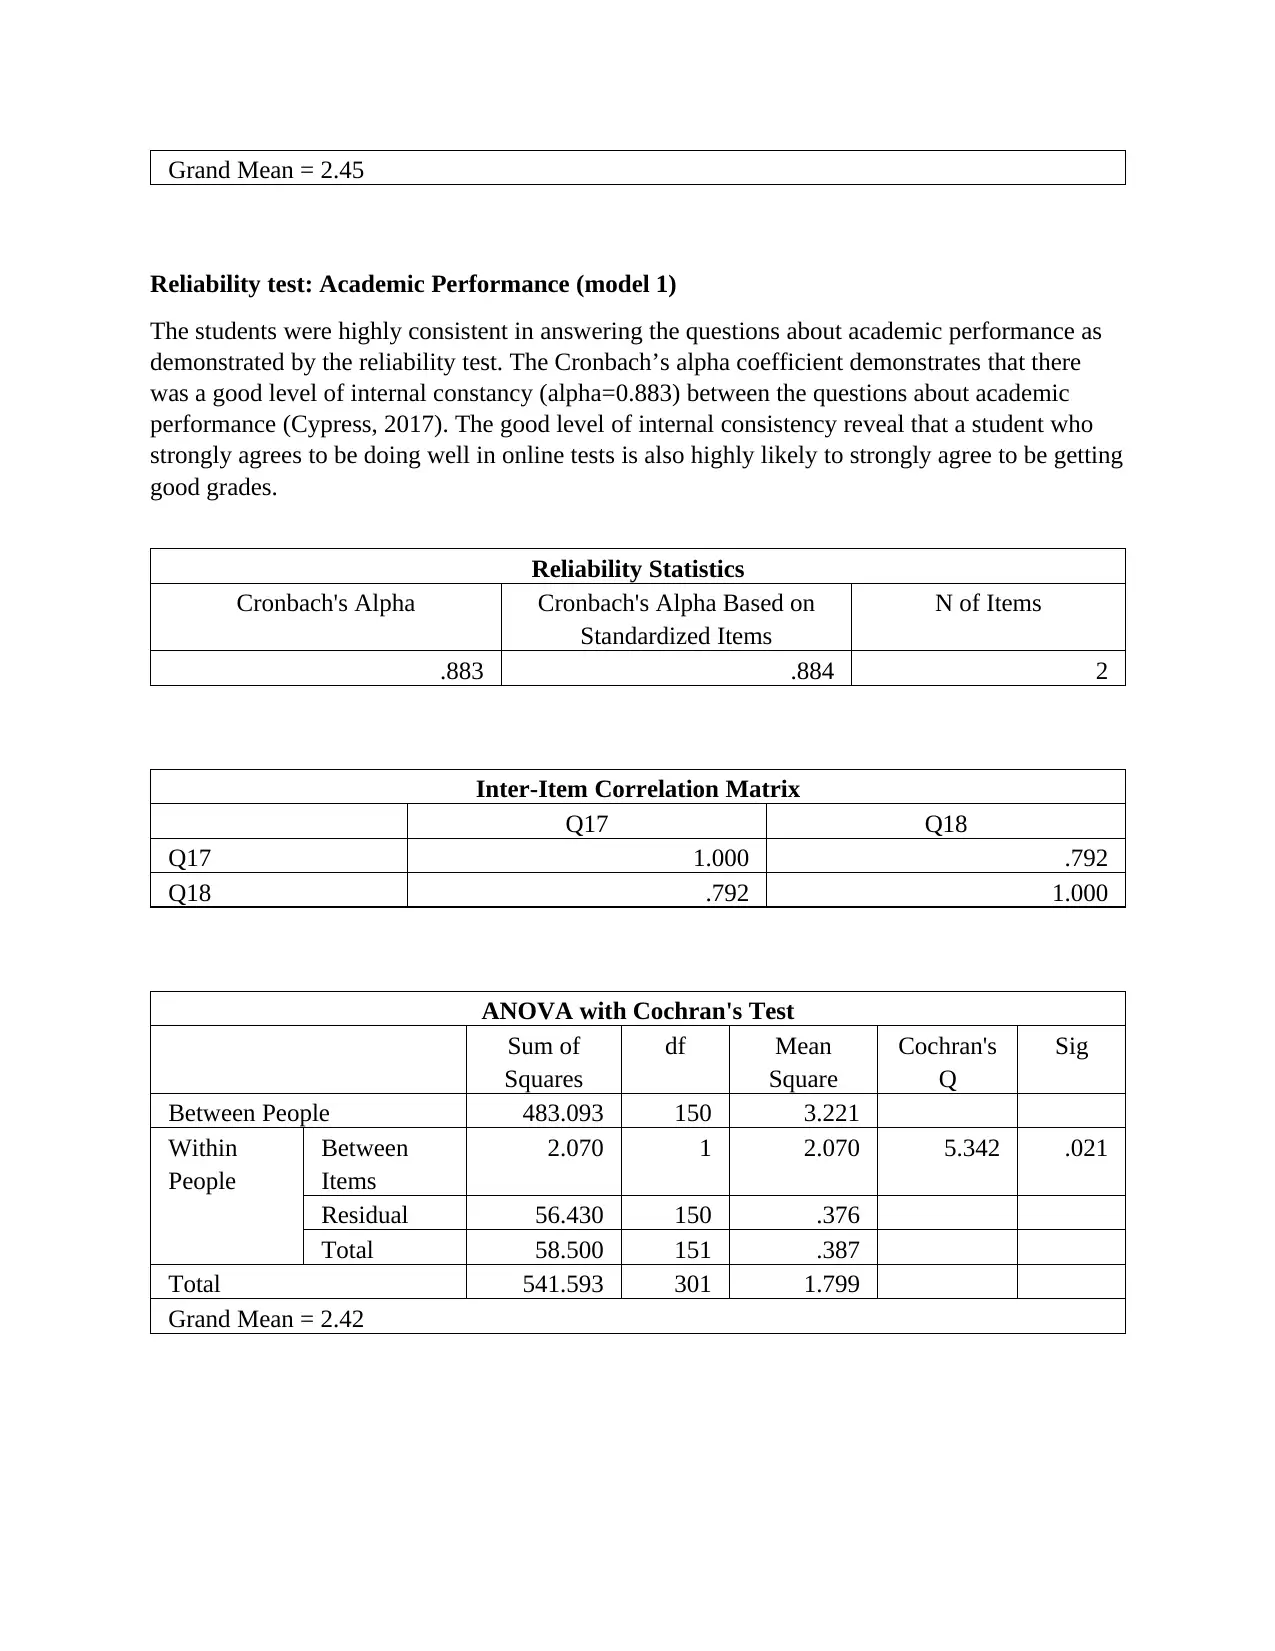
Grand Mean = 2.45
Reliability test: Academic Performance (model 1)
The students were highly consistent in answering the questions about academic performance as
demonstrated by the reliability test. The Cronbach’s alpha coefficient demonstrates that there
was a good level of internal constancy (alpha=0.883) between the questions about academic
performance (Cypress, 2017). The good level of internal consistency reveal that a student who
strongly agrees to be doing well in online tests is also highly likely to strongly agree to be getting
good grades.
Reliability Statistics
Cronbach's Alpha Cronbach's Alpha Based on
Standardized Items
N of Items
.883 .884 2
Inter-Item Correlation Matrix
Q17 Q18
Q17 1.000 .792
Q18 .792 1.000
ANOVA with Cochran's Test
Sum of
Squares
df Mean
Square
Cochran's
Q
Sig
Between People 483.093 150 3.221
Within
People
Between
Items
2.070 1 2.070 5.342 .021
Residual 56.430 150 .376
Total 58.500 151 .387
Total 541.593 301 1.799
Grand Mean = 2.42
Paraphrase This Document
Need a fresh take? Get an instant paraphrase of this document with our AI Paraphraser
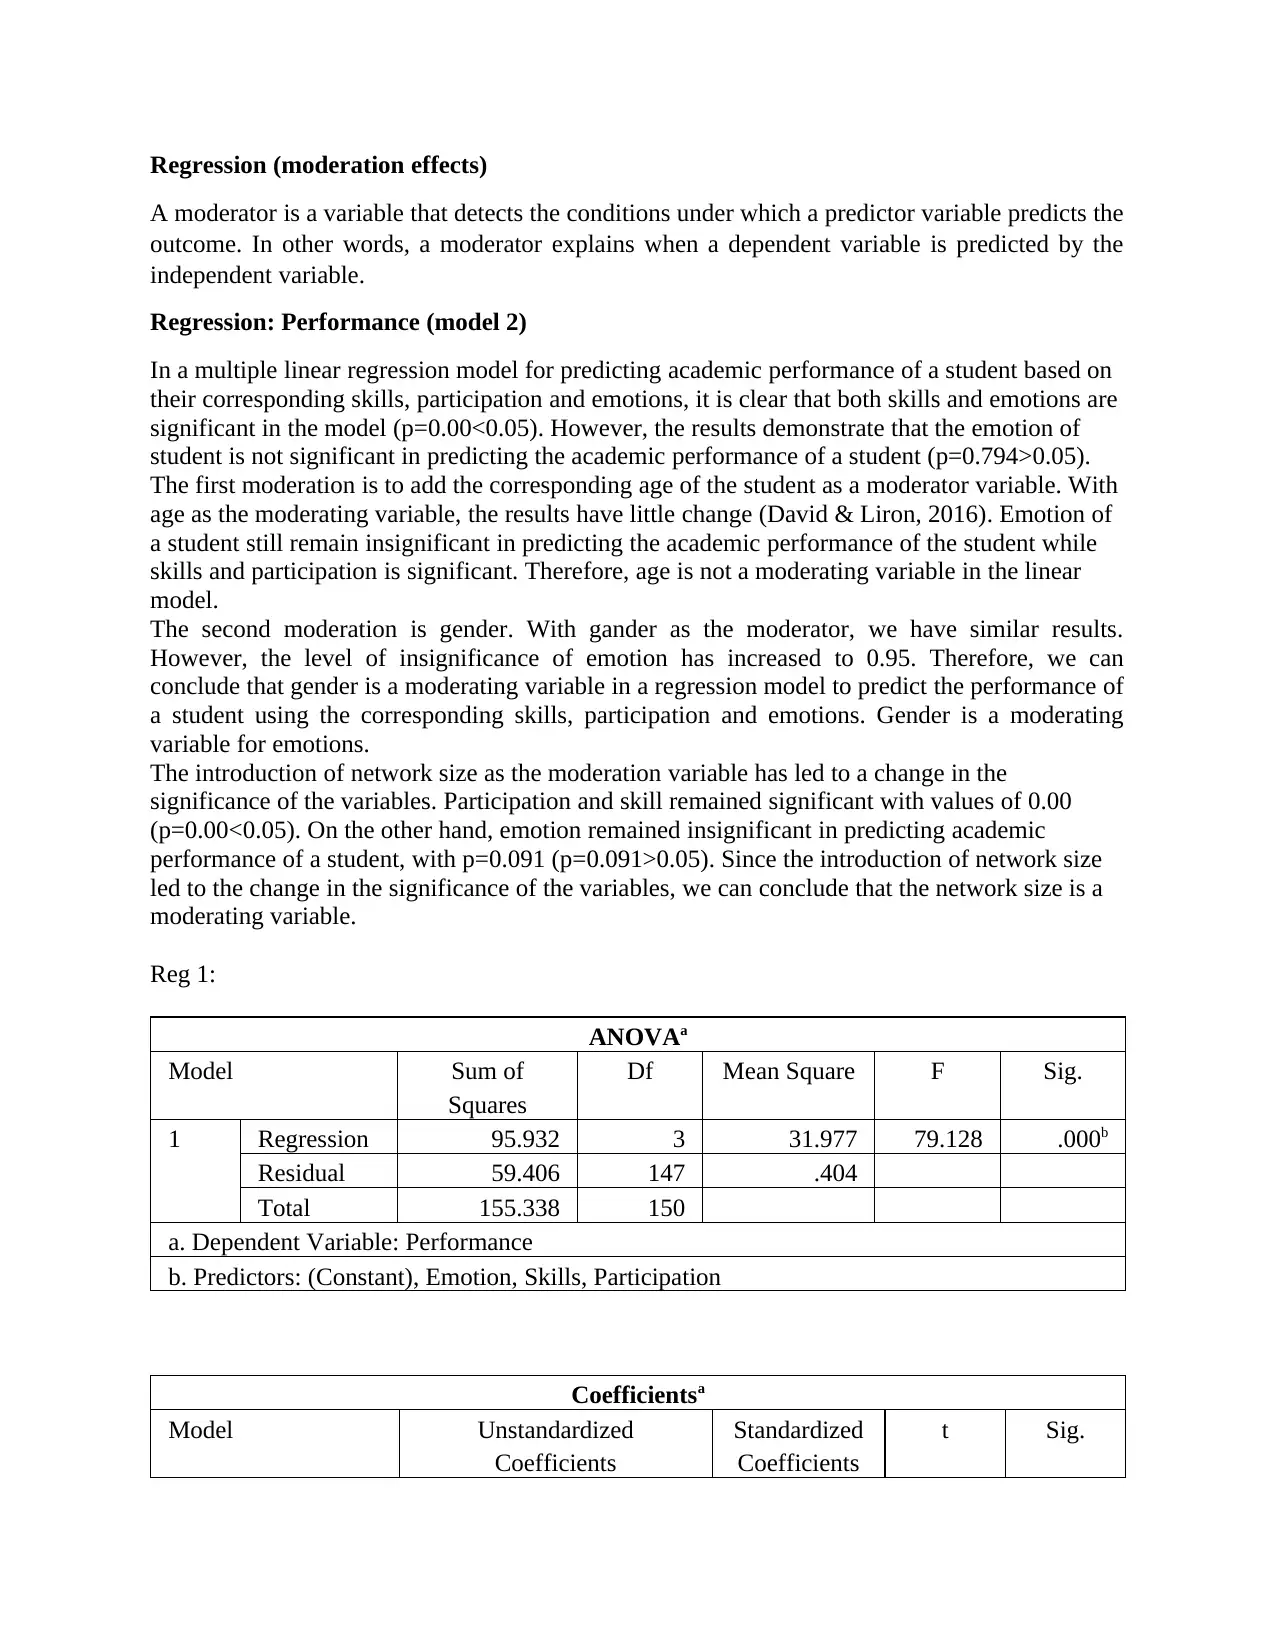
Regression (moderation effects)
A moderator is a variable that detects the conditions under which a predictor variable predicts the
outcome. In other words, a moderator explains when a dependent variable is predicted by the
independent variable.
Regression: Performance (model 2)
In a multiple linear regression model for predicting academic performance of a student based on
their corresponding skills, participation and emotions, it is clear that both skills and emotions are
significant in the model (p=0.00<0.05). However, the results demonstrate that the emotion of
student is not significant in predicting the academic performance of a student (p=0.794>0.05).
The first moderation is to add the corresponding age of the student as a moderator variable. With
age as the moderating variable, the results have little change (David & Liron, 2016). Emotion of
a student still remain insignificant in predicting the academic performance of the student while
skills and participation is significant. Therefore, age is not a moderating variable in the linear
model.
The second moderation is gender. With gander as the moderator, we have similar results.
However, the level of insignificance of emotion has increased to 0.95. Therefore, we can
conclude that gender is a moderating variable in a regression model to predict the performance of
a student using the corresponding skills, participation and emotions. Gender is a moderating
variable for emotions.
The introduction of network size as the moderation variable has led to a change in the
significance of the variables. Participation and skill remained significant with values of 0.00
(p=0.00<0.05). On the other hand, emotion remained insignificant in predicting academic
performance of a student, with p=0.091 (p=0.091>0.05). Since the introduction of network size
led to the change in the significance of the variables, we can conclude that the network size is a
moderating variable.
Reg 1:
ANOVAa
Model Sum of
Squares
Df Mean Square F Sig.
1 Regression 95.932 3 31.977 79.128 .000b
Residual 59.406 147 .404
Total 155.338 150
a. Dependent Variable: Performance
b. Predictors: (Constant), Emotion, Skills, Participation
Coefficientsa
Model Unstandardized
Coefficients
Standardized
Coefficients
t Sig.
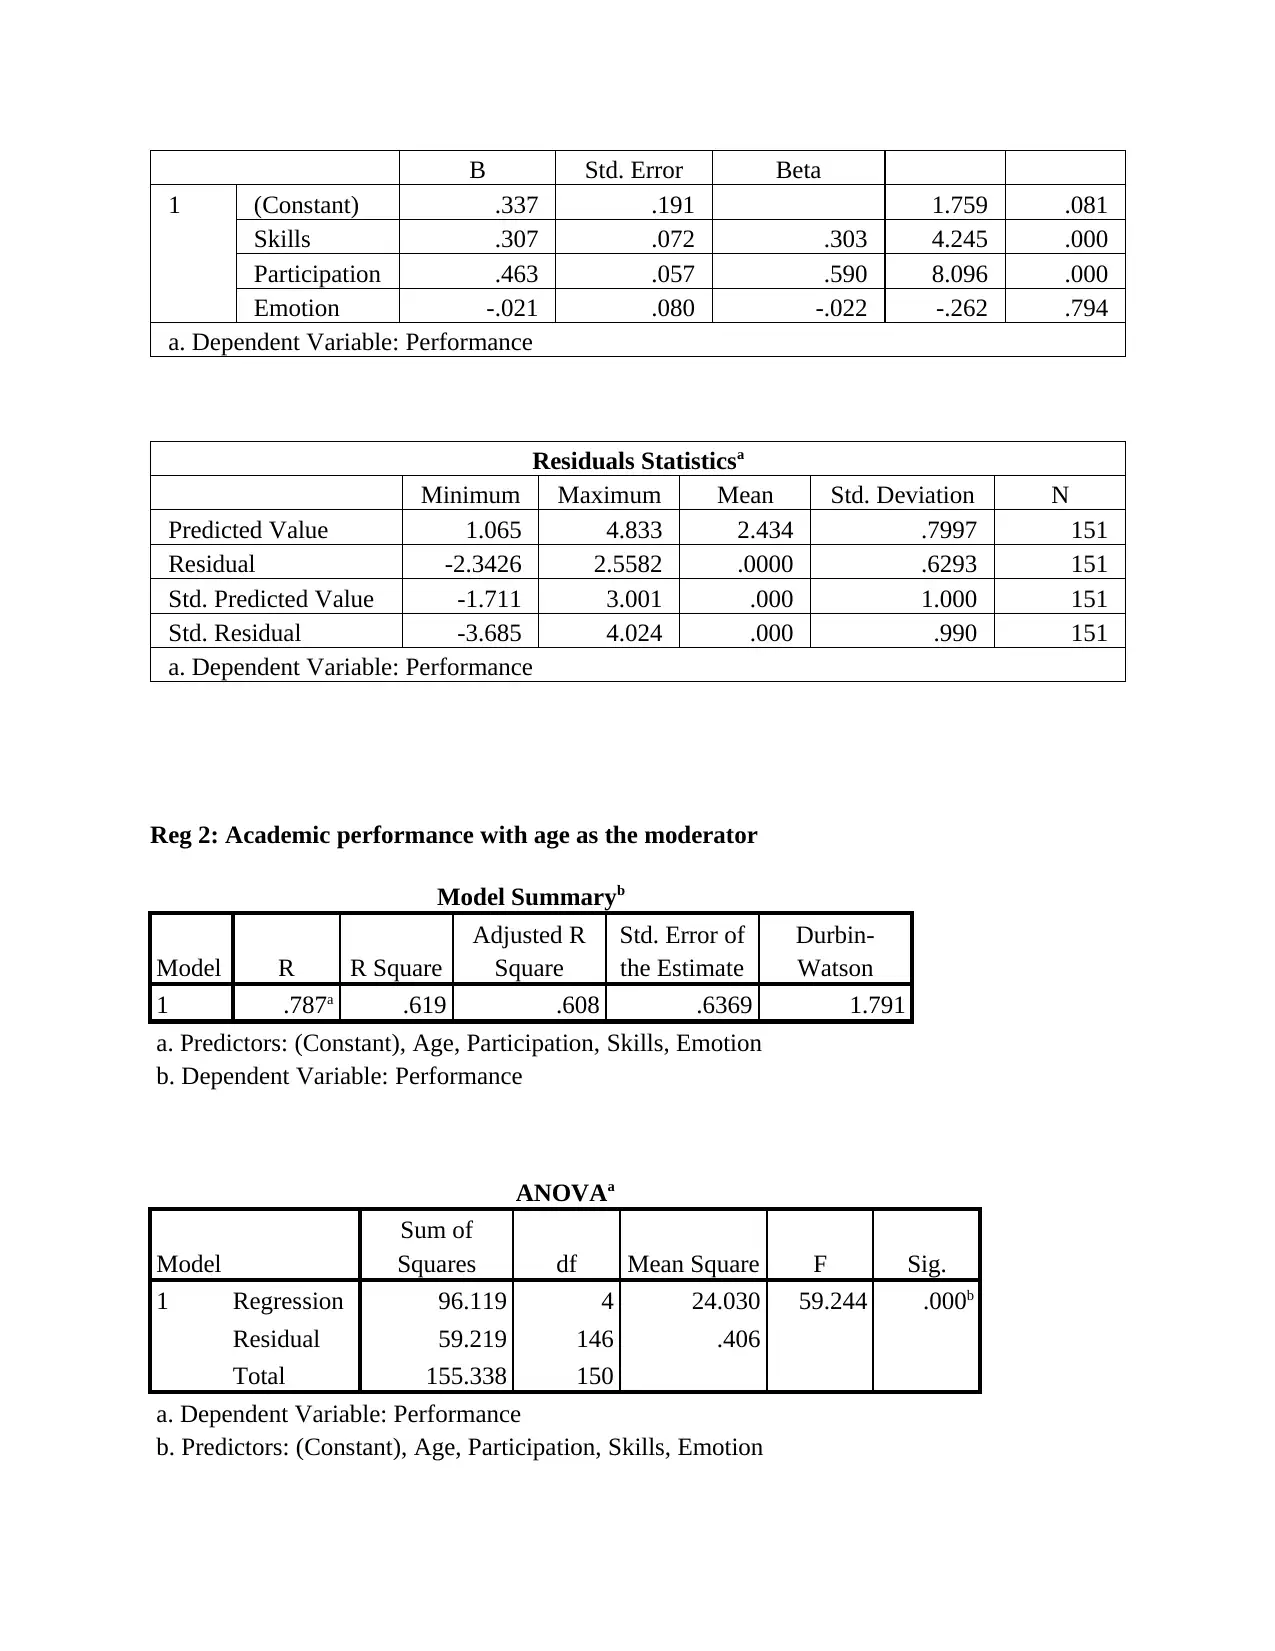
B Std. Error Beta
1 (Constant) .337 .191 1.759 .081
Skills .307 .072 .303 4.245 .000
Participation .463 .057 .590 8.096 .000
Emotion -.021 .080 -.022 -.262 .794
a. Dependent Variable: Performance
Residuals Statisticsa
Minimum Maximum Mean Std. Deviation N
Predicted Value 1.065 4.833 2.434 .7997 151
Residual -2.3426 2.5582 .0000 .6293 151
Std. Predicted Value -1.711 3.001 .000 1.000 151
Std. Residual -3.685 4.024 .000 .990 151
a. Dependent Variable: Performance
Reg 2: Academic performance with age as the moderator
Model Summaryb
Model R R Square
Adjusted R
Square
Std. Error of
the Estimate
Durbin-
Watson
1 .787a .619 .608 .6369 1.791
a. Predictors: (Constant), Age, Participation, Skills, Emotion
b. Dependent Variable: Performance
ANOVAa
Model
Sum of
Squares df Mean Square F Sig.
1 Regression 96.119 4 24.030 59.244 .000b
Residual 59.219 146 .406
Total 155.338 150
a. Dependent Variable: Performance
b. Predictors: (Constant), Age, Participation, Skills, Emotion
⊘ This is a preview!⊘
Do you want full access?
Subscribe today to unlock all pages.
Trusted by 1+ million students worldwide
Coefficientsa
Model
Unstandardized
Coefficients
Standardized
Coefficients
t Sig.B Std. Error Beta
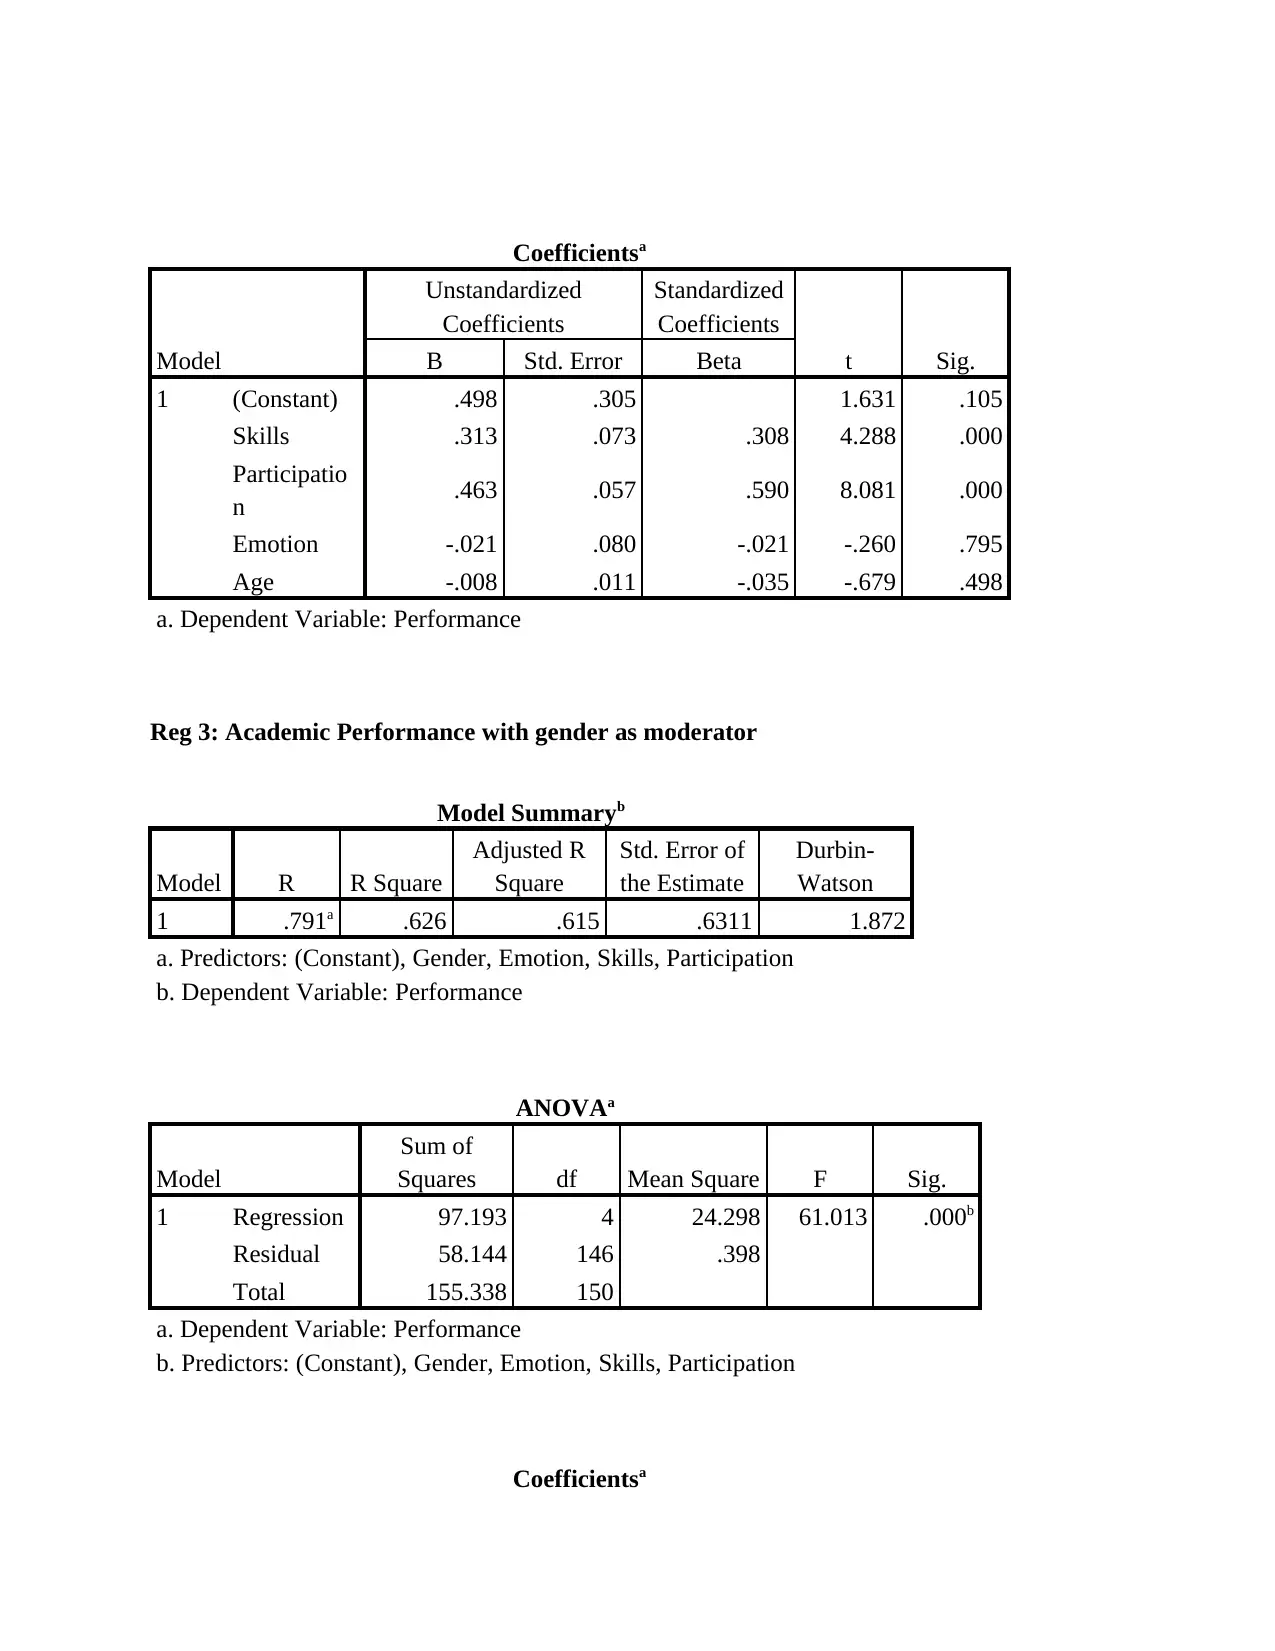
1 (Constant) .498 .305 1.631 .105
Skills .313 .073 .308 4.288 .000
Participatio
n .463 .057 .590 8.081 .000
Emotion -.021 .080 -.021 -.260 .795
Age -.008 .011 -.035 -.679 .498
a. Dependent Variable: Performance
Reg 3: Academic Performance with gender as moderator
Model Summaryb
Model R R Square
Adjusted R
Square
Std. Error of
the Estimate
Durbin-
Watson
1 .791a .626 .615 .6311 1.872
a. Predictors: (Constant), Gender, Emotion, Skills, Participation
b. Dependent Variable: Performance
ANOVAa
Model
Sum of
Squares df Mean Square F Sig.
1 Regression 97.193 4 24.298 61.013 .000b
Residual 58.144 146 .398
Total 155.338 150
a. Dependent Variable: Performance
b. Predictors: (Constant), Gender, Emotion, Skills, Participation
Coefficientsa
Model
Unstandardized
Coefficients
Standardized
Coefficients
t Sig.B Std. Error Beta
1 (Constant) .498 .305 1.631 .105
Skills .313 .073 .308 4.288 .000
Participatio
n .463 .057 .590 8.081 .000
Emotion -.021 .080 -.021 -.260 .795
Age -.008 .011 -.035 -.679 .498
a. Dependent Variable: Performance
Reg 3: Academic Performance with gender as moderator
Model Summaryb
Model R R Square
Adjusted R
Square
Std. Error of
the Estimate
Durbin-
Watson
1 .791a .626 .615 .6311 1.872
a. Predictors: (Constant), Gender, Emotion, Skills, Participation
b. Dependent Variable: Performance
ANOVAa
Model
Sum of
Squares df Mean Square F Sig.
1 Regression 97.193 4 24.298 61.013 .000b
Residual 58.144 146 .398
Total 155.338 150
a. Dependent Variable: Performance
b. Predictors: (Constant), Gender, Emotion, Skills, Participation
Coefficientsa
Paraphrase This Document
Need a fresh take? Get an instant paraphrase of this document with our AI Paraphraser
Model
Unstandardized
Coefficients
Standardized
Coefficients
t Sig.B Std. Error Beta
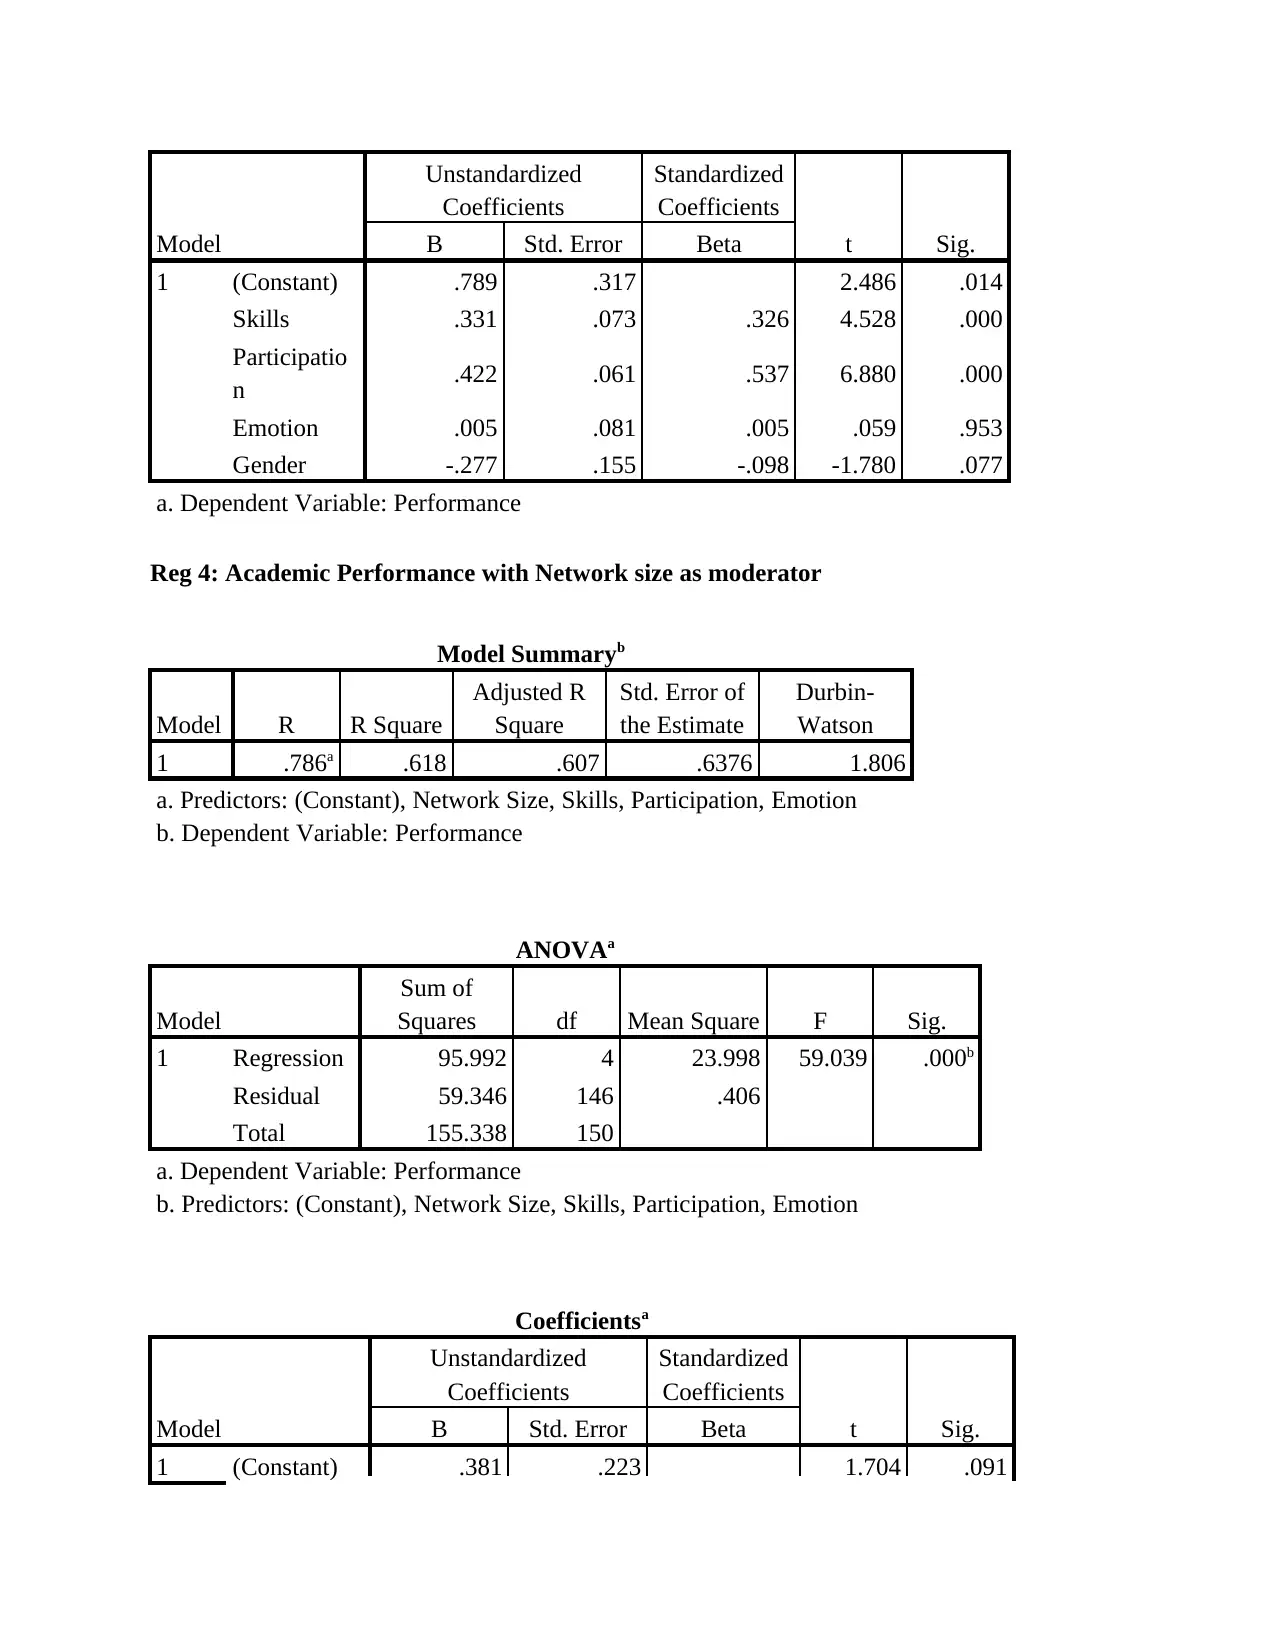
1 (Constant) .789 .317 2.486 .014
Skills .331 .073 .326 4.528 .000
Participatio
n .422 .061 .537 6.880 .000
Emotion .005 .081 .005 .059 .953
Gender -.277 .155 -.098 -1.780 .077
a. Dependent Variable: Performance
Reg 4: Academic Performance with Network size as moderator
Model Summaryb
Model R R Square
Adjusted R
Square
Std. Error of
the Estimate
Durbin-
Watson
1 .786a .618 .607 .6376 1.806
a. Predictors: (Constant), Network Size, Skills, Participation, Emotion
b. Dependent Variable: Performance
ANOVAa
Model
Sum of
Squares df Mean Square F Sig.
1 Regression 95.992 4 23.998 59.039 .000b
Residual 59.346 146 .406
Total 155.338 150
a. Dependent Variable: Performance
b. Predictors: (Constant), Network Size, Skills, Participation, Emotion
Coefficientsa
Model
Unstandardized
Coefficients
Standardized
Coefficients
t Sig.B Std. Error Beta
1 (Constant) .381 .223 1.704 .091
Unstandardized
Coefficients
Standardized
Coefficients
t Sig.B Std. Error Beta
1 (Constant) .789 .317 2.486 .014
Skills .331 .073 .326 4.528 .000
Participatio
n .422 .061 .537 6.880 .000
Emotion .005 .081 .005 .059 .953
Gender -.277 .155 -.098 -1.780 .077
a. Dependent Variable: Performance
Reg 4: Academic Performance with Network size as moderator
Model Summaryb
Model R R Square
Adjusted R
Square
Std. Error of
the Estimate
Durbin-
Watson
1 .786a .618 .607 .6376 1.806
a. Predictors: (Constant), Network Size, Skills, Participation, Emotion
b. Dependent Variable: Performance
ANOVAa
Model
Sum of
Squares df Mean Square F Sig.
1 Regression 95.992 4 23.998 59.039 .000b
Residual 59.346 146 .406
Total 155.338 150
a. Dependent Variable: Performance
b. Predictors: (Constant), Network Size, Skills, Participation, Emotion
Coefficientsa
Model
Unstandardized
Coefficients
Standardized
Coefficients
t Sig.B Std. Error Beta
1 (Constant) .381 .223 1.704 .091
Skills .313 .074 .309 4.221 .000
Participation .462 .057 .588 8.038 .000
Emotion -.026 .081 -.027 -.320 .750
Network
Size -.003 .008 -.020 -.385 .701
a. Dependent Variable: Performance
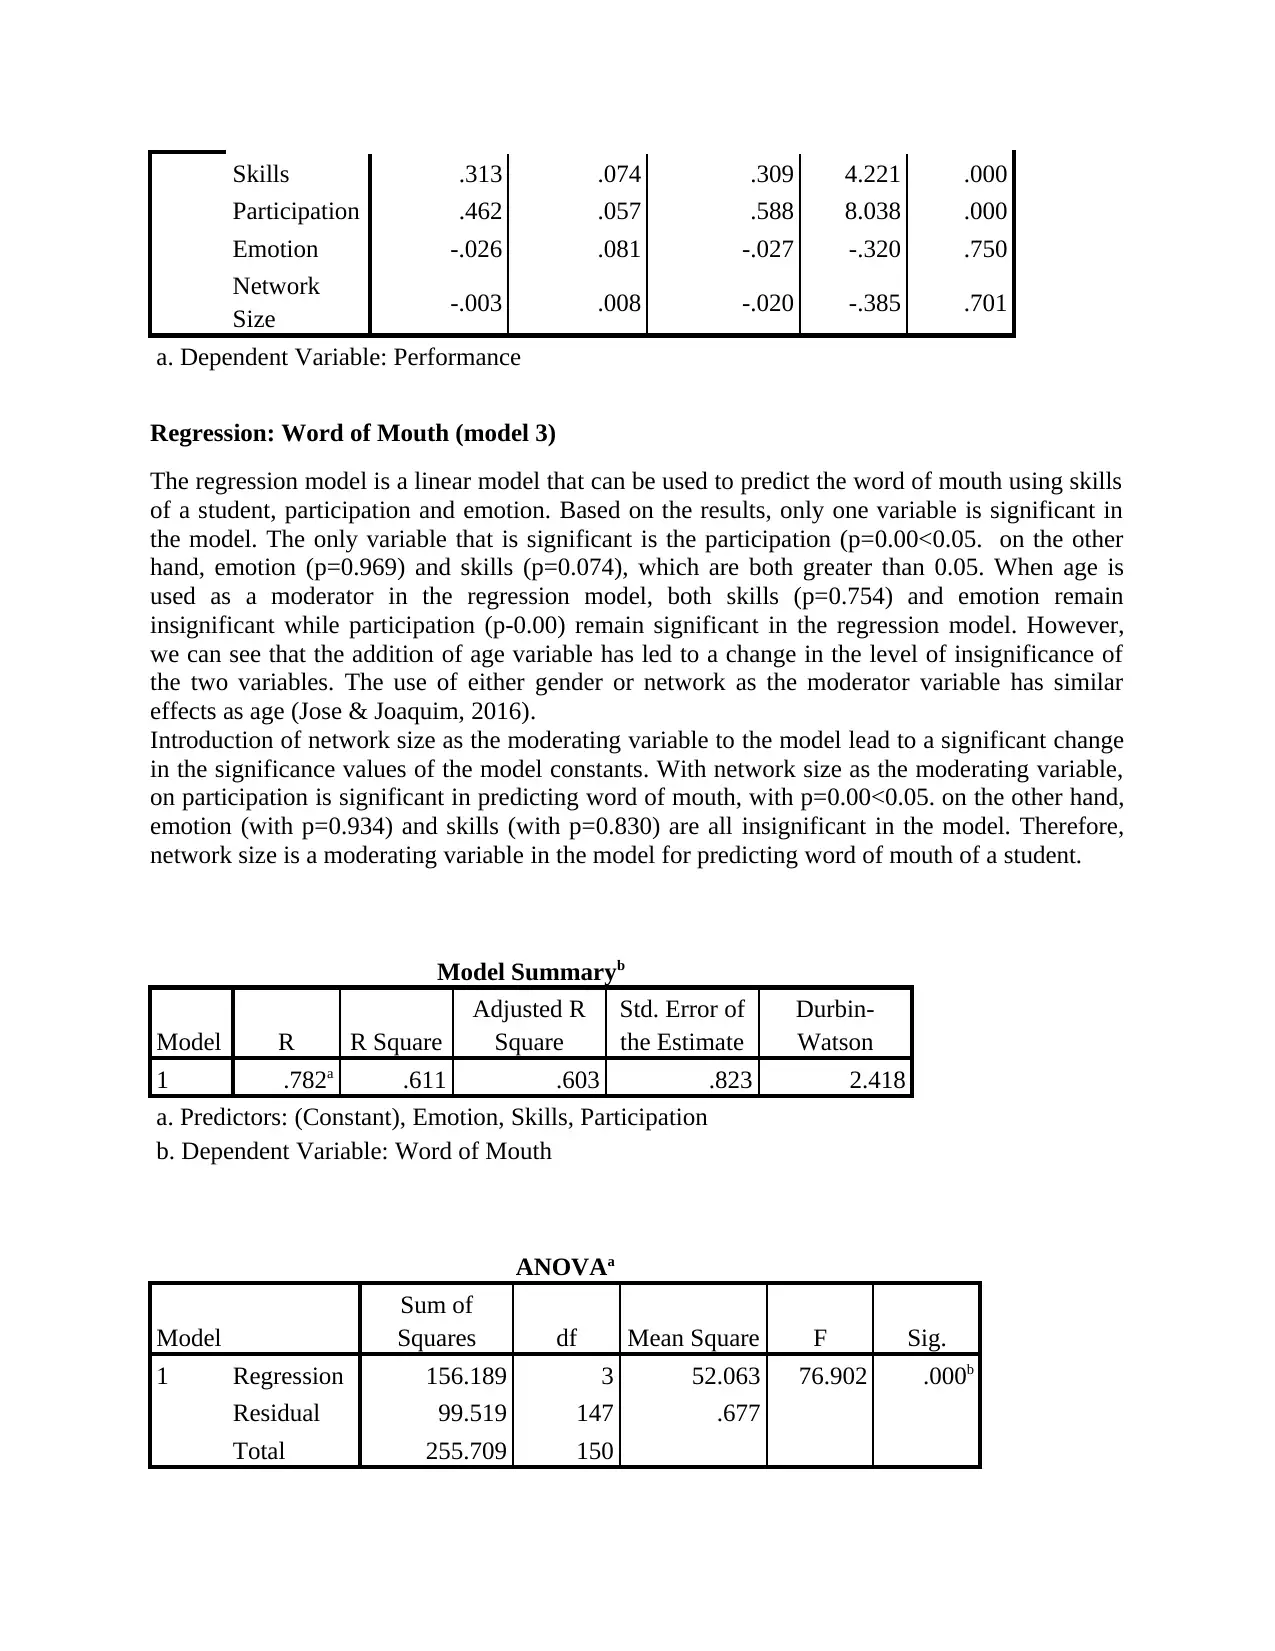
Regression: Word of Mouth (model 3)
The regression model is a linear model that can be used to predict the word of mouth using skills
of a student, participation and emotion. Based on the results, only one variable is significant in
the model. The only variable that is significant is the participation (p=0.00<0.05. on the other
hand, emotion (p=0.969) and skills (p=0.074), which are both greater than 0.05. When age is
used as a moderator in the regression model, both skills (p=0.754) and emotion remain
insignificant while participation (p-0.00) remain significant in the regression model. However,
we can see that the addition of age variable has led to a change in the level of insignificance of
the two variables. The use of either gender or network as the moderator variable has similar
effects as age (Jose & Joaquim, 2016).
Introduction of network size as the moderating variable to the model lead to a significant change
in the significance values of the model constants. With network size as the moderating variable,
on participation is significant in predicting word of mouth, with p=0.00<0.05. on the other hand,
emotion (with p=0.934) and skills (with p=0.830) are all insignificant in the model. Therefore,
network size is a moderating variable in the model for predicting word of mouth of a student.
Model Summaryb
Model R R Square
Adjusted R
Square
Std. Error of
the Estimate
Durbin-
Watson
1 .782a .611 .603 .823 2.418
a. Predictors: (Constant), Emotion, Skills, Participation
b. Dependent Variable: Word of Mouth
ANOVAa
Model
Sum of
Squares df Mean Square F Sig.
1 Regression 156.189 3 52.063 76.902 .000b
Residual 99.519 147 .677
Total 255.709 150
Participation .462 .057 .588 8.038 .000
Emotion -.026 .081 -.027 -.320 .750
Network
Size -.003 .008 -.020 -.385 .701
a. Dependent Variable: Performance
Regression: Word of Mouth (model 3)
The regression model is a linear model that can be used to predict the word of mouth using skills
of a student, participation and emotion. Based on the results, only one variable is significant in
the model. The only variable that is significant is the participation (p=0.00<0.05. on the other
hand, emotion (p=0.969) and skills (p=0.074), which are both greater than 0.05. When age is
used as a moderator in the regression model, both skills (p=0.754) and emotion remain
insignificant while participation (p-0.00) remain significant in the regression model. However,
we can see that the addition of age variable has led to a change in the level of insignificance of
the two variables. The use of either gender or network as the moderator variable has similar
effects as age (Jose & Joaquim, 2016).
Introduction of network size as the moderating variable to the model lead to a significant change
in the significance values of the model constants. With network size as the moderating variable,
on participation is significant in predicting word of mouth, with p=0.00<0.05. on the other hand,
emotion (with p=0.934) and skills (with p=0.830) are all insignificant in the model. Therefore,
network size is a moderating variable in the model for predicting word of mouth of a student.
Model Summaryb
Model R R Square
Adjusted R
Square
Std. Error of
the Estimate
Durbin-
Watson
1 .782a .611 .603 .823 2.418
a. Predictors: (Constant), Emotion, Skills, Participation
b. Dependent Variable: Word of Mouth
ANOVAa
Model
Sum of
Squares df Mean Square F Sig.
1 Regression 156.189 3 52.063 76.902 .000b
Residual 99.519 147 .677
Total 255.709 150
⊘ This is a preview!⊘
Do you want full access?
Subscribe today to unlock all pages.
Trusted by 1+ million students worldwide
a. Dependent Variable: Word of Mouth
b. Predictors: (Constant), Emotion, Skills, Participation
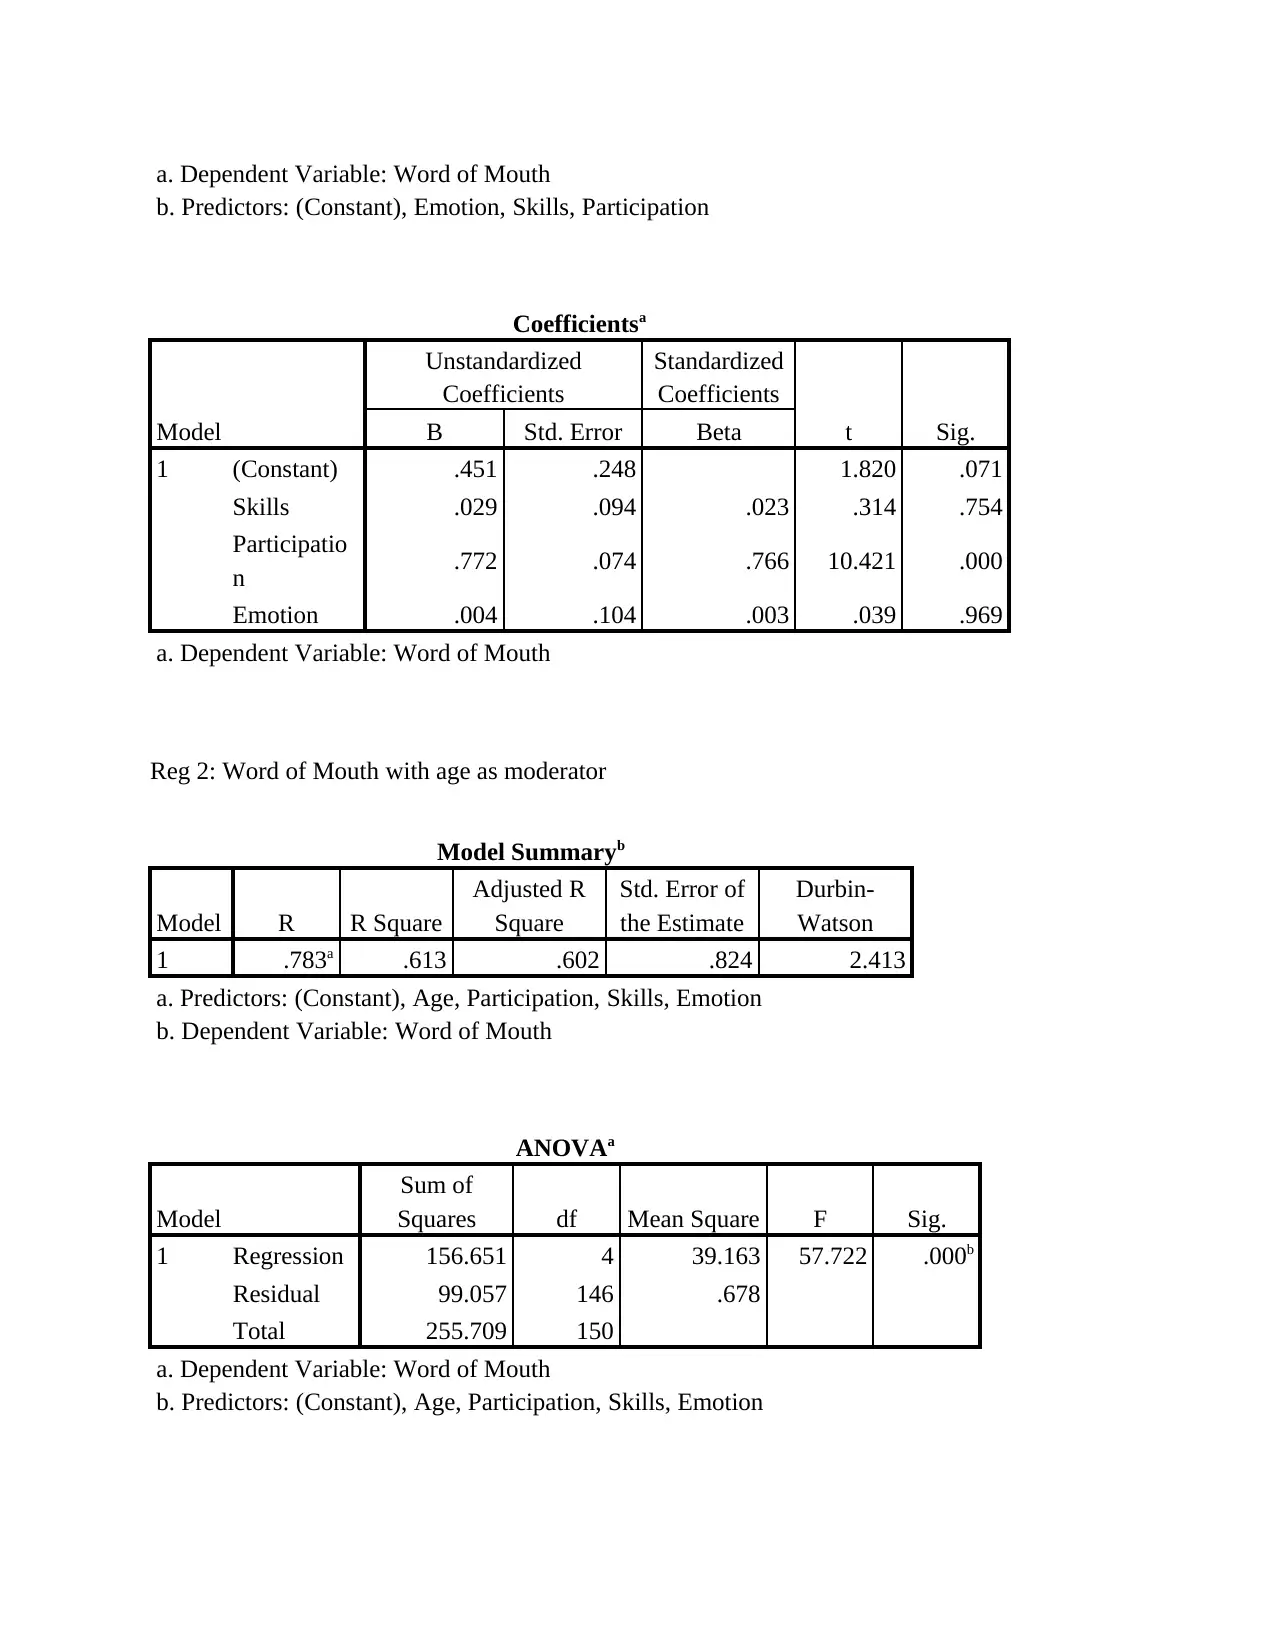
Coefficientsa
Model
Unstandardized
Coefficients
Standardized
Coefficients
t Sig.B Std. Error Beta
1 (Constant) .451 .248 1.820 .071
Skills .029 .094 .023 .314 .754
Participatio
n .772 .074 .766 10.421 .000
Emotion .004 .104 .003 .039 .969
a. Dependent Variable: Word of Mouth
Reg 2: Word of Mouth with age as moderator
Model Summaryb
Model R R Square
Adjusted R
Square
Std. Error of
the Estimate
Durbin-
Watson
1 .783a .613 .602 .824 2.413
a. Predictors: (Constant), Age, Participation, Skills, Emotion
b. Dependent Variable: Word of Mouth
ANOVAa
Model
Sum of
Squares df Mean Square F Sig.
1 Regression 156.651 4 39.163 57.722 .000b
Residual 99.057 146 .678
Total 255.709 150
a. Dependent Variable: Word of Mouth
b. Predictors: (Constant), Age, Participation, Skills, Emotion
b. Predictors: (Constant), Emotion, Skills, Participation
Coefficientsa
Model
Unstandardized
Coefficients
Standardized
Coefficients
t Sig.B Std. Error Beta
1 (Constant) .451 .248 1.820 .071
Skills .029 .094 .023 .314 .754
Participatio
n .772 .074 .766 10.421 .000
Emotion .004 .104 .003 .039 .969
a. Dependent Variable: Word of Mouth
Reg 2: Word of Mouth with age as moderator
Model Summaryb
Model R R Square
Adjusted R
Square
Std. Error of
the Estimate
Durbin-
Watson
1 .783a .613 .602 .824 2.413
a. Predictors: (Constant), Age, Participation, Skills, Emotion
b. Dependent Variable: Word of Mouth
ANOVAa
Model
Sum of
Squares df Mean Square F Sig.
1 Regression 156.651 4 39.163 57.722 .000b
Residual 99.057 146 .678
Total 255.709 150
a. Dependent Variable: Word of Mouth
b. Predictors: (Constant), Age, Participation, Skills, Emotion
Paraphrase This Document
Need a fresh take? Get an instant paraphrase of this document with our AI Paraphraser
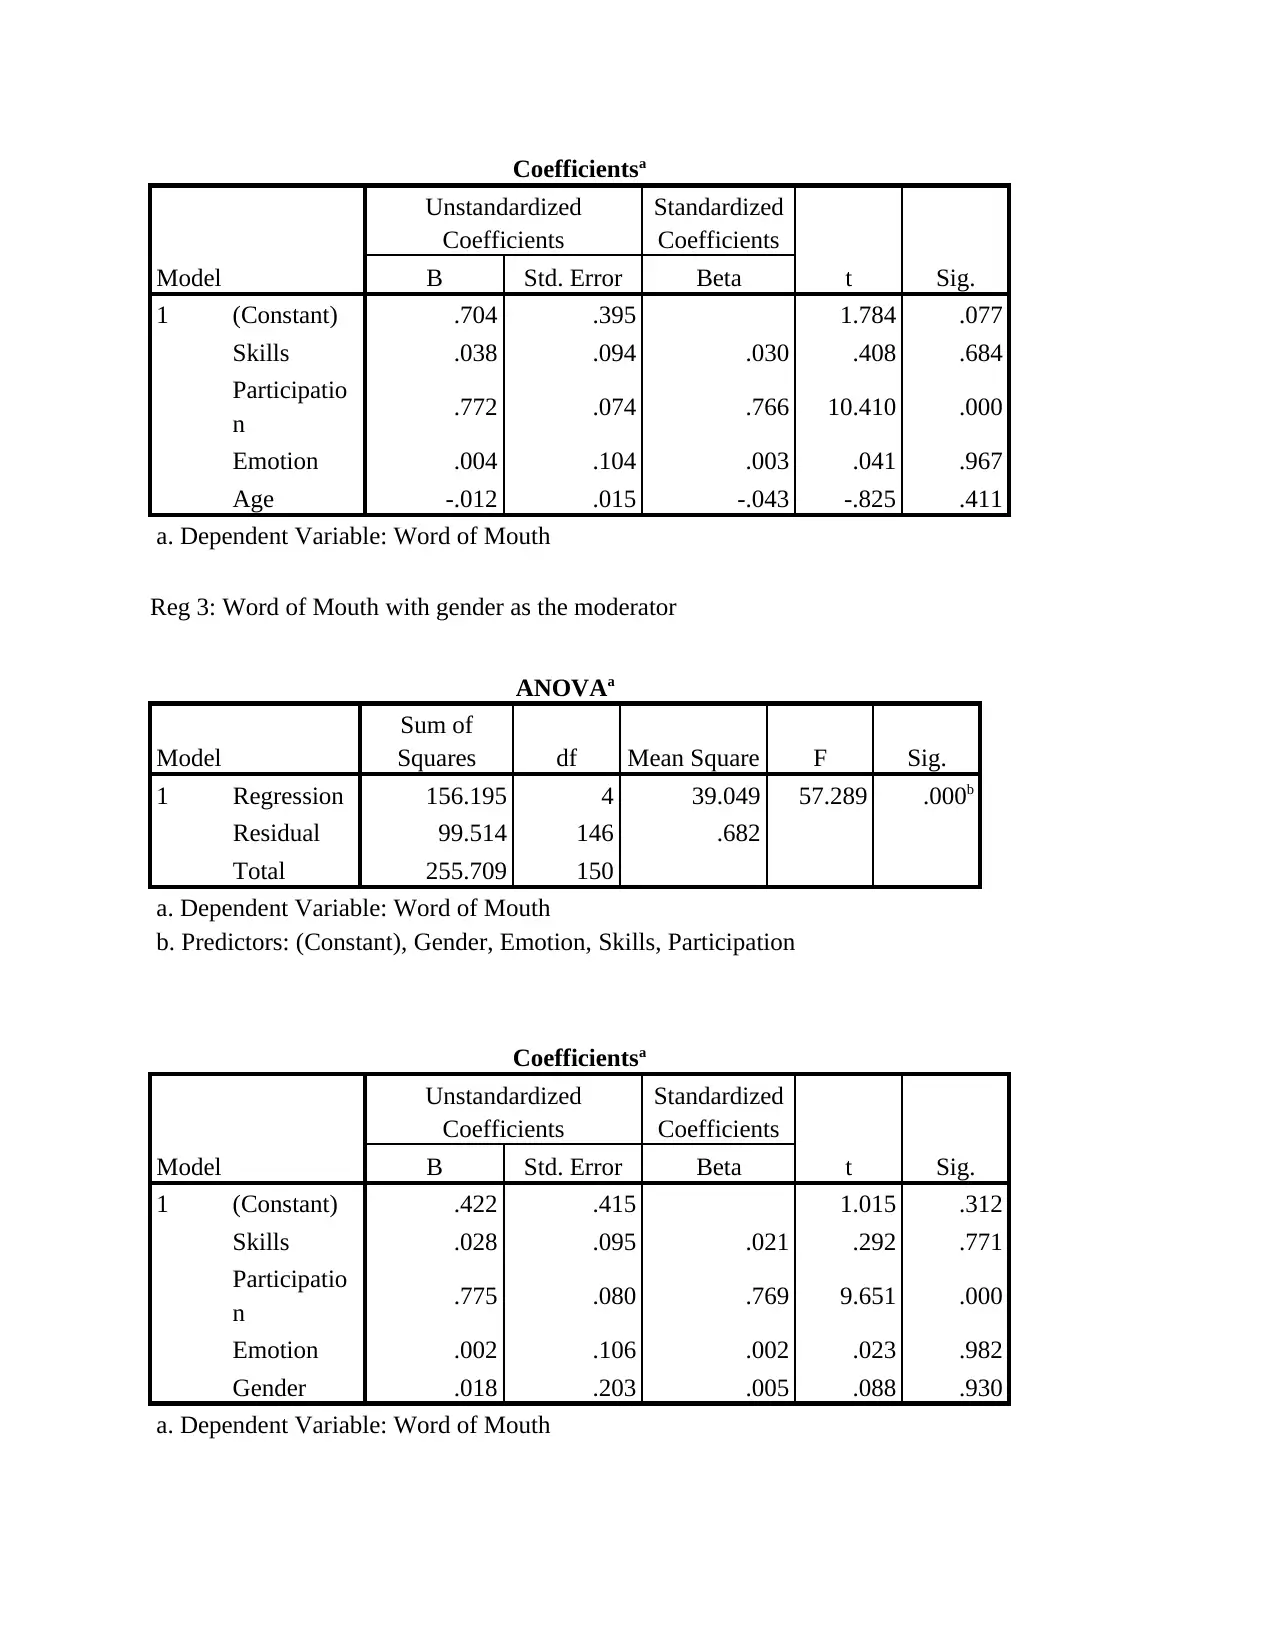
Coefficientsa
Model
Unstandardized
Coefficients
Standardized
Coefficients
t Sig.B Std. Error Beta
1 (Constant) .704 .395 1.784 .077
Skills .038 .094 .030 .408 .684
Participatio
n .772 .074 .766 10.410 .000
Emotion .004 .104 .003 .041 .967
Age -.012 .015 -.043 -.825 .411
a. Dependent Variable: Word of Mouth
Reg 3: Word of Mouth with gender as the moderator
ANOVAa
Model
Sum of
Squares df Mean Square F Sig.
1 Regression 156.195 4 39.049 57.289 .000b
Residual 99.514 146 .682
Total 255.709 150
a. Dependent Variable: Word of Mouth
b. Predictors: (Constant), Gender, Emotion, Skills, Participation
Coefficientsa
Model
Unstandardized
Coefficients
Standardized
Coefficients
t Sig.B Std. Error Beta
1 (Constant) .422 .415 1.015 .312
Skills .028 .095 .021 .292 .771
Participatio
n .775 .080 .769 9.651 .000
Emotion .002 .106 .002 .023 .982
Gender .018 .203 .005 .088 .930
a. Dependent Variable: Word of Mouth
Model
Unstandardized
Coefficients
Standardized
Coefficients
t Sig.B Std. Error Beta
1 (Constant) .704 .395 1.784 .077
Skills .038 .094 .030 .408 .684
Participatio
n .772 .074 .766 10.410 .000
Emotion .004 .104 .003 .041 .967
Age -.012 .015 -.043 -.825 .411
a. Dependent Variable: Word of Mouth
Reg 3: Word of Mouth with gender as the moderator
ANOVAa
Model
Sum of
Squares df Mean Square F Sig.
1 Regression 156.195 4 39.049 57.289 .000b
Residual 99.514 146 .682
Total 255.709 150
a. Dependent Variable: Word of Mouth
b. Predictors: (Constant), Gender, Emotion, Skills, Participation
Coefficientsa
Model
Unstandardized
Coefficients
Standardized
Coefficients
t Sig.B Std. Error Beta
1 (Constant) .422 .415 1.015 .312
Skills .028 .095 .021 .292 .771
Participatio
n .775 .080 .769 9.651 .000
Emotion .002 .106 .002 .023 .982
Gender .018 .203 .005 .088 .930
a. Dependent Variable: Word of Mouth
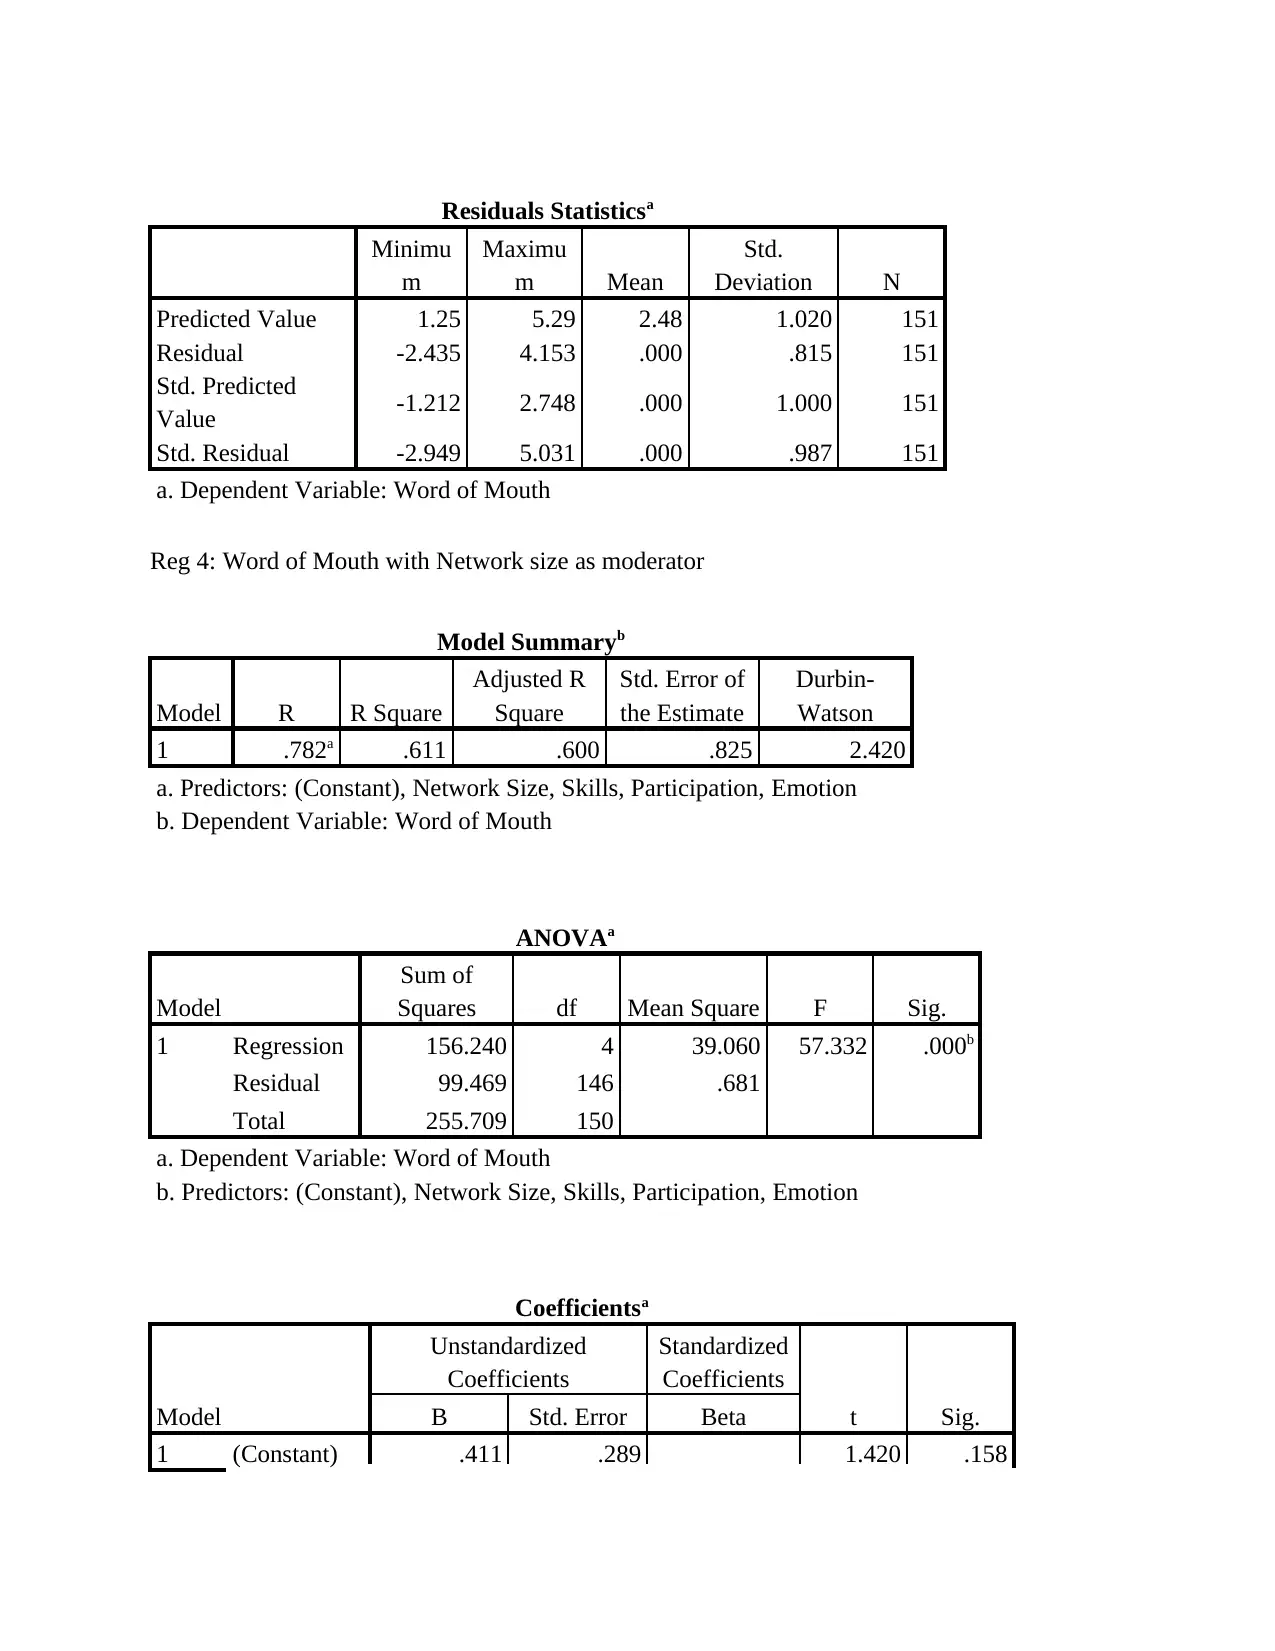
Residuals Statisticsa
Minimu
m
Maximu
m Mean
Std.
Deviation N
Predicted Value 1.25 5.29 2.48 1.020 151
Residual -2.435 4.153 .000 .815 151
Std. Predicted
Value -1.212 2.748 .000 1.000 151
Std. Residual -2.949 5.031 .000 .987 151
a. Dependent Variable: Word of Mouth
Reg 4: Word of Mouth with Network size as moderator
Model Summaryb
Model R R Square
Adjusted R
Square
Std. Error of
the Estimate
Durbin-
Watson
1 .782a .611 .600 .825 2.420
a. Predictors: (Constant), Network Size, Skills, Participation, Emotion
b. Dependent Variable: Word of Mouth
ANOVAa
Model
Sum of
Squares df Mean Square F Sig.
1 Regression 156.240 4 39.060 57.332 .000b
Residual 99.469 146 .681
Total 255.709 150
a. Dependent Variable: Word of Mouth
b. Predictors: (Constant), Network Size, Skills, Participation, Emotion
Coefficientsa
Model
Unstandardized
Coefficients
Standardized
Coefficients
t Sig.B Std. Error Beta
1 (Constant) .411 .289 1.420 .158
⊘ This is a preview!⊘
Do you want full access?
Subscribe today to unlock all pages.
Trusted by 1+ million students worldwide
1 out of 22
Your All-in-One AI-Powered Toolkit for Academic Success.
+13062052269
info@desklib.com
Available 24*7 on WhatsApp / Email
![[object Object]](/_next/static/media/star-bottom.7253800d.svg)
Unlock your academic potential
Copyright © 2020–2026 A2Z Services. All Rights Reserved. Developed and managed by ZUCOL.